




 NFSIJ Home



Abstract
Natural antioxidant substances in food are garnering increasing interest for the treatment of diseases linked to oxidative stress. This study aimed to analyze the microbiological, sensory, phytochemical and antioxidant profiles of kombuchas using black tea, green tea, and lemongrass. The kombuchas were prepared across various fermentation periods: 7, 14, 21, and 28 days. Microbiological and physicochemical analyses were conducted alongside sensory evaluations. Phytochemical screening was carried out as was determined using conventional method. Finally, antioxidant potential was assessed using DPPH. and ABTS.+ radical scavenging assays. All the beverages were of a good microbiological quality with an absence of Staphylococcus aureus, Salmonella and Shigella after 21 days of fermentation. The pH had decreased from 6.2 to 4, inversely correlated with an increase in titratable acidity. Lemongrass samples fermented for 7 and 14 days received the highest organoleptic ratings, achieving general acceptability scores of 4.10 and 4.20 respectively. The maximum total polyphenol and tannin contents were observed after 28 days of fermentation in lemongrass kombucha, at (4.47 ± 0.17 mg GAE/g) and (18.75 ± 3.39 mg CE/g), respectively. The best anti-radical activity in the ABTS assay was obtained with lemongrass kombucha after 14 days of fermentation (SC₅₀ = 1.40 μg/mL). Contrary, green tea kombucha harvested at 21 days demonstrated significant DPPH radical scavenging capacity (SC₅₀ = 203.3 μg/mL). The results of this research allow us to say that lemongrass kombucha is a powerful antioxidant in the ABTS assay. due to its composition of bioactive substances.
Keywords:Kombucha, Black Tea, Green Tea, Lemongrass, Antioxidants, Polyphenols, Sensory Analysis.
Introductıon
Kombucha is a slightly effervescent beverage produced through the fermentation of a sweetened tea infusion by a Symbiotic Culture of Bacteria and Yeast (SCOBY) [1]. While traditionally prepared using black or green tea, kombucha has recently seen a global resurgence as a functional beverage. Its diverse health-promoting properties, including antioxidant, antimicrobial, and anti-inflammatory activities, as well as its positive effects on digestion and lipid metabolism drive this interest [2]. Antioxidants, whether derived from natural sources (such as tea, fruits, spices, and medicinal plants) or synthetic origins, play a critical role in mitigating oxidative stress a primary mechanism underlying various chronic diseases [3]. However, synthetic antioxidants are increasingly scrutinized due to concerns regarding their side effects and potential toxicity. In contrast, natural antioxidants offer a protective pathway against reactive oxygen species (ROS) and neurodegenerative or metabolic disorders [4]. Within this framework, kombucha often categorized as a “nutraceutical” or “alicament” represents an innovative alternative. The fermentation process enhances the solubility and bioavailability of bioactive metabolites, including polyphenols (phenolic acids, flavonoids, and tannins), organic acids, peptides, and B-complex vitamins, thereby potentiating the overall antioxidant capacity of the beverage [5,6]. Furthermore, as a slightly acidic and sparkling fermented drink, kombucha uniquely combines nutritional functionality with sensory appeal, facilitating high consumer acceptability..
The valorization of fermented beverages derived from local plant resources offers a dual advantage, both nutritionally and functionally, particularly in the context of nutritional transition and chronic disease prevention. In Cameroon, plants such as lemongrass (Cymbopogon citratus), green tea, and black tea (Camellia sinensis) are traditionally utilized for their antioxidant, digestive, and immunomodulatory effects [7-9]. Although the health benefits of kombucha are generally attributed to its high content of bioactive secondary metabolites, the antioxidant quality of the final product remains heavily dependent on the initial plant substrate and the fermentation duration. Evaluation methods for antioxidant activity vary based on the nature of the substances involved; assays such as DPPH and ABTS are standard protocols for assessing the antioxidant properties of beverages, foods, and plant extracts [10].
Previous studies showed the significant content of phenolic compounds (ranging from 182.42 to 509.41 mg GAE/g dry extract), total flavonoids (ranging from 15.83-53.05 mg QE/g dry extract) and total tannins depending in fermentation time in kombucha black tea prepared by decoction. In the same research, the results displayed a good antioxidant profile with SC 50 values of DPPH• and ABTS• were 14.57 μ g/mL; and 21.47 μ g/mL after 14 and 21 days of fermentation respectively. However, to date, and to the best of our knowledge, no systematic scientific study has been conducted in Cameroon regarding the sensory performance of kombuchas formulated separately from Cameroonian black tea, green tea, and lemongrass. This lack of data hinders the optimization of local kombucha formulations tailored to consumer preferences and preventive nutrition requirements.
The present study aims to address this gap by evaluating the sensory characteristics, phytochemical characterization and antioxidant activity (via DPPH and ABTS assays) of three types of kombucha formulated from Cameroonian black tea, green tea, and lemongrass infusions across different fermentation periods. This approach seeks to identify the most promising substrate in terms of functional and organoleptic quality, with a view toward public health and agri-food innovation.
Material and Methods
Materials
The kombucha samples were prepared using exclusively local ingredients. The symbiotic culture of bacteria and yeast (SCOBY) or starter was sourced from a local producer and maintained in a continuous culture at room temperature in the Laboratory of Phyto biochemistry and Medicinal Plant Studies. Lemongrass (Cymbopogon citratus) was harvested, in Yaoundé and identified at the National Herbarium of Cameroon (Identification No. 48536/SFR/Cam). Green tea (Camellia sinensis) was purchased from a market in the Yaoundé VI district, while black tea and a Cameroonian brand of brown sugar were obtained from a local supermarket.
Preparation of Kombucha tea and lemon grass
After harvesting, the fresh lemongrass was first cleaned with water, then dried in an oven at 50°C for 15 minutes to evaporate the water, then the quantity needed to prepare the kombucha was weighed. Kombucha was produced through infusion with black tea (KB), green tea (KG) and lemongrass bases across different fermentation periods (7, 14, 21, and 28 days) [11]. In summary, 2 liters of tap water was brought to 80–90°C in a sterilized container. Next, 20 grams of tea leaves or lemongrass, plus 160 g of brown sugar powder, were mixed in. The blend steeped for 15 minutes, then cooled to ambient temperature and strained to eliminate solids. The resulting liquid went into a sterile 3 L plastic jar, where 3% (w/v) SCOBY biofilm was introduced. It was covered with a breathable white cloth tied with string and fermented from direct sunlight (20–28°C) for the specified times (7–28 days). Samples of 500 mL were withdrawn at each interval, oven-dried at 45°C for 48 hours to yield dry kombucha powders, following the identical process for both tea types. These powders were kept at 4°C pending analysis.
Microbiological and physicochemical analysis of kombucha
Microbiological analysis: Microbiological analysis was performed using the serial dilution and agar culture. The process involved sub culturing and colony counting on solid media. Five distinct culture media were utilized to screen for potential microbial contaminants: Potato Dextrose Agar (PDA), Mueller- Hinton Agar (MHA) supplemented with chloramphenicol, Eosin Methylene Blue (EMB) agar, Salmonella-Shigella Agar (SSA), and Mannitol Salt Agar (MSA).
In practice, 500 μL of each sample was aseptically collected using a micropipette and inoculated via the spread-plate method onto Petri dishes containing both selective and general-purpose media. The plates were sealed with Parafilm and incubated at 37°C for 24 to 72 hours. Following incubation, microbial growth was assessed through colony counting. Putative identification of the strains was conducted based on observed morphological characteristics. The morphological profiles for the pathogens were defined as follows: Salmonella spp. and Shigella spp. on SSA presented as transparent to slightly opaque colonies, with Salmonella displaying a distinct black center. Escherichia coli on EMB agar exhibited characteristic metallic green sheen colonies, while Staphylococcus aureus on MSA appeared as yellow colonies surrounded by a yellow halo, indicating mannitol fermentation [12].
The number of characteristic colonies for each pathogen was recorded, and the total viable bacterial count per milliliter (CFU/ mL) was calculated using the formula below. The resulting data were compared against established microbiological standards for fermented beverages to evaluate the safety profile of the produced kombucha [13].
Number of colonies formed (CFU/ml) = ((number of colonies x dilution factor) / Volume of inoculated sample (ml)).
Determination of pH and titratable acidity: The pH measurement is based on the quantification of H+ ions present in the solution. Briefly, a pH meter (Hanna Instruments) was calibrated using standard buffer solutions at pH 4, 7, and 10, according to the manufacturer’s instructions. The electrode was rinsed with distilled water between each measurement to prevent cross-contamination. It was then immersed into each homogenized kombucha sample, and readings were recorded once stabilization was reached (approximately 30 seconds). Acidity measures the total concentration of acids within a solution, a value that is inversely proportional to the pH level. In practice, 10 mL of each sample was transferred into a beaker, and 2 to 3 drops of phenolphthalein were added as a color indicator. A burette was filled with a 0.1 N NaOH solution. Titration was performed by incrementally adding the NaOH titrant while maintaining continuous stirring of the sample until a persistent pink coloration appeared and remained for at least 30 seconds (endpoint). Titratable acidity was estimated in g/L and determined using the following formula:
Titratable acidity (g/L) = (NaOH volume (mL) x NaOH normality x 60.05) / Sample volume
With 60.05 = Molecular weight of acetic acid (in g/mol) and normality of NaOH = 0.1 N.
Sensory analysis
The sensory analysis was performed by a panel of 60 male and female volunteers. They were students at the University of Yaounde I, Cameroon. Participants included “naïve” (untrained) aged 20 to 27 years. Two types of scales were used: a 5-point Metric Scale ranging from 1 (very unpleasant) to 5 (very pleasant) to assess the general acceptability of the samples; and a Ranking Scale: used to order the samples. In this scale, the value does not represent a quality level but rather the ordinal position of the sample within the series. Preference test results provided insight into both general acceptability and the final rank of each beverage. After completing the hedonic scales, assessors received a sensory pre-prepared checklist featuring 25 sensory attributes covering appearance, odor, flavor, color and overall acceptability. These attributes were identified during a preliminary session by a trained panel. To develop sensory descriptors, twelve kombucha samples were presented to the assessors. Initially, they generated individual descriptors using a modified grid method. Through open discussion led by the panel leader, they finalized the most suitable descriptors, along with their definitions and evaluation methods. The descriptors were arranged as follows: for color—very clear, clear, colorless, dark and very dark; for odor –very weak, weak, odorless, strong and very strong; for covering appearance- very viscous, viscous, indifferent, fluid and very fluid; for flavor- bitter, sour, neutral, acidic and sweet; for overall acceptability- very unpleasant, unpleasant, indifferent, pleasant and very pleasant. Assessors had to select all terms they deemed appropriate for describing the infusions.
The following attributes were evaluated: color, odor, texture, flavor, and overall acceptability to identify the most preferred sample [14]. Twelve uniform, coded beverage samples were presented simultaneously to the panelists in small, white disposable cups. Participants were provided with a glass of water to cleanse the palate between samples. Judges were asked to rate each descriptor on a scale corresponding to designated qualitative terms based on their perception.
Phytochemical characterization
Phytochemical qualitative screening: Phytochemical screening was performed to determine the group of secondary metabolites (alkaloids, saponins, steroids, terpenoids, coumarins, catechins, quinones, phenols, flavonoids and tannins) present in different extract as described below.
a. Test for alkaloids: A test tube was filled with 6 mL of the
extract. Dragendorff’s reagent, 1 mL of potassium bismuth iodide
solution, was then added and agitated. The presence of alkaloids
is indicated by the formation of an orange-red precipitate [15].
b. Test for saponins: After being powdered, 2 g was
heated in 20 mL of distilled water. 5 mL of distilled water and
10 mL of filtrate were vigorously shaken. There were saponins
present because foaming appeared [15].
c. Test for steroids: A drop of concentrated H2SO4 was
added after 1 g of Kombucha extract had been diluted in a few
drops of acetic acid. The color becoming green signified the
presence of steroids [16].
d. Test for terpenoids: Each sample weighed 0.2 g
and 2 mL of chloroform and 3 mL of concentrated H2SO4 were
combined. The presence of terpenoids was indicated by a reddishbrown
coloring [17].
e. Test for coumarins: An extract (2 mL) was shaken in
a 3 ml, 10% aqueous NaOH solution. The yellow hue indicated a
successful outcome [18].
f. Test for catechins: A few drops of 1% lead acetate
were mixed with 2 mL of the extract. The presence of tannins
was indicated by a yellowish precipitate. The Stiasny reagent has
demonstrated the presence of catechins (formalin 30% in HCl
extract: 2/1 v/v) [19].
g. Test for quinones: One milliliter of sodium hydroxide
was applied for each milliliter of filtered beverage. The formation
of blue color shows the presence of quinones [15].
h. Test for phenols: A few drops of ferric perchloride
(FeCl3) (10%) were added to 2 mL of extract, and the formation
of an intense black-green precipitate was the sign of the presence
of phenols [19].
i. Test for flavonoids: In a tube 0.5 g of NaOH was
dissolved in 5 mL of water (diluted NaOH), then mixed 1 mL of
HCl in 2 ml of water (diluted HCl). Sodium hydroxide test for
flavonoids: 2ml extract + 0.5ml NaOH followed by the addition of
0.5 mL dilute HCl. The formation of a yellow solution with dilute
NaOH which fades with dilute HCl is an indication of the presence
of flavonoids [19].
Phenolics quantification:
a. Phenolics content: Total phenolic content was evaluated according to the spectrophotometric method using the protocol described by Singleton et al. [20]. Briefly, 0.2 mL of the sample solution and 0.8 mL of Folin-Ciocalteu reagent (1/10e) were introduced into a test tubes. The test tubes were shaken for a few minutes (5 min) and 2 mL of sodium carbonate solution (7.5% Na2CO3) was added to the mixture. The tubes were then incubated for 1 hour in the dark and the absorbance was read against a blank at 765 nm. Gallic acid was used as standard compound (1mg/mL).
The results were expressed in milligram equivalent of GAE per
gram of dry extract using the formula below.
P=CxV/M
P= Phenolic content (mg GAE /g dry extract)
C=Concentration of phenolic content extract (EG) obtained
from the calibration cuves (mg/mL)
V=Volume (mL)
M=weight of phenolic extract (g).
b. Total flavonoid content: The flavonoids content was suggested by Kouadio et al., (2021). A volume of 0.1 mL of the samples (100 μg/mL); 0.3 mL of distilled water and 0.03 mL of NaNO2 5% solution were added into a test tubes. The test tubes were shaken for 5 minutes and 2mL of sodium carbonate solution (7.5% Na2CO3) was added to the mixture. After 5minutes of incubation, 0.06 mL of an aluminum chloride reagent (AlCl3 10%) was added, and the tests tubes were incubated for 1minute. Then, 0.4mL of 1 mM NaOH and 2 mL of distilled water were added, the mixture was vortexed and the absorbance was read against a blank at 510 nm. The number of flavonoids was calculated using a standard solution of quercetin equivalent (100 μg/mL) and the results were expressed in milligrams of QE per gram of dry extract.
c. Tannin content: Estimation of Tannin was performed using the Folin Denis method (FDR) [21]. 1mL of the sample solution, 5mL of FDR reagent and 10mL of 10% sodium carbonate (in distilled water) were introduced into a test tubes. The test tubes were shaken for a few minutes (5 min) and blue color was measured at 700 nm after 30min. A standard graph was drawn by plotting the concentration versus the absorbance of the standard tannic acid and the number of tannins present in the sample was calculated. The results were expressed in milligram equivalent of tannic acid per gram of dry extract.
Antioxidant activity assays
Preparation of kombucha extracts: Kombucha solutions were dehydrated in a drying oven at 50°C for two days to obtain the dry extracts required for the assays. A stock solution of the kombucha extracts was prepared at a concentration of 100 mg/ mL by dissolving 100 mg of each extract in 1 mL of 100% pure dimethyl sulfoxide (DMSO). During the assay, the final DMSO concentration was adjusted to 0.5% in the initial wells to prevent any potential cytotoxic interference.
DPPH radical scavenging assay: The DPPH radical scavenging test was performed according to the protocol described by Xiao, et al. [22]. The extracts underwent serial dilution to achieve final concentrations of 1000, 500, 250, 125, 62.5, and 31.25 μg/mL. Subsequently, 25 μL of each diluted extract was transferred to a 96-well plate, followed by the addition of 75 μL of 0.02% (w/v) 2,2-diphenyl-1-picrylhydrazyl (DPPH•) solution in methanol. The final concentrations of the tested extracts ranged from 500 to 15.62 μg/mL using a two-fold dilution factor. The plate was incubated at room temperature in the dark for 30 minutes, after which absorbance was measured at 517 nm using a microplate spectrophotometer (TECAN M200). Ascorbic acid served as the reference antioxidant under identical conditions, with concentrations ranging from 50 to 1.56 μg/mL. The negative control consisted of 100 μL of DPPH solution without any antioxidant, while blanks consisting of 25 μL of extract solution and 75 μL of distilled water were used to account for potential interference from natural fluorescence. Antioxidant activity was expressed as the percentage of inhibition of DPPH• radical reduction, calculated using the following formula: Inhibitory percentage= ((OD Control - OD Sample)/OD Control) *100
OD: Optical Density; Control=reagent without sample.
The calculated inhibition percentages were used to determine the 50% radical scavenging concentration (SC50) using GraphPad Prism software (version 8.0.1) by plotting dose-response curves (log([concentration]) = Inhibitory percentage (%)) (Christodoulou et al., 2022). Any extract exhibiting an SC50 > 1000 μg/mL was considered to lack significant radical scavenging properties at the tested concentrations.
ABTS radical scavenging assay: The ABTS radical scavenging test was conducted according to the protocol described by Liu et al. [23].
a. Preparation of the ABTS•+ solution: The ABTS+ solution was prepared by reacting a 4.9 mM potassium persulfate (K2S2O8•H2O) solution with a 7 mM ABTS solution in water. The mixture was kept in the dark at room temperature for 15 hours to allow for the formation of the ABTS+ radical cation. Before use, the resulting 7 mM ABTS stock solution was diluted 20-fold with distilled water [23,24]. Extracts were diluted to achieve final concentrations of 1000, 500, 250, 125, 62.5, and 31.25 μg/mL. Subsequently, 25 μL of each dilution was added to the wells of a 96-well plate, followed by 75 μL of the 0.175 mM ABTS•+ solution. The final concentrations of the tested extracts ranged from 500 to 15.62 μg/mL using a two-fold dilution factor. The plate was incubated at room temperature in the dark for 30 minutes. Absorbance was then measured at 734 nm using a microplate spectrophotometer (TECAN M200). Ascorbic acid served as the reference antioxidant under identical conditions, with concentrations ranging from 50 to 1.56 μg/mL. The negative control consisted of 100 μL of the ABTS solution without the antioxidant, while blanks (25 μL of extract solution + 75 μL of distilled water) were used to detect potential interference caused by natural fluorescence. The reduction of the ABTS•+ radical cation results in the decolorization of the solution, the intensity of which is measured by the decrease in absorbance at 734 nm post-incubation. A lower final absorbance value indicates higher radical scavenging activity of the extract [25,26]. The inhibition percentages were calculated using the formula below:
Inhibitory percentage= (OD Control-OD Sample)/OD Control)*100
OD: Optical Density; Control=reagent without sample
The 50% radical scavenging concentrations (SC50) were calculated as described above.
Statistical analysis
Data analysis was performed using GraphPad Prism software (version 8.0.1) and SPSS test. A one-way Analysis of Variance (ANOVA), followed by Tukey’s post-hoc test, was employed to compare means at a significance level of 5% (p < 0.05). All analyses were conducted in duplicate, and the results are presented as mean ± standard deviation.
Results
Microbiological quality of the kombucha beverages
To ensure these beverages were free from contamination, they were subjected to rigorous microbiological analysis.
The results of the microbiological assessments with specify culture media for the various kombucha beverages (kombucha black tea, kombucha green tea and lemon grass) in Tables 1-3 below:
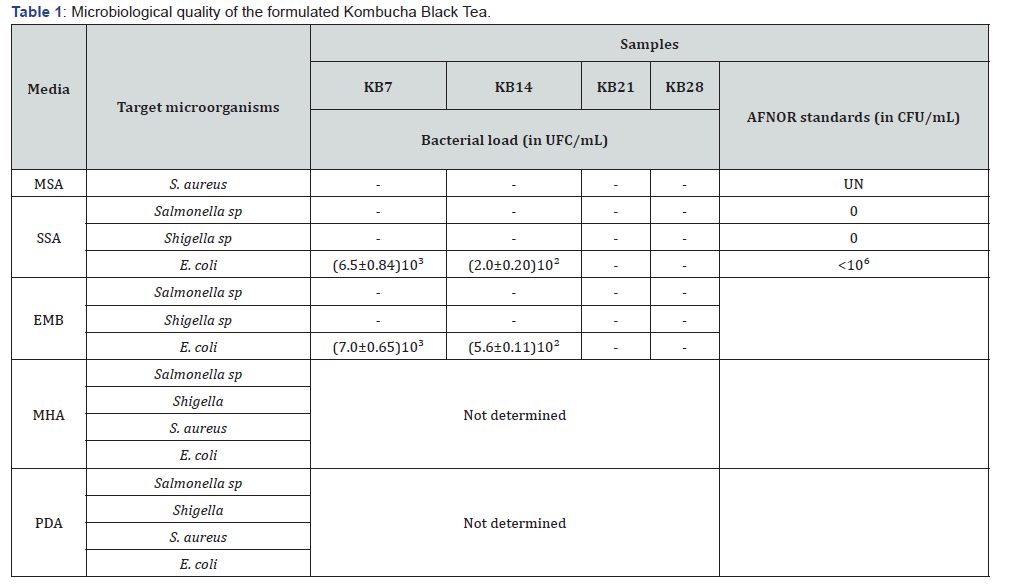
MSA : Mannitol Salt Agar ; EMB : Eosin Methylene Blue Agar ; MHA : Mueller-Hinton Agar ; PDA : Potato Dextrose Agar ; SSA : Salmonella-Shigella Agar ; S. aureus : Staphylococcus aureus, Salmonella sp : Salmonella species ; Shigella sp : Shigella species ; E. coli : Escherichia coli ; KB : Kombucha Black tea ; 7, 14, 21, and 28 : different fermentation times ; - : absent ; UN : Unknown.
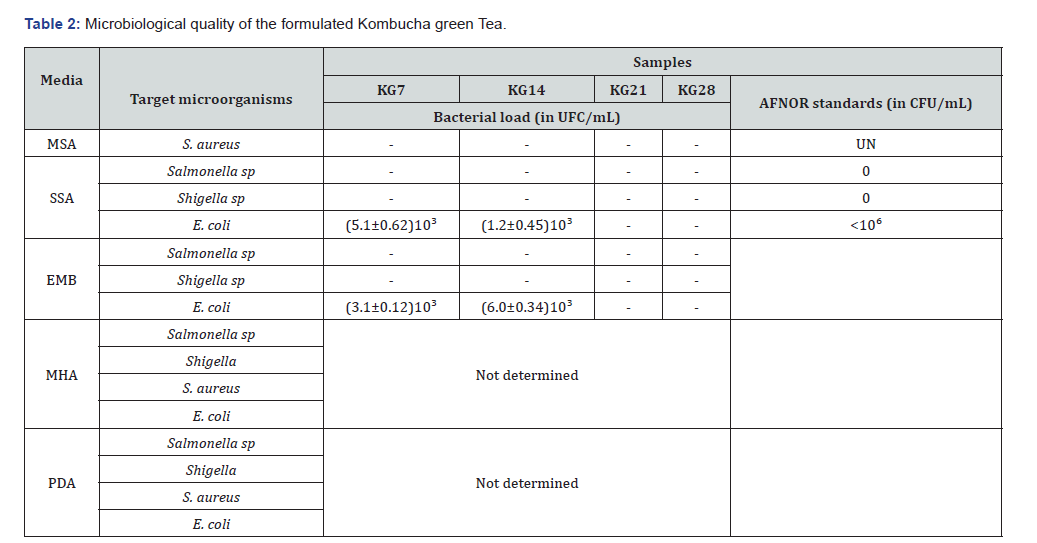
MSA: Mannitol Salt Agar; EMB: Eosin Methylene Blue Agar; MHA: Mueller-Hinton Agar; PDA: Potato Dextrose Agar; SSA: Salmonella-Shigella Agar; S. aureus: Staphylococcus aureus, Salmonella sp: Salmonella species; Shigella sp: Shigella species; E. coli: Escherichia coli; KG: Kombucha Green tea; 7, 14, 21, and 28: differents fermentation times; -: absent; UN: Unknown
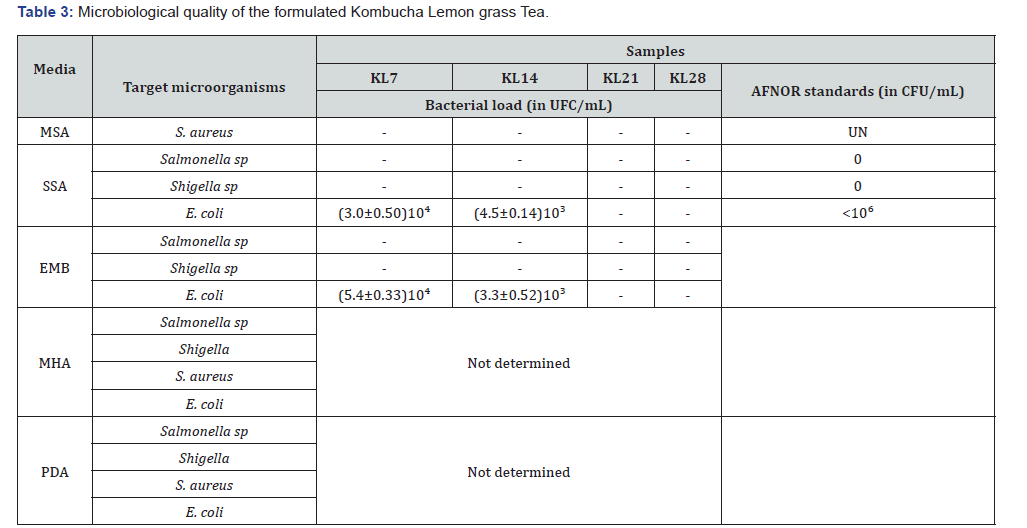
MSA: Mannitol Salt Agar; EMB: Eosin Methylene Blue Agar; MHA: Mueller-Hinton Agar; PDA: Potato Dextrose Agar; SSA: Salmonella-Shigella Agar; S. aureus: Staphylococcus aureus, Salmonella sp: Salmonella species; Shigella sp: Shigella species; E. coli: Escherichia coli; KL: Lemongrass kombucha 7, 14, 21, and 28: different fermentation times ; -: absent; UN: Unknown.
From the results above that E. coli was detected in the fermented black tea, green tea, and lemongrass kombucha beverages. Furthermore, a consistent decrease in microbial load was observed across all samples from day 7 to day 14. Although E. coli strains were identified, the microbial counts remained well within the limits established by AFNOR standards for fermented beverages (<106 CFU/mL) [27]. Notably, S. aureus, Salmonella spp., and Shigella spp. were not detected in any of the beverages tested.
pH and Titratable acidity
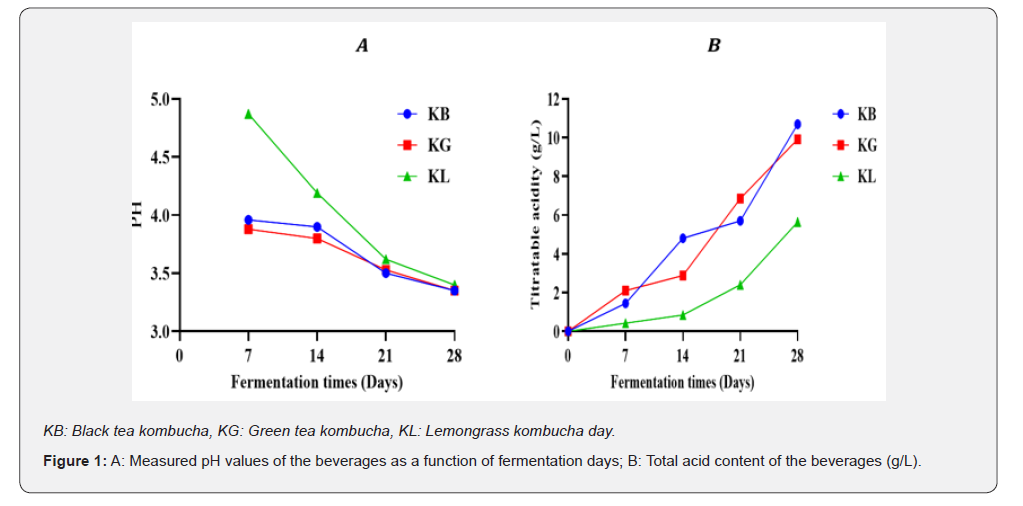
Figures 1A and 1B illustrate the evolution of pH and titratable acidity, respectively, across the different beverages as a function of fermentation duration. The data presented in these graphs indicate a decrease in pH over time; conversely, the measured acidity levels show a corresponding increase. Furthermore, the acid concentration was higher in the black and green tea kombucha samples compared to the lemongrass samples.
Sensory profile of black tea, green tea, and lemongrass kombucha
The values presented in Table 2 were derived from the mean scores (±standard deviation) assigned by each panelist to the samples evaluated during the session.
Black tea kombucha: Sensory evaluation revealed relatively stable overall characteristics across the fermentation period. Scores remained within a narrow range, with color maintaining a dark hue typical of black tea despite a slight, non-significant fading (p > 0.05). Similarly, odor was consistently perceived as relatively strong (scores between 3 and 4), showing a nonsignificant decrease over time (p > 0.05). Texture remained predominantly fluid, with a slight, non-significant increase in fluidity as fermentation progressed (p > 0.05). In contrast, flavor exhibited a more pronounced evolution, with scores ranging from 3.23 to 4.00 and a significant shift toward increased acidity during fermentation (p < 0.05) (Table 3). (Note: Adjusted from “decreasing acidity” to “shifted toward acidity” as fermentation typically increases acidity in kombucha).
Green tea kombucha: Sensory evaluation showed that color scores ranged from 2.48 (KG7) to 2.93 (KG28), reflecting initially light samples that underwent a non-significant fading over the fermentation period (p > 0.05). Odor scores varied from 2.68 to 3.45 (KG7 to KG28), indicating a non-significant intensification of aroma during fermentation (p > 0.05). Texture scores, ranging from 3.57 to 3.78 (KG28 and KG14, respectively), revealed that the beverages maintained a consistently fluid consistency throughout the process. Flavor scores ranged between 3.28 (KG28) and 3.57 (KG7), suggesting a non-significant decrease in perceived flavor intensity over time (p > 0.05) (Table 4).
Lemongrass kombucha: For lemongrass kombucha, color scores ranged from 1.73 (KL14) to 1.85 (KL28), reflecting a yellowish tint and indicating that all samples tended toward a light, pale coloration. Odor scores varied from 2.27 to 2.63 (KL14 to KL7). Texture scores ranged between 3.9 ± 0.76 (KL28) and 4.03 ± 0.92 (KL21), showing that the beverages consistently exhibited high fluidity. Flavor scores ranged from 3.60 (KL28) to 4.78 (KL7), with a profile oscillating between acidic and sweet notes, and a progressive loss of sweetness over time in favor of more pronounced acidity.
Overall acceptability (OA): Overall acceptability scores ranged from 2.33 to 4.20, corresponding to KG28 and KL14, respectively. From a global perspective, lemongrass kombucha at 7 (KL7), 14 (KL14), and 21 days (KL21), as well as green tea (KG7) and black tea (KB7) after 7 days of fermentation, were the most preferred. Conversely, green tea kombucha fermented for 28 days was the least appreciated sample.
Phytochemical Characterization
Phytochemical screening: The qualitative phytochemical screening revealed a heterogeneous distribution of secondary metabolites across the different kombucha samples (Table 5). Saponins and quinones were consistently detected in all samples regardless of substrate type or fermentation time. Polyphenols and flavonoids were also widely present, except in the lemongrass kombucha at day 7 (KC7), where they were not detected. Terpenoids were only identified in black tea kombucha (KT7, KT14, KT28) and were absent in all green tea and lemongrass samples. Catechic tannins were present in black tea kombucha at early fermentation stages (KT7 and KT14) and in all green tea samples, but absent in lemongrass kombucha. Simple phenols were selectively detected in green tea kombucha (KV7, KV14, KV21) and in KC7, while anthraquinones were exclusively identified in KV28. Coumarins were present in all black and green tea kombucha samples and appeared only at the late stage of fermentation (KC28) in lemongrass kombucha. In contrast, steroids, alkaloids, gallic tannins, anthocyanins, and mucilage were not detected in any of the samples.
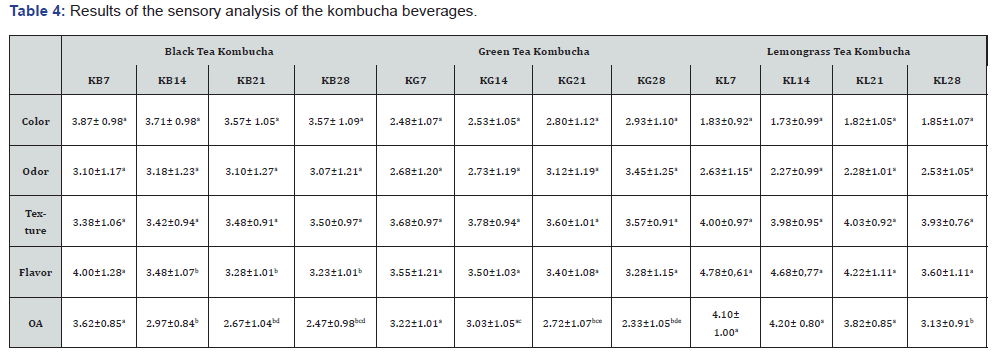
The values on each line for each kombucha tea with different superscript letters are significantly different (p < 0.05). KB: black tea kombucha; KG: gree tea kombucha KL: lemongrass kombucha; OA: Overall Acceptability; 7, 14, 21, 28: fermentation time
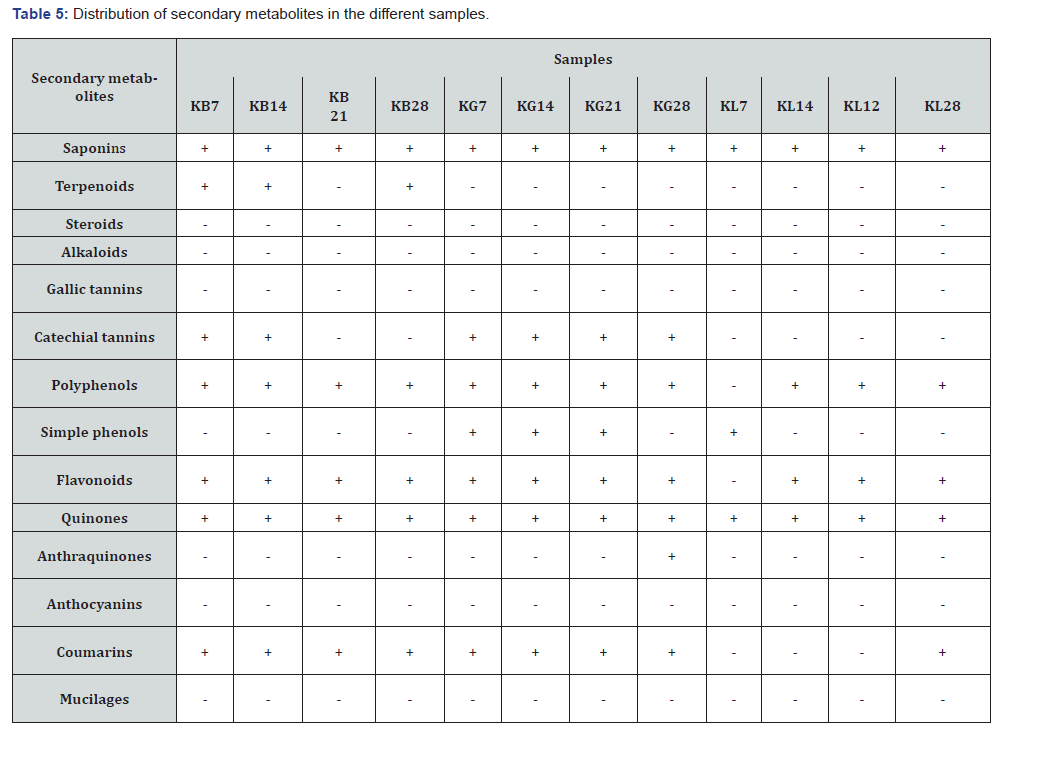
- : absent ; + : present; KB: Black tea kombucha, KG: Green tea kombucha, KL: Lemongrass kombucha day.
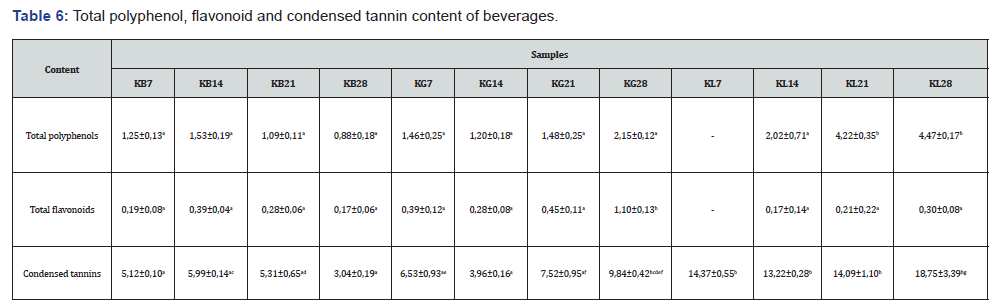
The values on each line with different letters as superscript are significantly different (p<0.0001); KB: Black tea kombucha; KG: Green tea kombucha; KL: Lemongrass kombucha; GA: General Acceptability. 7; 14; 21; 28 = fermentation days; mg EQ/g mb: milligram of quercetin equivalent per gram of crude material; mg GAE/g mb: milligram of gallic acid equivalent per gram of crude material; mg CEQ/g mb: milligram of catechin equivalent per gram of crude material.
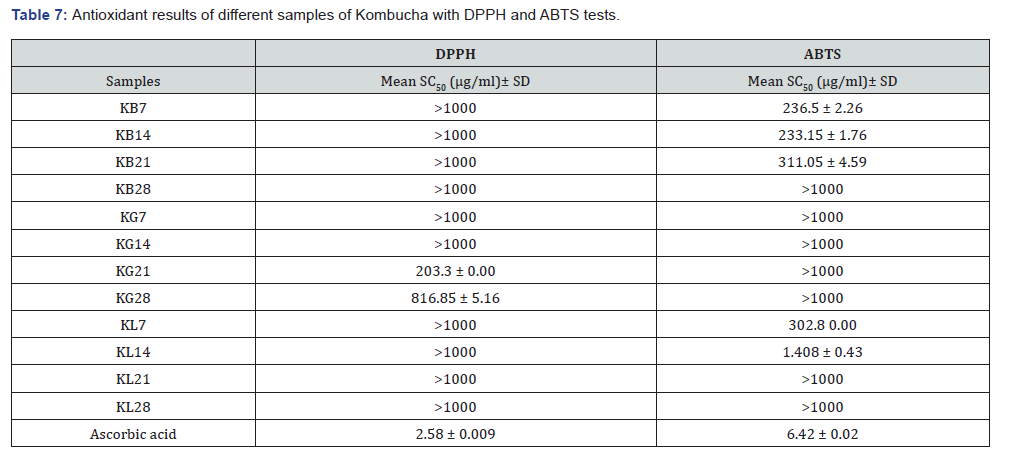
>1000 = Not active at the tested concentration; ND = Not Determined, KB: Black tea kombucha; KG: Green tea kombucha; KL: Lemongrass kombucha; GA: General Acceptability. 7; 14; 21; 28 = fermentation days.
The quantitative analysis of phytochemical compounds (Table 6) showed variations according to both the type of substrate and fermentation time. Total polyphenol contents ranged from 0.88 to 1.53 mg GAE/g for black tea kombucha, from 1.20 to 2.15 mg GAE/g for green tea kombucha, and from 2.02 to 4.47 mg GAE/g for lemongrass kombucha. In black tea kombucha, an increase was observed at day 14 followed by a decrease at days 21 and 28. In green tea and lemongrass kombucha, a decrease at day 14 was followed by a progressive increase at days 21 and 28. The highest polyphenol content (4.47 mg GAE/g) was recorded in lemongrass kombucha at 28 days of fermentation.
Total flavonoid contents varied between 0.17 and 0.39 mg QE/g in black tea kombucha, 0.28 to 1.10 mg QE/g in green tea kombucha, and 0.17 to 0.30 mg QE/g in lemongrass kombucha. Black tea kombucha showed an increase at day 14 followed by a decrease at later stages. In contrast, green tea kombucha exhibited a decrease at day 14 and an increase at days 21 and 28. A similar trend was observed for lemongrass kombucha. The highest flavonoid content (1.10 mg QE/g) was obtained in green tea kombucha at day 28. Condensed tannin contents ranged from 3.04 to 5.99 mg CE/g in black tea kombucha, 3.96 to 9.84 mg CE/g in green tea kombucha, and 13.22 to 18.75 mg CE/g in lemongrass kombucha. The highest value (18.75 mg CE/g) was recorded in lemongrass kombucha at 28 days of fermentation. Overall, the variations in condensed tannin content followed trends similar to those observed for total polyphenols and flavonoids across all samples.
Antioxidant activity of kombucha beverages
The antioxidant activity of the various kombucha formulations was evaluated using two complementary methods: DPPH and ABTS and the results are presented in Table 7 below.
Each assay targets a distinct mechanism of free radical neutralization. Antioxidant activity analysis via the DPPH assay revealed that among all samples, only KG21 and KG28 (green tea kombucha fermented for 21 and 28 days, respectively) exhibited SC50 values below 1,000 μg/mL. Specifically, KG21 showed a notable antioxidant activity with an SC50 of 203.3 μg/mL, while KG28 demonstrated moderate activity at 816.85 μg/mL. All black tea (KB) and lemongrass (KL) samples displayed SC50 values exceeding 1,000 μg/mL. The ABTS assay demonstrated variable antioxidant activity depending on the substrate and fermentation duration. Black tea samples KB7, KB14, and KB21 yielded SC50 values of 236.5 μg/mL, 233.15 μg/mL, and 311.05 μg/mL, respectively. Notably, the 14-day lemongrass kombucha (KL14) exhibited exceptionally high antioxidant activity with an SC50 of 1.408 μg/mL. All other samples, including the green tea (KG) variants, showed SC50 values > 1,000 μg/mL.
Discussion
The fermentation process yielded twelve distinct beverages (four per tea type). The absence of pathogens such as S. aureus, Salmonella spp., and Shigella spp. underscores the rigorous hygienic standards maintained during preparation and the high quality of the water utilized. This safety profile is further supported by chemical parameters such as pH, titratable acidity, and the presence of bioactive phenolic compounds [28]. Indeed, organic acids and phenols are recognized for their bactericidal efficacy against these specific strains [29,30]. This antimicrobial action likely accounts for the decrease in microbial load observed between days 7 and 14, leading to the total elimination of E coli by day 21, as these metabolites accumulate throughout the fermentation process.
The temporal increase in acidity is attributed to the continuous production of organic acids during fermentation, which subsequently drives down the pH [31]. These acids possess the ability to penetrate bacterial cell walls, disrupting intracellular activities [32]. This mechanism explains the absence of target pathogens in samples fermented for 21 and 28 days, where acid concentrations reached levels sufficient to inhibit pathogen survival. Interestingly, the higher acidity in black and green tea kombucha compared to lemongrass may be due to a higher concentration of undissociated acids in the latter. When an acid remains largely undissociated in its molecular form, it does not release H+ ions, thereby resulting in a higher measured pH despite the presence of the acid [33].
Regarding color, the polyphenols in black tea, specifically thearubigins and theaflavins are primarily responsible for the beverage’s hue [34]. The observed fading in intensity may result from the SCOBY consortium altering or depolymerizing these pigments [5]. Conversely, green tea infusions are naturally lighter as they do not undergo the oxidation required to produce dark pigments. Lemongrass kombucha maintained a relatively stable, characteristic light-brown tint regardless of fermentation time, aligning with findings by Juneja et al. [35] regarding C. citratus fermentations [35]. The decline in the aroma profile of black tea kombucha may be linked to the degradation of volatile compounds derived from the tea leaves [36]. In contrast, the intensifying odor in green tea kombucha likely stems from the microbial production of diverse aromatic compounds [37]. Generally, lemongrass kombucha exhibited a faint, stable aroma, consistent with the naturally mild olfactory profile of the plant [35]. The acidity of black tea kombucha is driven by the conversion of sugar to ethanol by yeasts, followed by its oxidation into acetic acid by bacteria [5]. The flavor decline in green tea samples may involve the microbial degradation of theanine, the amino acid responsible for its “umami” taste
From a sensory standpoint, the high general acceptability of lemongrass kombucha is attributed to its characteristic aroma [33]. This is consistent with Tchekessi et al. [33], who reported that lemongrass kombucha is more widely accepted than other traditional infusions. Notably, black and green tea kombuchas became unpalatable after 21 days, suggesting an optimal fermentation window of 14 days. Excessively low pH can degrade sensory quality to unacceptable levels [38]. The significant differences observed (p < 0.05) are likely dictated by the tea substrate and the specific metabolites generated during the progression of fermentation.
The phytochemical profile of the kombucha samples confirms the predominant presence of bioactive compounds such as polyphenols, flavonoids, saponins, and quinones, whose distribution varies with substrate and fermentation time. The absence of polyphenols and flavonoids in lemongrass kombucha at day 7, followed by their appearance from day 14, suggests microbial bioconversion processes enhancing the release and bioavailability of phenolic compounds during fermentation, as widely reported [6,39]. Quantitatively, the evolution of these compounds showed substrate-dependent kinetics, with overall increases at later fermentation stages, particularly in green tea and lemongrass kombucha, consistent with previous findings on fermentation-induced phenolic enrichment [10,40].
These variations are partially reflected in the antioxidant activity. The generally low activity observed with DPPH (SC50 > 1000 μg/mL for most samples) contrasts with the more pronounced responses in the ABTS assay, notably for black tea kombucha (KB7, KB14) and especially lemongrass kombucha at day 14 (KL14), which showed very high activity. This discrepancy is consistent with the higher sensitivity of ABTS to a broader range of antioxidant compounds [41]. The moderate activity observed in green tea kombucha (KG21, KG28) aligns with the increase in phenolic compounds at these stages, supporting the established role of polyphenols and flavonoids as key contributors to antioxidant capacity [42,43].
However, the lack of systematic correlation between high phenolic content (e.g., condensed tannins in lemongrass kombucha) and antioxidant activity suggests that not only concentration but also the structure and reactivity of compounds are determinant factors. Additionally, the decline in activity at prolonged fermentation times may reflect degradation or transformation of active molecules. Overall, these results highlight that the antioxidant potential of kombucha depends on both phytochemical composition and fermentation dynamics, in agreement with previous studies [6,10]. The results highlight significant variations in antioxidant activity based on substrate, fermentation time, and the specific assay used. The superior performance of KL14 in the ABTS assay (SC50=1.4 μg/mL) suggests that fermentation optimizes the bioavailability of the flavonoids and essential oils naturally present in Cymbopogon citratus [27,44]. Similarly, the success of KG21 in the DPPH assay with an SC₅₀ of 203.3 μg/mL aligns with literature regarding the heat-sensitive catechins in green tea. The fact that some samples were active in one assay (ABTS) but not the other (DPPH) reinforces the principle that these methods target different antioxidant fractions [26].
The DPPH assay revealed a specific antioxidant activity in green tea kombucha fermented for 21 days [10]. This indicates a strong capacity to scavenge lipophilic radicals. This result aligns with the chemical nature of green tea catechins, known for their efficacy in neutralizing DPPH- radicals via a hydrogen atom transfer mechanism. In contrast, the ABTS assay, which involves a hydrophilic radical, showed very high antioxidant activity in lemongrass kombucha fermented for 14 days (KC14), with an extremely low SC₅₀ of 1.408 μg/mL, as well as good activity in black tea kombucha extracts fermented for 7 and 14 days (KT7, KT14). This suggests that certain hydrophilic compounds specific to lemongrass and black tea, such as polar flavonoids and hydroxycinnamic acids, exhibit a marked affinity for ABTS- + radicals. Notably, green tea kombucha, despite its strong performance in the DPPH assay, displayed no activity in this test, highlighting antioxidant selectivity based on the radical’s nature [45,46]. The comparison of these two methods underscores the specificity of antioxidants in different kombucha formulations. While green tea appears to generate antioxidants effective in lipophilic environments, lemongrass provides potent antioxidant capacity in hydrophilic settings. This variability is likely linked to the structural and functional diversity of phenolic compounds present or formed during fermentation [44].
Overall, combining these assays revealed formulation-specific antioxidant profiles, emphasizing the differentiated nutritional value of kombuchas based on composition and fermentation duration. These findings advocate for a rationale selection of substrates and fermentation times tailored to desired functional outcomes.
Conclusion
This study demonstrates the combined impact of plant substrate and fermentation duration on the organoleptic and antioxidant properties of Cameroonian kombucha. Sensory quality is closely tied to the acid-sugar balance, with a clear preference for lemongrass kombucha fermented for 14 days. Functionally, green tea demonstrated superior lipophilic radical scavenging (DPPH), while lemongrass excelled in hydrophilic systems (ABTS). These findings suggest that kombucha’s functional potential relies on the synergy between specific metabolites and fermentation conditions rather than total polyphenol content alone. Consequently, strategic selection of substrates and fermentation times can be used to tailor kombucha production toward specific nutritional or therapeutic objectives.
Declaration of Competing Interest
The authors declare that they have no known competing financial interests or personal relationships that could have appeared to influence the work reported in this paper.
Author Contribution
Original draft preparation- preparation of Kombucha extractsreview and editing NGOUTANE MFOPA Alvine and BALEP NANA Fride Sandra; Sensory test, evaluation of antioxidant BALEP NANA Fride Sandra; Phytochemical characterization and Statistical analysis KEMZEU Raoul and Gilbert; Supervision FEKAM BOYOM Fabrice, TCHOKOUAHA YAMTHE Lauve and FOKOM Raymond. All authors have read and agreed to the published version of the manuscript.
References
- Sarac I, Onisan E, Beiușanu C, Teodorescu AG, Teodorescu OCD, et al. (2024) Formulation Method, Composition and Medical Applications of the Miraculously Drink-Kombucha: A Systemically Review. Pharmacophore 15(1-2024): 14-23.
- Vitas JS, MR, Lončar ES (2023) Kombucha health benefits: antioxidant, antimicrobial, digestive effects. Food Res Int. 172 112-120.
- Muscolo A, Mariateresa O, Giulio T, Mariateresa R (2024) Oxidative stress: the role of antioxidant phytochemicals in the prevention and treatment of diseases. International journal of molecular sciences 25(6): 3264.
- Tauchen J, Huml L, Jurášek M, Regenstein JM, Ozogul F (2025) Synthetic and semi-synthetic antioxidants in medicine and food industry: A review. Frontiers in Pharmacology 16: 1599816.
- Chakravorty S, Bhattacharya S, Chatzinotas A, Chakraborty W, Bhattacharya D (2016) Kombucha tea fermentation: Microbial and biochemical dynamics. International journal of food microbiology 220: 63-72.
- Jayabalan R, Malbaša RV, Lončar ES, Vitas JS, Sathishkumar M (2014) A review on kombucha tea-microbiology, composition, fermentation, beneficial effects, toxicity, and tea fungus. Comprehensive Reviews in Food Science and Food Safety 13(4): 538-550.
- Choudhury H, Pandey M, Hua CK, Mun CS, Jing JK, et al. (2018) An update on natural compounds in the remedy of diabetes mellitus: A systematic review. J tradi complement med 8(3): 361-376.
- Fokunang C, Ndikum V, Tabi O, Jiofack R, Ngameni B, et al. (2011) Traditional medicine: past, present and future research and development prospects and integration in the National Health System of Cameroon. Afr j Tradit complement Altern Med 8(3).
- Ndomou SCH, Djikeng FT, Teboukeu GB, Doungue HT, Foffe HAK, et al. (2021) Nutritional value, phytochemical content, and antioxidant activity of three phytobiotic plants from west Cameroon. Journal of Agriculture and Food Research 3: 100105.
- Villarreal Soto SA, Beaufort S, Bouajila J, Souchard JP, Taillandier P (2018) Understanding kombucha tea fermentation: a review. Journal of food science 83(3): 580-588.
- Da Silva Júnior JC, Mafaldo ÍM, de Lima Brito I, de Magalhães Cordeiro AMT (2022) Kombucha: Formulation, chemical composition, and therapeutic potentialities. Current Research in Food Science 5: 360-365.
- Bacteriological Analytical Manual (BAM) (2024) FDA, Silver Spring (MD): 8th US FDA.
- Chauhan A, Jindal T (2020) Microbiological methods for food analysis. In: Microbiological Methods for Environment, Food and Pharmaceutical Analysis, Springer, Germany pp.197-302.
- Shahbazi H, Hashemi Gahruie H, Golmakani MT, Eskandari MH, Movahedi M (2018) Effect of medicinal plant type and concentration on physicochemical, antioxidant, antimicrobial, and sensorial properties of kombucha. Food Sci Nutr. 6(8): 2568-2577.
- Harborne JB (1984) Phytochemical Methods. 2nd Edition, Springer, Netherlands pp.300.
- Kouadio KM, Oussou KR, Ahoua C, Kablan CA, Dongui BK, et al. (2021) Phytochemical screening, determination of total polyphenols and flavonoids, and evaluation of the antibacterial activity of leaves of Turraea heterophylla Smith (Meliaceae). International Journal of Innovation and Applied Studies 10(5): 405-413.
- Adzadogo RS, Gbewoyo WS (2018) Comparison of physicochemical properties and anti-microbial activities of tea and cocoa-based kombucha. Bioteknologi, 15(1): 33-37.
- Mujeeb F, Bajpai P, Pathak N (2014) Phytochemical evaluation, antimicrobial activity, and determination of bioactive components from leaves of Aegle marmelos. BioMed res Int 497606.
- Wagner, H. and Bladt, S (1996) Plant Drug Analysis: A Thin Layer Chromatography Atlas. 2nd Edn, Springer, Germany.
- Singleton VL, Orthofer R, Lamuela-Raventós RM (1999) Analysis of total phenols and other oxidation substrates and antioxidants by means of folin-ciocalteu reagent. In: Methods in Enzymology. Elsevier, Netherlands pp.152-178.
- Katoch R (2011) Methods for nutritional quality evaluation of food materials. In: Analytical techniques in biochemistry and molecular biology. Springer, Germany pp.251-322.
- Xiao F, Xu T, Lu B, Liu R (2020) Guidelines for antioxidant assays for food components. Food Frontiera 1(1): 60-69.
- Liu Y, Zhang H (2024) Development of an integrated colorimetric assay platform for simultaneous measurement of DPPH, ABTS and FRAP activities. Anal Chem 96(2): 234-1242.
- Zhang WLY, He S (2023) A comparative study of DPPH, ABTS, and FRAP methods for assessing antioxidant capacity of plant extracts. J Food Anal Methods 15(4): 450-462.
- Christodoulou MC, Orellana Palacios JC, Hesami, G, Jafarzadeh, S, Lorenzo, et al. (2022) Spectrophotometric methods for measurement of antioxidant activity in food and pharmaceuticals. Antioxidants 11(11): 2213.
- Munteanu IG, Apetrei C (2021) Analytical Methods Used in Determining Antioxidant Activity: A Review. Int J Mol Sci 22(7).
- Bayoï JR, Darman D, Etoa FX (2016) Technologie de fabrication, propriétés physico-chimiques et microbiologiques de la bière «kapsiki blanche» produite dans les monts Mandara au Nord-Cameroun. Afrique Sciences 12(6): 123-134.
- Bakari D, Hyacinthe T, Garga Y, Ronald BJ, Roger DD, et al (2023) Changes in Physicochemical, Phytochemical and Microbiological Parameters During Fermentation of “Kargasok” Tea. World Journal of Food Science and Technology 7(3): 67-76.
- Kassym L, Kussainova A, Semenova Y, McLoone P (2024) Antimicrobial effect of honey phenolic compounds against E. coli-An in vitro study. Pharmaceuticals 17(5): 560.
- Shin HJ, Kim H, Beuchat LR, Ryu JH (2020) Antimicrobial activities of organic acid vapors against Acidovorax citrulli, Salmonella enterica, Escherichia coli O157: H7, and Listeria monocytogenes on Cucurbitaceae seeds. Food microbiology 92: 103569.
- Bishop P, Pitts E, Budner D, Thompson-Witrick K (2022) Chemical Composition of Kombucha. Beverages 8: 45. In: s Note: MDPI stays neutral with regard to jurisdictional claims in published.
- Pangprasit N, Srithanasuwan A, Suriyasathaporn W, Pikulkaew S, Bernard JK (2020) Antibacterial activities of acetic acid against major and minor pathogens isolated from mastitis in dairy cows. Pathogens 9(11): 961.
- Tchekessi CK, Yaya K, Yete P, Kougblenou K, Gandeho GJ, Pivot S, et al. (2023) Microbiological, physicochemical and nutritional assessment quality of three types of kombucha drinks produced from local herbs and Lipton tea in Benin. Am J Food Nutr 11(2): 46-54.
- Tran T, Grandvalet C, Verdier F, Martin A, Alexandre H, et al. (2020) Microbiological and technological parameters impacting the chemical composition and sensory quality of kombucha. Comprehensive Reviews in Food Science and Food Safety 19(4): 2050-2070.
- Juneja PDM, Ray RR (2023) Bacterial nanocellulose production and characterization from kombucha fermented using Cymbopogon citratus tea. BioResour 18(2): 4312-4325.
- Bishop P, Pitts ER, Budner D, Thompson-Witrick KA (2022) Kombucha: Biochemical and microbiological impacts on the chemical and flavor profile. Food Chemistry Advances 1: 100025.
- Suffys S, Richard G, Burgeon C, Werrie PY, Haubruge E, et al. (2023) Characterization of aroma active compound production during kombucha fermentation: Towards the control of sensory profiles. Foods 12(8): 1657.
- Neffe-Skocińska K, Sionek B, Scibisz I, Kołożyn-Krajewska D (2017) Acid contents and the effect of fermentation condition of Kombucha tea beverages on physicochemical, microbiological and sensory properties. Cyta-journal of food 15(4): 601-607.
- Hur SJ, Lee SY, Kim YC, Choi I, Kim GB (2014) Effect of fermentation on the antioxidant activity in plant-based foods. Food Chemistry 160: 346-356.
- Yang J (2023) Impact of fermentation on phenolic compounds and antioxidant capacity of plant-based beverages. Food Bioscience 53: 102678.
- Re R, Pellegrini N, Proteggente A, Pannala A, Yang M, Rice-Evans C (1999) Antioxidant activity applying an improved ABTS radical cation decolorization assay. Free Radical Biology and Medicine 26(9-10): 1231-1237.
- Prior RL, Wu X, Schaich K (2005) Standardized methods for the determination of antioxidant capacity and phenolics in foods and dietary supplements. Journal of Agricultural and Food Chemistry 53(10): 4290-4302.
- Shahidi F, Ambigaipalan P (2015) Phenolics and polyphenolics in foods, beverages and spices: Antioxidant activity and health effects. Journal of Functional Foods 18: 820-897.
- Don SM, Rambli M, Nore BF (2024) Antioxidant content following fermentation of lemongrass for herbal beverage development. J Food Sci Technol 61(12): 1-14.
- Al Juhaimi FY (2021) Effect of fermentation time on total phenolic compounds and antioxidant activity of fermented lemon grass (Cymbopogon citratus) extract. J Food Process Preserv 45(5): e15424
- Liza MS RR, Mandal A, Islam MN (2020) Antioxidant activity of lemongrass (Cymbopogon citratus) extract: In vitro and in vivo studies. J Food Qual 9763964.
- Adams MR, MP Moss MO (2024) Food Microbiology. Royal Society of Chemistry, 5th Edn 197-302.
- Latimer Jr (2023) Official Methods of Analysis of AOAC International. 22nd Edition, AOAC International.

























