


Effects of Ecotourism on Land Use Land Cover Dynamics: A Study from Shivapuri Watershed
Mamta Lama, Ram Asheshwar Mandal* and Prashid Kandel
Kathmandu Forestry College, Nepal
Submission: January 19, 2019, Published: January 30, 2019
*Corresponding author: Ram Asheshwar Mandal, Kathmandu Forestry College, Nepal
How to cite this article: Mamta L, Ram A M, Prashid K. Effects of Ecotourism on Land Use Land Cover Dynamics: A Study from Shivapuri Watershed. Agri Res& Tech: Open Access J. 2019; 19(5): 556105. DOI: 10.19080/ARTOAJ.2019.19.556105
Abstract
The ecotourism activities have been affecting the land cover and land use of the Shivpuri watershed, but assessment was not done before to show the dynamics. Thus, this study was objectively done to assess status and Land Use and Land Cover Change between 1999 and 2016, identify to status of ecotourism, major ecotourism sites and activities and trend of tourists in Shivapuri watershed. The Landsat ETM+ satellite image of November 1999 and OLI 2016 were downloaded from USGS website. Shivapur watershed site was clipped using ERDAS. Next, the image was classified using supervised maximum likelihood algorithm to produce the thematic map. In addition, altogether 216 and 233 training samples collected from the field observation and were used for accuracy assessment of classified maps of 1999 and 2016 respectively. The result showed that thematic map of 1999 and 2016. The map of 1999 showed that the main land cover was forest cover around 2514 ha followed by Agriculture land 355 ha. Similarly, classified map of 2016 showed that forest cover was 2404 ha. The difference in land use land cover was -110, -106, 198 and 18 ha in forest cover, agriculture, degraded forest and settlement respectively. The identified ecotourism activities were Jungle drive, trekking, hiking, bicycling, videography, wildlife viewing and bird watching. The effects of ecotourism on land use land cover dynamics were more towards the northeast part of the watershed. There were only10850 visitors (7450 Nepali and 3400 foreigners) in 1994/1995 which reached 209717 (193178 Nepali and 16539 foreigners) in 2016/2017. This research will be useful to assess the dynamics of land cover and land use and their real reason.
Keywords: Land use; Land cover; Eco-tourism; Supervised
Abbrevations: LULC: Land Use and Land Cover; USGS: United State Geological Survey; RGB: Red Green Blue
Introduction
Social activities are stimulating land use and land cover to change. Specifically, the consequences are changing in biodiversity, water and earth radiation and ultimately climate and biosphere [1]. The maps of different periods provide continuous land cover changes [2,3]. The tourism industry and activities play a major role in changing the surroundings [4,5]. It is one of the major driving forces behind land use and landscape changes in the coastal, mountain areas [6]. Even well-intentioned ecotourists might modify habitats and disturb the habit, feeding and breeding patterns of wildlife and transmit diseases [7].
When adopting ecotourism as a conservation practice, there arises tight linkage between the influence of economics, uncertainty and confidence in proposed land-use changes [8]. Integrated ecotourism development program has the highest values in comparison to other land use programs [9,10]. Some environmentalists believe that the tourism industry, to some extent, leads to unsustainability [11,12] because it creates the stressful environment. On the other hand, ecotourism is a very good income source for local people [13-15]. These days, eco and nature tourism are growing three times faster globally than the tourism industry as a whole [10]. This might be due to rapid businesses like ecolodges, ecotour operators, and suppliers of transport services and infrastructures within a given ecotourism destination and hotel chains, airline and cruise ship operations, and retail travel agents represents non-specialized businesses, ranging from small- and medium-sized enterprises to transnational corporations [13,16].
The need for monitoring of land use and land cover (LULC) dynamics is significantly important to deal under the environmental service and ecotourism [17]. The monitoring activities include the spatial and temporal distribution of land use land cover [18]. For instance, it is essential to quantify the change to ensure that appropriate management policies and ecosystem services provided by forests [19,20]. Moreover, the analyzing the process of land use pattern changes helps to predict the changes and prepare the best local development policies [21]. Such study is importantly rational in Nepal particularly in case of promising ecotourism site like Shivapuri watershed where thousands of visitors come.
Thus, this study was objectively carried out to assess the status of land use land cover dynamics during 1999 and 2016 in Shivapuri watershed, to assess the status of ecotourism in Shivapuri waAbstract tershed and their effects on land use land cover dynamics and to find how People’s perceive about status of ecotourism and their effects.
Methodology
Study site
This study was conducted in Shivapuri watershed of Shivapuri Nagarjun National Park located between 27°45’N to 27°48’N latitude and 85°23’E to 85°28’E longitude (Figure 1). The study area covers 3070 ha. The altitude of the study area ranges between 1398-2692m above the mean sea level. The watershed primarily covers Sundarijal village and is located at the northeast corner of Kathmandu city [22]. Subtropical to temperate vegetation specifically, Pinusroxburghii, Schimawalichii, Castanopsisindica, Alnusnepalensis, Quercussemi carpifolia etc. [22] were found here.

Download of image
Two periodic remotely sensed Landsat 7 ETM+satellites and Landsat 8 OLI/TIRS images with path 141 and row 41 particularly of 1999 and 2016 have been used to prepare land use land cover maps of the study area. Digital Image data files were downloaded in zipped files from the United State Geological Survey (USGS). The cloud and noise-free images were used for the research work.
Classification and accuracy assessment
Details about the images are included in the Table 1. Topographical map (Scale 1:25000) of the study area published by Government of Nepal, Department of Survey was digitized by manual digitization. This map was used for ground truth information for image classification and accuracy assessment of 1999. Also, this was used as a base map for the comparison of the major changes on ecotourism sites from 1999 till 2016. Direct observation was done along the study area to observe the eco visits to major ecotourism sites and major activities. Also, degraded forest was properly observed. Major forest types, agricultural crops and hotels and services were observed carefully. Training samples were collected with GPS during the field visit. These were used for image classification and accuracy assessment of 2016 image.

The repetitive satellite remote sensing over various spatial and temporal scales has been one of the cost-effective means to generate information about forest cover, vegetation type and land use changes [23-25]. The TIFF format of satellite images were exported to image format in ERDAS Imagine® 2015 software using layer stack function. In order to interpret and discriminate the surface features clearly, all satellite images were composed using Red Green Blue (RGB) colour composition. Both satellite images were sub-mapped (subset) for covering only the study area (Shivapuri Watershed). Then, the training samples corresponding to different land use classes collected from field visit were used to classify the image of 2016. Four land use land cover classes were used.
a. Forest.
b. Agriculture.
c. Degraded Forest.
d. Settlement.
These images were processed for evaluating land use and land cover change. In the meantime, images were classified using supervised classification approach applying the maximum likelihood algorithm. Reasonable choices of training samples, an appropriate projection of UTM/WGS 84, zone 45 N and appropriate symbologies were made for the classification.
The changes were related in response to ecotourism purpose. User’s accuracy, Producer’s accuracy as well as overall Kappa accuracy were calculated using the 216 and 233 training sample points for classified images of 1999 and 2016 respectively. For this, the confusion table was used [26].
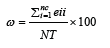
Where;
ωω = Overall accuracy in percentage
nc= Total number of classes
eiieii = Element in ith row and ith column
NT= Total number of samples
eijeij = Element in ith row and jth column
KII and questionnaire survey
Meanwhile, KII was conducted with village leaders, individuals who have been living in the area for a long time, Assistant Conservation Officers of SNNP, Chairperson of Council, and Head of Sundarijal Sector (SNNP). They were questioned about the role of ecotourism in SNNP, major ecotourism sites, visitors’ nature regarding environmental awareness, effects of ecotourism on land use, level of integration between people and park authorities, the participation of people in conservation, ongoing outreach programs and their commitment. There were four villages in the study area namely Okhreni, Chilaune, Mulkharka and Mahankal. Total 98 households were selected for the purpose of the questionnaire survey. Simple random sampling with 20% sampling intensity was applied for the household.
Results
The land use maps for 1999 and 2016 are presented in Figure 2 and 3 respectively and the area under the four land use classes during the study period is shown in Table 1. As the post classification of Landsat image of 1999 shows that the main land cover is of forest covering 2514ha after Agriculture land occupying 355ha of the total 3070ha land area. Similarly, settlement area occupied 31ha and degraded forest occupied 170ha. Similarly, the classified image of 2016 still shows the main land cover as forest covering 2404ha of the total land cover after degraded forest which occupies 368ha with minimum land coverage by a settlement of 49ha after agriculture of 249ha area. Forested land shrunk by 110ha and agricultural land shrunk by 106ha between 1999 and 2016 whereas degraded forest increased by 198ha and settlement area increased by a small amount of 18ha (Table 1 & Figure 2 and 3).
The overall accuracy was 0.84 in case of the classified map of the image of 1999 and 0.87 for the map of 2016. The Kappa coefficient showed 0.82 and 0.85 for the classified map of the image of 1999 and 2016 respectively (Table 2).

Source: Field observation.

Results show that degraded forest and settlement area increased while agriculture and forest area decreased during the study period. Specifically, about 7.02% forest (176.13ha) was converted into agriculture, degraded forest and settlement. Meanwhile, the 57.06 ha degraded forest has also changed into the forest and other areas (Table 3 and Figure 4).


Cultural trails and roads, viewpoints, waterfall, Shiva temple and Deurali Bhanjyang Monastery are the major attractive ecotourism sites for domestic and international tourists (Figure 5 and Table 4). These activities have an obvious effect on ecotourism.

Source: Field observation.
The park has started provision for compulsory nature guide for ecotourists since fiscal year 2015/16 in order to provide maximum information regarding the park, wildlife and plants species, making the park visit more managed and secure and providing employment opportunities for young people.
The ecotourism activities are successful to allure the local and foreigner to visit Shivapuri watershed. In the beginning, there were only 10850 visitors (7450 Nepali and 3400 foreigners) in 1994/1995 which reached 209717 (193178 Nepali and 16539 foreigners) in 2016/2017. This was around 387% between this period (Figure 5).
Discussion
The forest is predominated cover in the study area (Table 1) which is supported by the data of Shivapur National Park. “The land use pattern in and around SNNP is predominated by forest followed by shrubland, cultivated land and respectively. The cover of forest land is 117.57km2 (73.94%), followed bush/shrub land- 32.02km2 (20.14%), and grassland 0.70km2 (0.44%). The other minor land use types accounting for 0.8km2 out of 159km2 total land area represented by grassland- 0.70km2 (0.44%), barren land- 0.06km2 (0.04%), pond or lakes- 0.01km2 (0.01%) and river, streams and cliffs 0.03km2 (0.02%)”
The map for dynamics of land use land cover of 1999 and 2016 is presented in Figure 6. Maximum of forest area has been degraded due to the cutting of trees for infrastructural development and illegal felling of trees. The forest degradation is supported by authors [27] who advocated the observed land use changes into Sundarijal catchment of 1990 and 2010 suggests an overall decline in forest land by 6.71km2 (0.91%) but this was not supported by authors [28]. The latter research was not supportive which might be because it did not separate the forest from the degraded forest or subdivided forest cover as;
a. Forest.
b. Degraded forest.
If degraded forest in this research would not have been considered, there would have been an increase in forest cover and would resonate with the result of authors [28].
Agricultural land raised by 25.5km2 (0.72%) during 1990- 2010 in Sundarijal catchment [27]. But, according to the result, agricultural land decreased by 3.6% and maximum change was seen in agricultural land use towards degraded forest (Table 1). Maximum of agriculture has been abandoned (Figure 6, Table 3) due to less productivity of agricultural land and occupational shifts of villagers. Most of the villagers either migrated towards the city or choose any other profession for livelihood in recent years. So, a number of trees grew in agricultural land resulting in the degraded forest.
The report showing the increasing trend of foreign visitors in SNNP (Figure 5) is also supported by 14 authors who advocates travel to developing countries has been increasing. Over one-third of the modern-day tourist who now holiday abroad do so in the developing world because it offers a cheaper alternative to domestic holidays or holidays in other developed countries and the majority of tourists from developing nations wanting to escape northern hemisphere winter are attracted towards the climate of developing nations. However, there is a decline in foreign visitors in Fiscal year 2014/15 and 2015/16 which might be due to the 2015 earthquake in Nepal that threatened the visitors in terms of life security. But then in 2016/17, foreign visitors are slightly increasing (Figure 5). Similarly, the trend of national visitors visiting Shivapuri is increasing rapidly which might be due to the increasing pollution in the city area and their realization for the importance of nature and biodiversity in recent years.
The ecotourism led-development of the road system from Mahankal to Dhap along the Nagmatiriver can be highly correlated with forest cover change to the degraded forest (Figure 5, Figure 6). The observed increment in degraded forest in this route could also be explained by the reasons: first, visitors led forest fire along Nagmati river destroyed around 8ha Shorea robusta forest [22], second, the findings of the study conducted by authors [28] suggest a higher rate of forest loss in areas closer to the roads, in comparison with the more remote areas.
Simultaneously, improvement in forest cover from degraded forest is also seen mostly towards the southern part of the watershed which might be due to those areas proximity to Nepal Army monitoring and ecotourism development interventions and awareness in recent years which is supported by authors [28] who advocated a higher amount of forest gain and improvement in an area of better accessibility. But, none of the settlement areas changed into forest area because the settlement area is totally enclosed by agricultural land use.
The effectiveness of tourism activities has been influencing the land cover and land use. The natural resources have been changed due to modernization. These changes can be clearly monitored applying the analysis of different period of images. The results are the evidence of effects of ecotourism led development on land use and land cover.

Conclusions and Recommendation
There was an improvement in forest cover towards the southwest and south-east part and forest cover degradation towards northern and north-east part were recorded. Positive changes in forest cover towards the south-west and south-east part of the watershed signify, to some extent, the success of proper ecotourism efforts of management authorities.
The main ecotourism activities were Jungle drive, trekking, hiking, bicycling, videography, wildlife viewing and bird watching. The finding will be a useful tool for the scientific community and policymakers to develop the plan and decision support system. Some effective policies are needed for mutual benefits to ecotourism to address the increasing number of tourists.
Acknowledgement
We acknowledge the park authority and local people who supported to complete this research work. Specifically, we acknowledge warden Mr Kamal Jung Kunwar and Principal Dr Ambika Prasad Gautam and our friends DiptyPoudel and Manoj Panta.
References
- Butt A, Shabbir R, Ahmad SS, Aziz N (2015) Land use change mapping and analysis using remote sensing and GIS: a case study of simly watershed, Islamabad, Pakistan. Egyptian Journal of Remote Sensing and Space Science 18(2): 251-259.
- Li W, MacBean N, Ciais P, Defourny P, Lamarche C, et al. (2018) Gross and net land cover changes in the main plant functional types derived from the annual ESA CCI land cover maps (1992-2015). Earth Syst. Sci. Data 10(1): 219-234.
- Parsa VA, Yavari A, Nejadi A (2016) Spatio-temporal analysis of land use/land cover pattern changes in Arasbaran Biosphere Reserve: Iran. Modeling Earth Systems and Environment 2(4): 1-13.
- Knaap WG (1999) Research report: GIS oriented analysis of tourist time space patterns to support sustainable tourism development. Tourism Geographies: An International Journal of Tourism Space, Place and Environment 1(10): 56-69.
- Mao X, Meng J, QiWang (2014) Modeling the effects of tourism and land regulation on land-use change in tourist regions: A case study of the Lijiang River Basin in Guilin, China. Land Use Policy 41: 368-377.
- Nepal S, Chipeniuk R (2005) Mountain Tourism: Toward a Conceptual Framework. Tourism Geographies 7(3): 313-333.
- Hill J, Gale T (2016) Ecotourism and Environmental Sustainability: Principles and Practice, UK.
- Moskwa E (2010) Ecotourism in the rangelands: landholder perspectives on conservation. Journal of Ecotourism 9(3): 175-186.
- WTO (2004) Indicators of Sustainable Development for Tourism Destinations: A Guidebook, Madrid, Spain, pp. 516.
- Lee CH, Wang CH (2017) Estimating Residents’ Preferences of the Land Use Program Surrounding Forest Park, Taiwan. Sustainability 9(4): 1-19.
- Boley BB, Green GT (2015) Ecotourism and natural resource conservation: the ‘potential’ for a sustainable symbiotic relationship. Journal of Ecotourism 15(1): 36-50.
- Mohd ZH, Ujang U (2016) Integrating Multiple Criteria Evaluation and Gis in Ecotourism: A Review. The International Archives of the Photogrammetry, Remote Sensing and Spatial Information Sciences. Volume XLII-4/W1: 351354.
- Wearing S, Neil J (2014) Ecotourism (Impacts, Potentials and Possibilities). New York, USA.
- TIES (2009) TIES Announces Ecotourism Principles Revision.
- Zambrano AMA, Broadbent EN, Durham WH (2010) Social and environmental effects of ecotourism in the Osa Peninsula of Costa Rica: the Lapa Rios case. Journal of Ecotourism 9(1): 62-83.
- Paudel B, Zhang YL, Li SC, Liu LS, Wu X, et al. (2016) Review of studies on land use and land cover change in Nepal. Journal of Mountain Science 13(4): 643-660.
- Mas J-F, et al. (2017) Land use/land cover change detection combining automatic processing and visual interpretation. European Journal of Remote Sensing 50(1): 626-635.
- Fernando SLJ, Shariff NM (2015) The Relationship Between Land Use/ Land Cover Change and Factors for Ecotourism Development in the Partial Nature based Wetland using Remote Sensing and GIS Techniques. International Journal of Scientific Research and Innovative Technology 2(1): 82-93.
- Atik M, Altan T, Artar M (2010) Land Use Changes in Relation to Coastal Tourism Developments in Turkish Mediterranean. Pol. J Environ Stud 19(1): 21-33.
- Coulston JW, Reams GA, Wear DN, Brewer CK (2014) An analysis of forest land use, forest land cover and change at policy-relevant scales. Forestry: An International Journal of Forest Research 87(2): 267-276.
- Mendis W, Wadigamangawa A (2009) Integration of Remote Sensing and GIS for Land Use/Land Cover Mapping in Nil Wala Basin. GEOSPATIAL WORLD.
- SNNP (2016) Local Governance and Community Development Programme- II (Annual progress Report, Fiscal Year 2072/73), Kathmandu, Nepal, p. 86.
- Mitchell A (1999) The ESRI Guide to GIS Analysis Volume 1: Geographic patterns and Relationships. Environmental Systems Research Institute, Inc., New York, USA.
- Farooq M, Rashid H (2010) Spatio-Temporal Change Analysis of Forest Density in Doodhganga Forest Range, Jammu & Kashmir. International Journal of Geomatics and Geosciences 1(2): 132-140.
- Mohamed MA (2017) Monitoring of Temporal and Spatial Changes of Land Use and Land Cover in Metropolitan Regions through Remote Sensing and GIS. Natural Resources 8: 353-369.
- Bhatta B (2011) Remote Sensing and GIS: Second Edition. Oxford University Press, USA, pp. 752.
- Shrestha S, Joshi L, Dangol M (2013) Assessment of Land Use Change in Shivapuri Nagarjun National Park: The Case of Sundarijal. Ecoprint: An International Journal of Ecology 20: 53-59.
- Gautam AP, Shivakoti GP, Webb EL (2004) Forest Cover Change, Physiography, Local Economy, and Institutions in A Mountain Watershed in Nepal. Environ Manage 33(1): 48-61.


