


Evaluating Technical Standards of Implemented Soil and Water Conservation Technologies in Jimma Zone, South-Western Ethiopia
Gizaw Tesfaye1*, Kalkidan Fikirie2, Yalemtsehay Debebe1 and Leta Hailu1
1 Jimma Agricultural Research Center, Ethiopia
2Melkassa Agricultural Research Center, Ethiopia
Submission: December 21, 2018, Published: January 25, 2019
*Corresponding author: Gizaw Tesfaye, Jimma Agricultural Research Center, P. O. box 192, Jimma, Ethiopia.
How to cite this article: Gizaw T, Kalkidan F, Yalemtsehay D, Leta H. Evaluating Technical Standards of Implemented Soil and Water Conservation Technologies in Jimma Zone, South-Western Ethiopia. Agri Res& Tech: Open Access J. 2019; 19(4): 556100. DOI: 10.19080/ARTOAJ.2019.19.556100
Abstract
The problems of land degradation is increasing throughout the world due to the generalized use of empirical approaches to select and apply soil and water conservation (SWC) practices. The design of SWC structures considers the extent of erosion, cause of erosion and suitability of land. The study was carried out in three selected districts (Sekoru, Gomma, and Manna) of the Jimma Zone, South Western Ethiopia, with the objective of evaluating technical standards of implemented soil and water conservation technologies. A total of 270 household heads were selected for the study using, 90 households from each district. Data were collected through a semi-structured questionnaire; focus group discussion and measurements of implemented structures. In addition, secondary data were used and analyzed with the help of SPSS version 16 and rational formulas for SWC design. The result of this study revealed SWC embankment and channel dimensions implemented didn’t follow the standards given. These dimensions were found less than the standard given while greater than the standard in some areas. Percentage of area lost per hectare due to the structure also depends on the structure dimensions. Live fence, bund stabilization grasses and shrubs were common biological measures in the area. Sekoru and Mana districts perform well by structural maintenance than Gomma district. Lack of training, extension service, lack of farm tools and skilled manpower are the major problems during SCW structures implementation. Therefore, the study suggests training and continuous follow up during and after implementation should be given by government and non-governmental organization.
Keywords: Soil erosion; Soil and water conservation; Technical standard
Abbrevations: SWC: Soil and Water Conservation; PAs: Peasant Associations; KIs: Key Informants; TLU: Tropical Livestock Unit; NGOs: Non-Governmental Organizations; FGD: Focus Group Discussion; Tc: Time of Concentration
Introduction
The problem of soil and water degradation and derived effects are increasing throughout the world., this is due to a lack of appropriate identification and evaluation of the degradation processes and of the relations cause-effects of soil degradation for each specific situation and the generalized use of empirical approaches to select and apply soil and water conservation (SWC) practices. Sometimes, wrong selection and implementation of soil and water conservation practices and structures may increase land degradation processes and derived environmental impacts [1].
Soil and water conservation technologies are activities that maintain or enhance the productive capacity of land in areas affected by or prone to soil erosion. It includes the prevention, reduction and control of soil erosion alongside proper management of the land and water resources. Effective erosion management includes reduction of the amounts and velocity of surface runoff, maintaining good soil cover through mulching and canopy cover, conservation and retention of soil moisture, Prevention or mini mizing the effects of raindrop impact on the soil, maintaining favorable soil structure for reducing crusting, re-shaping the slope to reduce its steepness and slope length so as to minimize runoff flows, maintenance or improvement of soil fertility, and removal of unwanted excessive runoff safely [2].
There are a number of technical mistakes committed by experts and farmers in almost all kinds of soil and water conservation measures. These problems become worse when it comes to drainage control structures such as graded bunds, cutoff drain and waterways. Since the design and dimensions of these structures are very much dependent on runoff rate to be generated from a particular area/watershed [3]. Proper design of SWC structures is important for their effectiveness in protecting the soil from raindrop impact and hydraulic forces of runoff. The design of SWC structures considers severity and extent of erosion damage or risks, the factors causing erosion, as well as the suitability of land to the identified intervention. Planning and implementing land use properly lead to fewer degradation problems, achieving both short-term and long-term benefits [4]. Soil and water conservation are the most important part of land-use planning and must be inserted into the whole context of land-use planning for land development. Soil and water conservation programs must be seen as the development and application of land use systems that preserve or enhance soil productivity.
In high rainfall areas a common objective of implementing soil and water conservation structures is to lead unavoidable surface run-off safely off the land using drains and ditches. In semi-arid regions the objective is more likely to be to slow down the run-off to non- scouring velocities and to encourage infiltration or deposition of silt, without diverting the run-off. There are always strong links between measures for soil conservation and measures for water conservation. Many measures are directed primarily to one or the other, but most contain an element of both. Reduction of surface run-off by structures or by changes in land management will also help to reduce erosion. Similarly, reducing erosion will usually involve preventing splash erosion, or formation of crusts, or breakdown of structure, all of which will increase infiltration, and so help the water conservation.
The Ethiopian government has been made a lot of efforts to overcome the problem of Continuous land degradation resulted in a loss of fertile topsoil leading to low agricultural productivity and soil erosion. Soil conservation in Ethiopia is considered today to be of top priority, not only to maintain and improve agricultural production but also to achieve food self-sufficiency, which is the long-term objective of the agricultural development programme. Therefore, a massive effort is being made in soil conservation by the Ministry of Agriculture. The Community of Forests and Soil Conservation Development Department has already implemented soil conservation measures on over more than 1 million hectares in the last ten years in the country [5].
However, mass mobilization approaches lead to the implementation of soil and water conservation structures with inappropriate design, and consequently, soil conservation activities have had a lesser impact than expected and resulted with gully formation in many parts of the country. Such a problem may be due to a technical gap and lack of trained manpower. The technical gap causes failure of implemented SWC technologies which in turn causes serious land degradation. In the study area also, the failure of implemented structures was observed and reported repeatedly in most parts of the country that could be due to wrong SWC structures design specification. Because of this, the study was aimed to assess and evaluate technical standards of implemented SWC structures using Community-Based Participatory Watershed Development guideline prepared by Desta, et al. [6] and empirical equations given for soil and water conservation structures specification design.
Materials and Methods
Description of the study Area
The study was undertaken in three selected districts namely Sekoru, Gomma and Manna of Jimma Zones (Figure 1). Jimma Zone is located 350km away from Addis Ababa the Capital City of Ethiopia. It is geographically located between 360 50’ E longitudes and 7040’ N latitude and the altitude of the zone ranges from 880 to 3340m.a.s.l [7].

Site, Key Informants, Sample Size and Household (HH) Selection
The study was carried out in Jimma zone, comprised 18 districts. Of these, ten districts were classified under lowlands agro-climatic zone, while the remaining 8 districts in the highland agro-climatic zone [8]. Most of the soil and water conservation technologies implemented in lowland agro-climatic zone. Therefore, attention was given to the lowland districts of the zone and samples were also selected from those. To select representative districts, the first consultation was held with the zonal council members (administrators) and then three districts were selected purposively by considering the agro-climatic zone of the district. Then after, three peasant associations (PAs) selected from each sample districts purposively again based on the agro-climatic condition of the PAs.
In this study, key informants (KIs) are referred as the elder or a knowledgeable person who has deeper knowledge on local issues like on environmental degradation, soil and water conservation technologies and livelihood systems and lived in the area for long period of time. Thus, the selections of key-informants were done with the help of the PA administrators. Therefore, five individuals were reasonably picked from each selected PAs. In general, 45 KIs were selected from 9 sample PAs. The number of respondent’s sample size was determined using the formula developed by Israel. A formula used for sample size determination:
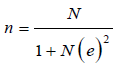
Where: n= number of sample size; N= is population size; e= is the level of precision (5%, 7% and 10%), but 8% precision level was used for this study). Accordingly, the sample size required (n) in the study was about, 267HHs from the population but a total of 270 households (HH) were used. Because of a homogeneous type of HH population in terms of their livelihood and conservation technologies implementation, households were selected randomly. As a result, 90 households selected from each sample districts (Table 1).

Data Source and Collection
The study was carried out through both quantitative and qualitative research methods. The data was obtained from primary and secondary sources. The main primary sources of data were KIs Interview, FGD, and household survey. Secondary data were from published and unpublished data sources.
Key Informants Interview and focus group discussion (FGD)
KIs were individually interviewed on the perception of soil and water conservation technologies, soil erosion, land degradation and natural resource conservation practices. The interview was based on open-ended questionnaires. FGD, where a group of people having similar concern and experience regarding a subject is encouraged to participate in a facilitated discussion, was conducted. Therefore, one FGD was carried out in each sample PA with the selected KIs. It was undertaken to have clarity in the area of ambiguity and to gather detailed information in the areas of perception of soil and water conservation technologies, climate-related events and land management practices. A total of nine discussions were held in the nine sample PAs.
Formal Household (HH) Survey
The formal HH survey was undertaken with HHs selected randomly from the list of HHs to get information on the areas of livelihood activities, demographic and socio-economic characteristics, SWC technologies perception, impacts, natural resource conservation and vulnerability reduction practices. In the process of formal HH survey, four stages were involved: preparation of questionnaires, recruitment, and training of field-assistants, pre-testing questionnaire and feedback, and finally the administration of actual fieldwork. The survey was undertaken based on open and close-ended questions.
Measurement of Soil and Water Conservation Structures
Dimensions of implemented soil and conservation structures were measured from a 9 kebeles of three selected woredas of Jima Zone. During this measurement slope of the land (by clinometer), type of implemented structure, embankment and channel dimensions were seriously measured. Using these collected basic data and corrected structures dimensions were calculated and designed to be compared with the implemented one. During the design of these structures peak discharge that will be generated, vertical interval, spacing, gradient and structure dimensions were calculated for structures implemented in the selected areas.
Vertical Interval
Is the spacing between two consecutive graded bunds in meter (it is the difference in height or elevation between two points on a slope). Ramser’s Formula was used:
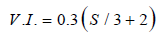
Where: V. I. = Vertical interval between consecutive bunds and S = Land slope (%).
Horizontal spacing: Is the horizontal ground distance or cultivable strip in meter between the successive bunds and calculated using the following formula:
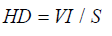
Where: HD=Horizontal distance of the bund (m); VI = Vertical Interval (m) and S = Slope (%)
Channel gradient: The gradient of graded bunds varies with the soil type of an area. Accordingly, for erodible soils (silt and fine sandy soil) grade of 0.25%, for moderately erodible soil (loam) 0.5%, for less erodible soil (clay soil and gravel) 1% and for gravel and stones a gradient >1% was used for this study.
Peak discharge: Rational method was used to calculate the peak discharge that can be generated from the catchment area (for cutoff drain and waterway design) and from between two consecutive bunds for bund design.
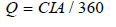
Where: C = Runoff coefficient; I = Maximum average rate of rainfall over entire area which may occur during time of concentration, cm/hr; A = contributing area, ha; Q = Design peak runoff rate, m3 sec-1. Since there is rainfall intensity data scarcity in Ethiopia, time of concentration (Tc) which is equivalent to duration and IDF curve developed for the area [9] were used to calculate intensity(I). Time of concentration was calculated as:
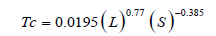
Where: Tc = Time of concentration, min.; L = Maximum length of travel, m; S = Average land slope, m/m.
Dimension of graded bunds: Bund height, top width, bottom width and side slope of the are the major dimensions of the bund. In stable soils the embankment will have side slopes of 1:1 (horizontal: vertical) but in unstable soils a 1.5-2:1 side slope is preferable, Height of the bund will depend on the land slope, expected maximum rainfall intensity of the area and vertical spacing used, To allow for compaction a 20% freeboard and a 15% settlement clearance increase on height and a berm of 10 to 25cm was left between the embankment and the edge of the channel to prevent the soil from sliding back. One Height of bund was determined the bottom width and top width of the bund can be derived using bund side slope and seepage line slope as:
Base width to accommodate the seepage line (B1): B1= h *Slope of seepage line
Base width to suite side slope (B2): B2 = h *side slope of bund
Total base width (Bt): Bt = B1 +B2
Top width (T): T= Bt – 2ht *side slope of bund
Capacity of the designed bund was checked by calculating hydraulic radius, mean velocity and then discharge capacity as:
Hydraulic radius (R): R = A / P
Where: A= area of water spread due to bund; P = Perimeter
Mean velocity:
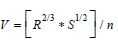
Where: S = gradient (m/m); n= manning’s coefficient
Discharge capacity (Q): Discharge capacity of the structure should exceed the peak discharge to withstand the generated runoff and estimated as:

Data Analysis
The quantitative data was summarized, tallied and coded by using Microsoft Excel 2007 and then entered to SPSS software version 16. The analysis of HH demographic and socio-economic characteristics was undertaken by using appropriate statistical tools such as one way ANOVA, chi-square and descriptive statistics: frequencies, percentages, SD, and graphs. Qualitative data were analyzed and described through opinion interpretations after organized and categorized.
Results and Discussion
Demographic characteristics of the respondents
The total sample of the study is composed of Sekoru 97.8%, Gomma 94.4% and Manna district 93.3% male-headed households while the remaining 2.2%, 5.5% and 6.6% of female-headed households from Sekoru, Gomma, and Manna district, respectively. This shows that statistically there is an insignificant difference between districts with regard to sex (P>0.05).

The mean age of sampled households is 44 with minimum and maximum age of 21 and 73 respectively. More than half of respondents from three districts are in the middle age group (31-55) and the proportion of younger household heads is higher in Manna district (Table 2). On the other hand, the proportion of younger household heads is much smaller in Gomma district compared to Sekoru and Manna. The age difference between the three districts, however, is found to be statistically insignificant suggesting age has to influence the implementation of SWC structures (P>0.05).
The average family size for three districts Sekoru, Gomma, and Manna was 7.4 which are higher than the national average family size of 6.4 people per household. The result of one-way ANOVA confirms that statistically there is no significant difference (P>0.05) in family size with regard to Sekoru, Gomma and Manna districts. Therefore, from this result and personal judgment during data collection, it’s possible to conclude and suggest that labor availability is a major factor influencing households’ decision to implement soil and water conservation structures their own land. Hence, the availability of labor force directly influences the implementation of soil and water conservation structures in the study area. Concerning the marital status of respondents, about 93.3% in Sekoru and 83.3% in Gomma district are married, while 91.1% of respondents in Mana were married (Table 3).

Note: NS= not significant p<0.05
Socio-economic characteristics of the households
Educational level: Education is an important factor that plays a major role in a household decision in adopting new technology. It helps much in creating awareness on new technologies and its applications. The study showed that most of the sample households are found to be read and write (1-4) and the remaining elementary school (5-8) (Table 4). The result also found that the number of uneducated households was higher in Gomma and Manna than Sekoru district. From the total sample respondents, only a few respondents have completed their high school. In general, the result shows that respondents in Sekoru district have a better educational opportunity than the two districts. Furthermore, the statistical test indicates that there is a significant difference among district of household heads in their educational achievement (P<0.05).

Note: **Significant at P<0.05
Wealth Status
Household livestock ownership: In order to standardize the size of livestock, the livestock of each household is converted into Tropical Livestock Unit (TLU) by using the conversion factors suggested by Stock et al. [10]. Accordingly, the average TLU owned by the respondents in Sekoru, Gomma and Manna were 4.3, 3.0 and 5.3, respectively. More than half of respondents from the three districts that constitute 6-10 TLU and only Manna district-owned lower TLU (Table 5).

Implemented Soil and Water Conservation Structures: In the study area, different physical soil and water conservation structures were implemented. However, soil bund and cutoff drain are the most dominant one in the three districts; soil bund constructed 76.9% by Manna district, 53.9% of Sokoru 75.7% by Gomma district (Table 6). In the same manner, Manna and Gomma districts were highly constructed cutoff drain in the area.


On the other hand, biological soil and water conservation structures were implemented due to fragile topographic nature of the area. Accordingly, live fence biological structure is the most dominant conservation practice in Gomma district next to Manna (Table 7). Similarly, bund stabilization with vetiver grass is widely implemented in the study area. In general, the result shows that three districts were implemented in different physical and biological soil and water conservation structures in the area.
The statistical test result shows that there is an insignificant difference between districts with regard to soil and water conservation structures implementation (P>0.05). This is because the contribution of different non-governmental organizations (NGOs) are higher in terms of giving training, extension services, experience sharing and visiting demonstration sites. During focus group discussion, discussants responded that in the study area, households widely implemented different physical and biological soil and water conservation structures individually since the area is fragile and mountainous.
Soil and water conservation preferences in the study area
The assessment was made on which soil and water conservation structures on the bases of difficultness and easiness to construct/ implement. According to the respondents’ soil and water conservation measures easy to implement were more preferable. Easiness is measured in the study area in terms of labor intensiveness and material (soil or stone). Most of the interviewed farmers 45.7% from Manna, (65.2% from sokoru and 31.2% from Gomma stated that Check dam was difficult to construct. But only 10% from Manna, 19% from Sokoru and 14.5% from Gomma believed that soil bund was difficult to construct and implement. This result implies that bund (soil or stone bund) is the most preferable structure to implement in the study area as shown in Figure 2 below.

Maintenance of Implemented Soil and Water Conservation Structures
According to the survey result, almost all sample districts implemented different SWC structures in the area. However, the performances of the structures are very low. Accordingly, about 26.6% of Sekoru respondents maintained the implemented conservation structures, Manna 21.1% while the remaining 12.2% of Gomma were maintained the implemented structures (Figure 3). The statistical test result shows that there is a significant difference (P<0.05) between districts via structures maintenance. This indicated that sekoru and manna district have better performance by structures maintenance than Gomma district.

This is because of in Sekoru and manna district different NGOs were involved with conservation structures application and maintenance. According to FGD, GIZ and SLM NOGs were highly supported by the local households as related to natural resource conservation. Therefore, respondents in Sekoru and manna district have better awareness about the conservation activities and other related issues compared to Gomma district. In addition to this, both districts; Sekou and manna have different access like incentive, farm materials provided by different NGOs
Major Constraints of Soil and Water Conservation Structures
Training: Training on soil and water conservation technologies is one of the important factors that influence the involvement of farmers in natural resource conservation. Accordingly, about 65.6% of Sekoru, 67.8% of Manna and 34.4% of Gomma respondents have access to training (Table 8). The statistical test result confirmed that there was a significant relationship between districts concerning training participation in soil and water conservation (P<0.05). Comparatively, Gomma had less opportunity or access to training. This is because of the availability of different non-governmental organization in Sekoru and manna districts. Hence, during FGD discussants responded that most of the time training was often given by different NGOs like GTZ and SLM in both districts. On the other hand, in Gomma district, farmers got training access often from government bodies including political leaders. The more the local farmers get soil and water conservation training, more likely that they acquire the relevant information about soil and water conservation technologies.
Extension Services: The household survey result indicated that 43.3% of Sekoru, 37.8% of Gomma and 54.4% of Manna respondents got better extension service. The chi-square test shows that there is the insignificant difference between districts with regard to extension service in the study areas (P>0.05) (Table 8). Agricultural extension services are fundamental for the development of natural resource conservation, providing training, accessing the supply of inputs timely and giving various information that ranges from production to marketing. Moreover, it represents local farmers’ frequency of contact with DAs and frequency of participation in extension planning, training, field day, on-farm trial and demonstration regarding agriculture and livestock production. Thus, extension service has a positive impact on enhancing natural resource management.
Farm Material: Farm materials are one of the most important factors whether to implement soil and water conservation technologies or not. It was identified that the about 46.7% of Sekorus’ and 61.1 of Manas’ respondents have sufficient farm tools to implement SWC technologies. On the other hand, in Gomma district, only 21.1% of respondents have access to farm tools. And also, statistically significant difference was observed in owning farm tool between districts (P<0.05) (Table 8). Most of the time manna and Sekoru district have better access to work with different NGOs, as a result, Gomma district farmers own fewer farm tools to implement SWC structures.
Manpower: 51.1% of Sekoru respondents and 61.1% of Manna respondents have adequate manpower while the remaining 44.4% of Gomma respondents have the better manpower (Table 8) to implement soil and water conservation structures. The statistical analysis showed that there was no significant difference between districts with regard to man power (P>0.05).

Note: **significant at P<0.05 and NS= insignificant P<0.05
Evaluation of technical standard of implemented soil conservation structures
Graded soil bund embankment and spacing dimensions: In Manna and Gomma districts implemented soil bund spacing and embankment dimensions (top width, height and bottom width) were less than the standard or calculated specification. Implemented structure lacks ability to hold the peak discharge that can be generated in between two consecutive bunds when the implemented structure embankment dimensions are less than the standard. This may cause serious damage to the field via initiating rill and gully erosion. Spacing of soil bund was less than the standard in some areas while it was implemented with more than the recommended bund spacing in other places as indicated in Table 9. When mechanical soil and water conservation structures is implemented with less spacing large area of land can be lost and farmers are not interested to implement the structure, and when it was implemented with large spacing more runoff can be generated causing over topping. Due to this over toping serious problems like rill or gully erosion could be initiated which requires more labor and budget to overcome the problem.
Graded soil bund channel dimensions: Implemented bund channel depth in Manna and Gomma districts were less than the calculated depth to hold the peak discharge generated and to remove the excess runoff at a non-erosive velocity (Table 10). This can also be a cause for overtopping and hard to reverse the problem. The width of the soil bund channel was a little bit greater than the calculated width which was resulted with more the area of land lost by bunds and requires more labor.


Stone bund spacing and embankment dimensions: Stone bund was implemented in Sokoru district and when the dimensions were compared with the standard, the spacing, height, top width and bottom width dimensions were less than the standard. Since it was implemented with less spacing which makes more area to be lost due to the implemented structure. In addition, it could be labor intensive when applied with small spacing (Table 11).
Graded fanyajuu embankment dimensions: From assessed graded fanyajuu spacing and embankment dimensions at six PAs of three districts, the spacing of the implemented fanyajuu has deviated negatively in most PAs from the standard which means the implemented spacing was less than the standard/calculated spacing. As a result, the area lost by the structures increases and makes farmers resistant in the adoption of SWC structures. Height and top width of the structure have also deviated negatively from the standard. But the bottom width of the structure deviates negatively at many areas and also deviates positively at some places from the calculated graded fanyajuu dimensions (Table 12).


Graded fanyajuu channel dimensions: Similar to soil bund depth implemented graded fanyajuu channel depth was less than the standard depth at all assessed PAs, while the width of the channel was greater than the standard dimension. These standardized dimensions were made to hold the peak discharge that could be generated from between the consecutive bund spacing (Table 13).

Percentage of area lost: The mean percentage of area lost per hectare due to the standardized bottom width on the bases of land slope and vertical interval 12% of land per hectare was lost and while it was about 10% due to the implemented graded soil bund in the area on average. And when graded fanyajuu was done according to the standard about 16% of land area per hectare will be occupied by bund dimensions and about 15% of land area per hectare was already lost due to currently implemented graded fanyajuu dimensions. Similarly, 12.5% of the land would be lost if the stone bund was implemented according to the standard in the assessed districts and PAs. But due to the implemented stone bund, about 7% of the land was lost currently in the area.
These results implied that the area lost due to soil bund and fanyajuu had no great difference in between the standardized and implemented dimensions in almost all areas. The standardized dimensions were calculated to make the structure dimensions capable of holding the generated peak discharge or runoff (Table 14).

Conclusion and Recommendations
This study revealed that evaluating technical standards of implemented soil and water conservation structures in three districts. Hence, from this study, it can be concluded implemented structures composited the area lost due to structures stabilization work by forage trees and different grasses. Stability of the embankment, soil bund depends on the dimensions of the structures like side slope, seepage line slope in addition to a land slope. Once the height of the structure is determined the left dimensions can be derived from the height using empirical formulas. If the top width and bottom width do not fit with the seepage line and side slope embankment failure happens. Due to this runoff generated over tops causing rill and gully erosion which is difficult to control
To sum up, in the study area, different SWC structures implemented by community mobilization are not standardized due to lack of awareness and shortage of training. Consequently, it is difficult to manage the watershed in different areas. Every year SWC structures have been implemented via community mobilization on the same lands. Furthermore, major constraints during SWC structures implemented, knowledge and skill gap, lack of sufficient materials, trained manpower and so on.
Based on the above findings, the following recommendation can be drawn for further consideration and improvement of SWC structures in the study area in particular and in the country in general.
a. Well organized training should be given for experts at different levels to fill the technical gap on their skill
b. Extension services like demonstration should be held for all stakeholders before implementing the structures.
c. Soil and water conservation structures should be planned by experts at PA and district level rather than planning at a zonal or regional level for its quality and effectiveness.
References
- Ildefonso Pla Sentís (2002) Assessment of Environmental Impacts Derived of Soil and Water Conservation Practices. 12th ISCO Conference; Beijing, pp. 282-290.
- Mati BM (2012) Soil and Water Conservation Structures for Smallholder Agriculture. Training Manual 5. Nile Basin Initiative (NBI), Nile Equatorial Lakes Subsidiary Action Programme (NELSAP) - Regional Agricultural and Trade Programme (RATP), Bujumbura, Burundi, p. 60.
- Belayneh Adugna, Getachew Bayafers (2002) A Field Guide on Design and Construction of Drainage Control Structures. Nile Basin Initiative.
- Sheng TC, Meiman JR (1988) Planning and implementing soil conservation projects. In: W.C. Edited by Moldenhauer and Hudson, N.W. Conservation Farming on Steep Lands. Soil and Water Conservation Society. Ankeny, Iowa, USA.
- Martin G Grunder (1988) Soil conservation research in Ethiopia. Mountain research and development 8(2-3): 145-151.
- Desta L, Carucci V, Wendem-Ageňehu A, Abebe Y (2005) Community- based Participatory Watershed Development: A Guideline. Federal Democratic Republic of Ethiopia Ministry of Agriculture and Rural Development, Addis Ababa, Ethiopia, p. 74.
- Yishak K, Taye T, Aynalem H (2013) Characteristics and Determinants of Livestock Production in Jimma Zone/Southwestern Ethiopia. African Journal of Basic and Applied Sciences 5(2): 69-81.
- JZAO (2016) Jimma Zonal Agricultural office annual report on participatory watershed management. Jimma, Ethiopia.
- ERA (2013) Ethiopian road authority, drainage manual: Hydrology part-A. Ethiopia, Addis Abeba, Ethiopia, p. 85.
- Storck H, Bezabih Emana, Berhanu Adnew, Borowiccki A, Shimelis W, et al. (1991) Farming Systems and Resource Economics in the Tropics: Farming System and Farm management practices of small holders in the Hararghe Highland. Vol. II, Wissenschaftsverlag Vauk, Kiel, Germany.


