


Market Chain Analysis of Cotton the Case of Arbaminch Zuria District, Gamo Gofa Zone, Ethiopia
Abayneh Feyso Ergetew*
Department of Agribusiness and Value Chain Management, Arbaminch University, College of Agricultural Science, Ethiopia
Submission: October 27, 2018; Published: November 20, 2018
*Corresponding author: Abayneh Feyso Ergetew, Department of Agribusiness and Value Chain Management, Lecturer at Arbaminch University, College of Agricultural Science, Arbaminch, Ethiopia.
How to cite this article: Abayneh F E. Market Chain Analysis of Cotton the Case of Arbaminch Zuria District, Gamo Gofa Zone, Ethiopia. Agri Res& Tech: Open Access J. 2018; 18(4): 556069. DOI: 10.19080/ARTOAJ.2018.18.556069
Abstract
Both primary and secondary data were used. A total of 123 sample households were selected from three kebeles of Arbaminch zuria district and 26 cotton traders, 9 small and micro enterprises, and one textile company were interviewed using semi structured questionnaire. Descriptive statistics and Econometrics models were used to analyze the data. Descriptive statistics results show that the main cotton market chain actors in the study area are input supplier, producers, local collectors, wholesalers, ginners, cottage level weavers, textile factories and retailers. Market concentration ratio at district level was calculated using HHI and its value was 0.553, which shows that cotton marketing was highly concentrated on hands of few in the study area.
Econometrics models analysis shows that six variables, namely; cotton farming experience, size of land allocated to cotton in hectare, use of improved seed and current year cotton price were significant at 1% significance level, whereas number of extensions contact and distance to nearest market were found to be significant at 5% significance level. Provision of new improved cotton varieties, regulation and implementation of cotton price tariffs, strengthening and provision of sustainable and knowledge-based extension service were recommended to improve and strengthening cotton value chain in the study area.
Keywords: Cotton; Market chain; Chain actors; Marketing; Arbaminch zuria
Abbrevations: SNNPRs: Southern Nation’s Nationalities and Peoples Regional State; TGMM: Total Gross Marketing Margin; ME: Marketing Efficiency; HHI: Herfindahl-Hirschman Index; GMMLC: Gross Market Margin of Local Collectors; GMMRR: Gross Market Margin of Retailers; GMMWS: Gross Market Margin of Wholesalers; GMMTC: Gross Market Margin of Textile Company; GMMPP: Gross Market Margin of Producers
Introduction
Background and justification
Ethiopia is believed to be one of the origins of cotton, and cotton cultivation is deep-rooted in the history of the country’s agriculture. It is one of the major cash crops in the country and is extensively grow in the lowlands under large-scale irrigation schemes and also it is grow on small-scale farms under rain-fed agriculture. The economic value of cotton in the Ethiopian economy is significant. Firstly, it is a major industrial input for textile firms. The textile and garment industry is one of the priority areas in Ethiopia’s industrial policy. Secondly, cotton is a major export crop [1]. However, Ethiopia share only about 5% of total cotton produced in Africa [2]. As to total arable and potential area for cotton production, the country is utilizing below potential. According to Bosena et al. [3], out of the country’s total potential areas for cotton production, only about 4% is being utilized. As a result, the amount of cotton produced in the country is low. Cotton is grow in many regions in the country. In each region, there are wide potential areas. Gamo Gofa zone is the second largest cotton growing region in the country after the Amhara Region [4]. However, most studies which have been conducted on cotton marketing [1-3,5] were limited to a specific (Awash Valley, Humera, Metema and Abobo) areas. This study was designed to analyze cotton market chain to generate information about its entire market chain in the study area due to absence of adequate information on cotton market channel, market structure, conduct and performance cotton marketing had been a challenge for the farmers as they were getting low prices from the local middlemen [6]. Having these evidences, cotton market chain analysis is conducted in Arbaminch Zuria District of Gamo Gofa zone with the specific objectives of analyzing cotton market channel, market structure, and conduct performance and to analyze factors affecting market supply of cotton at farm level.
Research Method
Description of the study area
Arbaminch zuria district is one of the districts found in Gamo Gofa zone of the Southern Nation’s Nationalities and Peoples Regional State (SNNPRs). The District is located at a distance of 275 and 505km from the regional city, Hawassa and the country capital, Addis Ababa, respectively. The district covers 1001km² and has twenty-nine rural kebeles and one District town. Based on 2007 population census, Arbaminch zuria district had a total population of 164,529 of whom 82,199 (49.9%) are men and 82,330 (50.1%) are women.
The population density of the study area varies from172 person/km2 to 2268 person/km2. The mean monthly maximum and minimum temperature of the study area ranges between 33.8 ˚C in February to 28.1 ˚C in July and 18.2 ˚C in April to 15.3 ˚C in December. The mean annual total rainfall of the study area is about 963.3mm with two rainy seasons. The main rainy season is March, April and May which have 172.35mm and 129.13mm mean monthly rainfall in April and May, respectively. The second highest monthly rainfall is recorded in September and October, 126.6mm and 133.05mm.
Sampling procedures and sample size
To draw representative cotton producer farmers. In the first stage, three kebeles were selected randomly from ten cotton producer kebeles of the study district. In the second stage, households were selected randomly from complete list of households of selected kebeles and sample size was determined according to formula given by Yamane [7], at 95% confidence interval with 9% precision level (e) = 0.09.
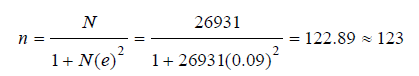
Where;
n: sample size for research use, N: total number of households of the Arbaminch zuria district and e: designates precision level and ranges from 0.05 to 0.1.
For this research e=0.09 was taken as precision level. Because according to Meryem [8]. as ‘e’ gets approaches to 0.05 the sample size gets larger and larger, as a result it becomes difficult to manage. Sample size for each kebele was distributed based on proportional to size of total households.
Trader survey was held at Kola shelle market places during pick cotton harvesting period since, November 1st to December 30th because marketing held on weekly basis once every Saturday and farmers supply cotton to only Kola shelle market. All local collectors (6 in number), wholesaler (only one in number) and retailers (19 in number) were sampled and interviewed.
Methods of data analysis
Descriptive and econometric data analysis methods were used to analyze the data. Socio-economic and demographic characteristics of market actors and market structure- conductperformance were analyzed using descriptive statistics while econometric model was used to analyze factors affecting quantity of cotton supplied to market.
To identify market structure Hirschman Herfindahl index was used to measure degree of market concentration to characterize market structure. HHI was used because unlike the four-firm concentration ratio, it reflects both the distribution of the market shares of the top four firms and the composition of the market outside the top four firms. It also gives proportionately greater weight to the market shares of the larger firms, in accord with their relative importance in competitive interactions [9]. Market concentration is a function of the number of firms in a market and their respective market shares. HHI is calculated as:
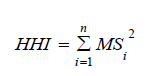
Where;
MSi: Is the Market Share of seller i; and n: Is the number of sellers in the market. The market shares were calculated based on quantities of cotton handled by each seller as follows:
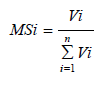
Where;
Vi: is the quantity of cotton handled by ith seller (in kg); and ΣVI is the total quantity of cotton handled by sellers in the market (in kg).
To measures of the performance of cotton marketing system marketing margin and marketing efficiency were used. Marketing margin is defined as the difference between the price the consumers pay and the price the producers receive. Computing the total gross marketing margin (TGMM) is always related to the final price paid by the end consumer, expressed in percentage [10].
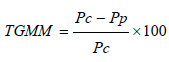
Where;
TGMM=total marketing margin; Pc =consumer price; Pp =producer price.
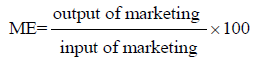
Also marketing efficiency was analyzed to measure either cotton marketing was efficient or not. Marketing efficiency is defined as the ratio between net marketing returns and marketing costs expressed as a percentage. According to Osougwu [11], marketing efficiency (ME) ratio ranges from zero (0) to infinity. A ratio of 100% shows that the market is perfectly efficient because price increment is just high enough to cover the cost of marketing commodities.
Multiple Linear Regression model was used to analyze factors affecting farm level cotton supply in Arbaminch zuria district. According to Gujarati [12], model specification of supply function in matrix notation was specified as:
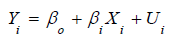
Where;
Yi = quantity cotton supplied to the market (Kg/house hold/ year), βo : is constant term, a vector of estimated coefficient of the explanatory variables, Xi : a vector of explanatory variables, : disturbance term.
Result and Discussion
Socio-economic characteristics of sampled households
The survey result in (Table 1) below shows that mean age of the sample households head was 50.7 years whereas average cotton farming experience of sampled cotton producer farmers was 27.61 years. It is believed that household heads with long years of experience benefits from cotton production decision making and risk taking.

Source: Author Computation, 2016

Source: Author Computation, 2016
The survey result presented in (Table 1) above shows that mean family size of the total sampled households was 8.9 with average working age family members of 3.9 which was higher than that of dependent age group. Having large family size with working age group might have a positive impact on the volume of cotton production and marketing and also might reduces the extra labor cost incurred for cotton production and marketing.
Survey result presented in the (Table 2) shows that mean age of sampled traders was 38.26 years and 53.8% of the sample traders were male and 46.2% were female. Also, survey result shows that among total surveyed traders 73.1% were retailers, 23.1% were local collectors and only 3.8% were wholesalers. The survey result shows that 65.4% of the surveyed traders has attended grade 1-4, 23.1% attended grade 5-8, 7.7% and 3.8% were attended grade 9-10 and above grade 10+1, respectively. As depicted in (Table 2) above among surveyed traders, 76.9% were not licensed and only 23.1% were licensed. With regard to source of initial capital 96.2% were started the business with their Author saving.
Cotton marketing channel
Marketing channel is the sequence of intermediaries through which commodities pass from producer to consumer [13]. This channel may be short or long depending on kind and quality of the product marketed available, marketing services and prevailing social and physical environment. Having such concepts in this part of the paper marketing channels were analyzed to identify the alternative routes through which product flows from the point of origin to final destination. The main marketing channels identified from the point of production until the product reaches to the final consumer were three. Their integration and commodity flow routes described below.
Channel I: Farmers⟶Retailers⟶Local Ginners⟶Handloom Weaver⟶consumers

Source: Author Computation, 2016
As indicated in the (Table 3) and (Table 4) above 23.58% of sampled households sold cotton to retailers and average maximum quantities of cotton supplied from sampled household were 200kg and total quantity sold via this channel from sampled house hold were 9.3%.
ChannelII: Farmers⟶LocalCollectors⟶Wholesalers⟶Textile Company⟶Consumers
As depicted in the (Table 3) and (Table 4) above 52.03% of sampled households were sold their cotton through local collectors and local collectors to wholesalers and after ginning wholesalers sold to Textile factories and finally after transformation of different clothes and clothing items textile company sold to consumers. Total quantity of cotton passed through this channel was 62.32%, which was the largest quantity among the two channels cotton supply.
ChannelIII: Farmers⟶Wholesalers⟶Textile Company⟶ - Consumers

Source: Author Computation, 2016

As described in the (Table 3) and (Table 4) above 24.39% of sampled households sold their cotton through this channel, which was the second large quantity of cotton supply, which was 28.36%. In this channel sampled households sold their seed cotton to wholesalers and after ginning wholesalers sold to textile factories and finally after transformation textile factories sold to consumers (Figure 1).
Cotton market structure-conduct-performance
Cotton market structure: Market structure consists of the characteristics of the organization of a market which seems to influence strategically the nature of competition and pricing within the market [14]. In this study the structure of cotton marketing was characterized using the following indicators: market concentration, the degree of transparency (market information) and entry conditions (licensing, seasonality of business and policy barriers).
Market concentration: For this study only Herfindahl- Hirschman Index (HHI) was used because of the following benefits, according to Wisdom et al. [9], unlike the four-firm concentration ratio, the HHI reflects both the distribution of the market shares of the top four firms and the composition of the market outside the top four firms. It also gives proportionately greater weight to the market shares of the larger firms, in accordance with their relative importance in competitive interactions (Table 5).

Source: Author Computation, 2016
According to Naldi and Flamini [15], the HHI is obviously a
positive figure. If the market shares are expressed as fractions of
the whole market (that is., 0 The value of the HHI provides an indication of the level of
concentration, with the maximum value corresponding to the
case of the monopoly, and the minimum corresponding to perfect
competition. Hence, the higher the value of the HHI, the higher
the concentration of the market in the hands of a few companies.
The U.S. Department of Justice provided guidelines for horizontal
mergers first in 1985 and later revised them several times, till the
latest version in 2010. For this study Herfindahl-Hirschman Indices was calculated
by taking individual traders shares as fractions of the whole
market to assess market concentration and its value was 0.553,
which shows that cotton marketing was highly concentrated in
hands of few in Arbaminch Zuria district. Degree of transparency: For this study degree of transparency
was expressed in terms of the level of market information sharing
among parallel cotton traders and cotton traders with cotton
producing farmers. Source: Author Computation, 2016 As depicted in (Table 6) above among sampled households
65.85% obtain market information from neighboring farmers,
22.76% obtained information from both farmers and traders
and only 11.39% obtained market information from traders. This
shows that market information (demand, supply, pricing and other
information) sharing among cotton traders and cotton producing
farmers was weak. Furthermore, about 52.85% of sampled
households gather information through observing market places,
which was tedious, expensive and time consuming method. It
takes farmers extra labor and consumes more time. As indicated in (Table 6) above 96.15% of traders share
information about producer price and only 3.85% shared about
retailer price. Furthermore, 92.3% traders not collaborate
each other. This indicates that information sharing as well as
collaboration among cotton traders in Arbaminch zuria district
was weak. Barriers to entry conditions: Barriers to entry to existing
market can be defined in a variety of ways – any factors that
increases the unit production cost of new entrants, or any
impediments that imposes a cost on new entrants but not on
the incumbents. In order to find out the factors that constrain
the entry of new firms in the market, most studies have used
data at industrial level as stated in Cubero [16]. Entry barriers
for cotton marketing in Arbaminch zuria district were licensing
requirements, seasonality of cotton supply and policy issues
which are discussed in (Table 7) below. Source: Author Computation, 2016 As depicted in (Table 7) above 76.9% of sampled traders did
not have cotton marketing license. This indicates that licensing
requirement did not impede new entrant for cotton marketing.
Furthermore, 88.5% of traders undertake, cotton marketing for
only two months (October to December), which was period of
high cotton supply, but those small quantity purchasers undertook
the business throughout the year, which were only 11.5% among
surveyed cotton traders. This indicates that seasonality of cotton
marketing hinders new entrant to the business. Also 96.2% of
sampled traders did not have awareness about cotton related
government policies. This indicates that having or not having
awareness about cotton marketing, government policies could
not affect entry to cotton marketing in Arbaminch zuria district
negatively. From all the above observed situations which are large HHI,
information imperfection and presence of some barriers to entry
let cotton market structure to be classifies as oligopoly market structure. Hence, cotton market in Arbaminch zuria district
deviated from competitive market norms. Cotton market conduct: Market conduct refers to the
patterns of behavior that traders and other market participants
adopt to affect or adjust to the markets in which they sell or buy.
These include price setting behavior, and buying and selling
practices, weighing and trust among seller and buyers. As indicated in (Table 8) above sampled cotton producing
farmers reported that price for cotton was determined by traders.
However,100% sampled traders reported that they encountered
problems in cotton marketing and 92.3% of traders reported
that cotton producer farmers supply quality deteriorated cotton
to the market. Field observation indicates that there was cheat
among cotton producer farmers and traders. Farmers adulterate
cotton with stones and soil and bring watered cotton to market to
weigh high. Traders also cheat farmers when they weigh cotton.
Furthermore, 100% of sampled cotton producer households
reported absence of grading in cotton as a result they receive the
same price whether they brought quality cotton or not. Source: Author Computation, 2016 Cotton market performance: Cotton marketing performance
was measured in marketing margin and market efficiency.
According to Adegeye and Dittoh [17], marketing margin refers
to the difference in price paid to the first seller and that paid by
the final buyer. According to Jema [18], marketing margin is the
whole price in excess of farm price. But, for cotton marketing
output of marketing was proxied by net profit from cotton
marketing activities and input of cotton marketing was proxied
by cost of cotton marketing and which were calculated as
follows: GMMLC=2.76%, GMMRR=3.68%, GMMWS=21.41%,
GMMTC=53.77%, GMMPP=18.38% Where; GMMLC was gross market margin of local collectors, GMMRR
was gross market margin of retailers, GMMWS was gross market
margin of wholesalers, GMMTC was gross market margin of textile
company and GMMPP was gross market margin of producers. Source: Author Computation, 2016 As presented in (Table 9) total gross margin added to cotton
price when it passes through the marketing system was 81.62%.
The farm retail price which were accrued to each category of
participants in return for the marketing services other than
farmers in percentage terms of local collectors, wholesalers,
retailers and textile company were, 2.76%, 21.41%, 3.68% and
53.77%, respectively. The farmer’s share of the price to end user was 18.38%.
Local collectors receive smaller percentage of profit (3.07%).
However, wholesalers received relatively larger percentage of
price (53.38%) and retailers were received 11.36% and Textile
Company received 11.6%, respectively According to Osondu et al. [19], marketing efficiency ratio of
100% shows that the market is perfectly efficient because price
increment is just high enough to cover the cost of marketing
cotton. And also, it shows a break-even point because the value
addition (marketing cost) is equal to the net profit obtained as
a result of the value addition. Marketing efficiency value below
100% is indicative of inefficiency; more is spent on value addition
compared to the margin received after value addition. According
to Scarborogh and Kydd [20], marketing efficiency value that is
greater than 100% indicates excess profit for the marketers. As
presented in (Table 9) above wholesalers and retailers operate
with marketing efficiencies of 220.8% and 133.33% respectively.
However, both the producers, local collectors and textile company
marketing were considered inefficient because their market
efficiency was below 100. Multiple linear regressions model analysis was used to
identify factors affecting quantity cotton supply to market. Before
fitting multiple linear regressions, the hypothesized explanatory
variables were checked for existence of multicollinearity,
heteroscedasticity and endogeneity problem. Test of multicollinearity: All VIF values are less than 10. This
indicates absence of serious multicollinearity problem among
independent variables. If there is presence of multicollinearity
between independent variables, it is impossible to separate the
effect of each parameter estimate in the dependent variables. Test of heteroscedasticity: Since there is heteroscedasticity
problem in the data set, the parameter estimates of the
coefficients of the independent variables cannot be BLUE.
Therefore, to overcome the problem, Robust OLS analysis with
heteroscedasticity consistent covariance matrix was estimated. Test of endogeneity: When a variable is endogenous, it
will be correlated with the disturbance term, hence violating
the OLS assumptions and making our OLS estimates biased.
Testing for endogeneity of productivity of cotton were carried
out in the model using both Hausman test and Durbin-Wu-
Hausman (DWH) test and endogeneity problem were not found
in productivity variable in cotton. Hausman test result indicated
that, the predicted productivity was statistically insignificant with
(p=0.1203) for cotton. In the first stage of 2SLS method, regressions was run
and analyzed using eleven explanatory variables including
instrumental variable and the result shows that, size of land
allocated to cotton, improved seed, extension contact and current
year cotton price were affects positively and significantly the
productivity of cotton whereas cotton farming experience affects
negatively and significantly the productivity of cotton. Size of
land allocated to cotton production was used as instruments
for productivity. In second stage of 2SLS from hypothesized
eleven explanatory variables six variables productivity of cotton,
cotton farming experience, distance from nearest market, use of
improved seed, frequency of extension contact and current year
cotton price significantly influence quantity of cotton supply to
market. Therefore, application of ordinary least square (OLS)
method of data analysis was found to be appropriate for the study. Factors affecting farm household level cotton supply to
market: Access to credit was omitted from the model because all
interviewed cotton farming household’s response was the same.
Also access to market information was omitted from the model
because descriptive statistic result shows that absence of market
information variation among sampled cotton producer farmers
was insignificant. Dependent variable (Quantity of cotton supplied
to market) was transformed to natural logarithmic form. The
explanation on the effect of the significant explanatory variables
is discussed below. Dependent variable is quantity of cotton supply to market in 2016, Number of observations = 123, F (12, 110), Adj R-squared=0.95 Source: Author Computation, 2016 Note: ***, **, *, significance at 1%, 5%, and 10%, respectively. Cotton farming experience: This is continuous variable
and hypothesized to affect cotton supplied to market positively.
In contrast cotton farming experience affected cotton supplied to
market negatively at 1% level of significance. Existing tradition of
cotton farming, in Arbaminch zuria district is losing its originality
due to obstacles faced by substituting other cash crops like banana
and food crops like teff and maize as indicated in Merima and
Gezahegn [21]. Similarly, field observation shows that farmers
with long farming experience were cultivating banana as cash
crops rather than cotton. Also, they did not cultivate cotton on
irrigated land, but they cultivate cotton on marginalized and nonirrigated
plots of land. As regression result indicated in (Table 10)
keeping other factors constant, an increase in farming experience
by one year decreases cotton supply by 1.1%. Land allocated to cotton in hectare: This is continuous
variable and hypothesized to affect cotton supplied to market
positively. As hypothesized earlier, the variable is positively
related to amount of cotton supplied to market at 1% level of
significance. As regression result shows in (Table 3) keeping other
factors constant, an increase in one hectare of land allocation to
cotton cultivation increases cotton supply by 26.8%. The result
coincides with the study of Bosena et al. [3], Beza [22] and Addisu
[23], where increase in land increased cotton, food grain, maize
and faba bean and onion volume supplied to market, respectively. Use of improved seed: This is dummy variable and
hypothesized to affect cotton supplied to market positively. As
hypothesized earlier, the variable is positively related to amount
of cotton supplied to market at 1% level of significance. As
indicated in regression result keeping other factors constant, use
of improved cotton varieties increases cotton supply by 81%.
The result of study was in line with previous study conducted
by Alemayehu [24], where use of new ginger variety increased
amount of ginger supplied. Current year cotton price: This is continuous variable
and expected to affect cotton supplied to market positively. As
hypothesized, the variable is positively affected amount of cotton
supplied to market at 1% level of significance. As regression
result indicates that keeping other factors constant, increase in
one birr per kilo gram of cotton increase cotton supply by 33.1%.
The study result was in consistent with previous study conducted
by Alemnew [25], Mebrat [26], and Wendmagegn [27], where
increase in one birr increased red pepper, tomato and coffee
quantity supplied to market, respectively. Extension contact: This is continuous variable and expected
to affect quantity of cotton supply positively. As expected, number
of extensions contact positively affected the amount of cotton
supplied to market at 5% level of significance. As regression result
indicates keeping other factors constant, an increase in extension
contact per production year increases cotton supply by 1.9%. This
result was in confirmation with the study conducted by Ayelech
[28], Mohammed [29], Wendmagegn [27] and Bizualem et al. [30],
where increase in unit of contact with extension increased mango,
teff and wheat and coffee quantity supplied to market, respectively. Distance to nearest market: This is continuous variable and
expected to affect quantity of cotton supply to market negatively.
As hypothesized, the variable is negatively related to amount
of cotton supplied to market at 5% level of significance. Thus,
regression result shows that keeping other factors constant, an
increase in one kilo meter far away from nearest market decreases
cotton supply to market by 1.8%. The result of study was in
consistent with previous study conducted by Mohammed [29],
Mebrat [26], Wendmagegn [27], Yimer [31], where increase in
1-kilometer, decreased coffee, tomato, and fruit quantity supplied
to market, respectively. 


Econometric results

Conclusion and Recommendation
Conclusion
Structure of cotton marketing was characterized using: market concentration, the degree of transparency (market information sharing) and entry conditions (licensing, seasonality of business and policy barriers). To measure market concentration HHI was used and its value was 0.553, which shows that cotton marketing was highly concentrated on hands of few in Arbaminch zuria district. Among sampled households only 11.39% gather market information from traders and 22.76% gathers information from both farmers and traders. This shows that market information (demand, supply, pricing and other information) sharing among cotton traders and cotton producing farmers were weak. Among total sampled traders 96.15% share information about producer price only. Furthermore, 92.3% of traders not collaborate with each other. This indicates that information sharing as well as collaboration among cotton traders in Arbaminch zuria district was weak. Thus, large HHI, information imperfection and presence of some barriers to entry let cotton market structure to be classifies as oligopoly market structure. Hence, cotton market in Arbaminch zuria district deviated from competitive market norms.
Market conduct refers to the patterns of behavior that traders and other market participants adopt to affect or adjust to the markets in which they sell or buy. These include price setting behavior, and buying and selling practices, weighing and trust among seller and buyers. Cotton producing farmers reported that price for cotton was determined by traders while 100% sampled traders reported that they encountered problems in cotton marketing and 92.3% of sampled traders reported that cotton producer farmers supply quality deteriorated cotton to the market. Researcher field observation indicated that there was cheating among cotton producer farmers and traders. Farmers adulterate cotton with stones and soil and bring watered cotton to market to weigh high, while traders cheat farmers when they weigh cotton. These acts indicate that cotton marketing conduct in Arbaminch zuria district was not well enough.
Cotton marketing performance was measured in marketing margin and market efficiency. Total gross margin added to cotton price when it passes through the marketing system was 81.62%. The farmer’s share of the price to end user was 20.59%. Local collectors receive smaller percentage of profit (3.07%). However, wholesalers received relatively larger percentage of profit (53.38%). Among Arbaminch zuria district cotton marketing participants’ only wholesalers and retailers cotton marketing show presence of excess profit, which was 220.8% and 133.33% respectively. However, smallholder cotton producer farmers, local collectors and Textile Company were considered inefficient because their market efficiency was below 100%. Among twelve variables included in multiple linear regression, six variables, namely; cotton farming experience, land allocated to cotton in hectare, use of improved seed, and current year cotton price were found to be significant at 1% significance level. Also, number of extensions contact and distance to nearest market were found to be significant at 5% significance level.
Recommendation
Based on result of this study, the following recommendations were made.
a. Agricultural offices, universities and research institutions should pay attention for provision of improved, high yielding and diseases resistant cotton varieties
b. Agricultural offices should create awareness among farmers to allocate appropriate land for cotton and to produce cotton in irrigation as of other cash crops.
c. National and regional governments may pay attention for strengthen the existing textile factories to he help them to absorb quantities of cotton produced by cotton producer farmers.
d. District, Zonal and Regional Agriculture and natural resource offices, trade and industry offices should work for the regulation and implementation of cotton price tariffs and production related polices.
e. District and Zonal Cooperative offices and trade office should frequently monitor cotton marketing system of cotton producing districts and take corrective measures as early as possible because field observation and interview with chain actors shows that there was cheat between cotton producer farmers and traders.
f. Zonal and District Agriculture and Natural resource offices should strengthen provision of sustainable and knowledgebased extension service because increase in one extension contact increases quantity cotton supplied.
References
- EDRI (Ethiopian Development Research Institute) (2015) Institutional Assessment of the Cotton and Sugarcane Commodities in Ethiopia: The climate change perspective. Addis Ababa, Ethiopia.
- EIA (Ethiopian Investment Agency) (2012) Investment Opportunity Profile for Cotton Production and Ginning in Ethiopia. Addis Ababa, Ethiopia.
- Bosena Tegegne, Fikadu Bekabil, Berhanu G, Dirk H (2011) Factors Affecting Cotton Supply at the Farm Level in Metema District of Ethiopia. Journal of Agriculture Biotechnology & Ecology 4(1): 41-51.
- MoANR (Ministry of Agriculture and Natural Resource) (2004) Market Oriented Development Master Plan for Cotton in Ethiopia. Addis Ababa, Ethiopia.
- Bosena Tegegne (2008) Cotton market chain analysis: the case of Metema Woreda, North Gondar Zone, Amhara National Regional State. MSc Thesis, Haramaya University, Haramaya, Ethiopia. p. 110.
- PAN Ethiopia (Pest Action Network) (2014) Cotton farmers do better with IPM in Arbaminch, Ethiopia. Research report submitted to Alliance for Food Sovereignty in Africa.
- Yamane Taro (1967) Statistics: An Introductory Analysis, (2nd edn), New York: Harper and Row.
- Meryem Kuru (2013) Analysis of Cow Milk Market Chain: The case of Sululta District, Oromia Special Zone. MSc Thesis, Haramaya University, Haramaya, Ethiopia.
- Wisdom Madede Nzima, Joseph Dzanja, Bonnet Kamwan (2014) Structure, Conduct and Performance of Groundnuts Markets in Northern and Central Malawi: Case Studies of Mzimba and Kasungu Districts. International Journal of Business and Social Science 5(6): 130-139.
- Mendoza (1995) A primer on marketing channels and margins.
- Osougwu (2002) Economic Analysis of Rice Marketing Margin among participants in the marketing channel of rice in Adani in Uzo Uwani Local Government Area.
- Gujarati (2003) Essentials of econometrics.
- Islam MS, Miah TH, Haque MM (2001) Marketing System of Marine Fish in Bangladesh: An Empirical Study. Bangladesh J Agric Econs 1(2): 127- 142.
- Harriss B (1993) Measuring Agricultural Performance in Agricultural and Food Marketing in Developing Countries. Trowbridge Wittshire: Redwood Book Limited.
- Naldi M, Flamini M (2014) The CR4 index and the interval estimation of the Herfindah Hirschmann index: An empirical comparison. SSRN, p. 11.
- Cubero Ana Rosado (2010) Barriers to competition: the evolution of the debate, London Peckering and Chatto. p. 1-2.
- Adegeye A, Dittoh J (1985) Essentials of Agricultural Economic. Impact Publisher, Ibadan, Nigeria Ltd. pp. 164-177.
- Jema (2008) Economic efficiency and marketing performance of vegetable production in the eastern and central parts of Ethiopia.
- Osondu K, Nwadike FC, Ijioma JC, Udah SC, Ugboaja CI (2014) Marketing Performance of Salad Vegetables: The Case of Cabbage Marketing in Abia State, Nigeria. International Journal of Agricultural Science, Research and Technology in Extension and Education Systems 4(3): 151-162.
- Scarborough V, Kydd J (1992) Economic Analysis of Agricultural Markets. A Manual of Marketing Series 5, Chatham, UK: Natural Resource Institute.
- Merima Abudullahi, Gezahegn Ayele (2008) Agri-Chain Analysis of Cotton Sub-Sector in Ethiopia. Research Report Submitted to Ethiopian Development Research Institute Addis Abeba, Ethiopia.
- Beza Erko (2014) Maize and Faba Bean Value Chains: The Case of BakoTibe and Gobu Seyo Districts in Central Western Ethiopia. MSc Thesis, Haramaya University, Haramaya, Ethiopia.
- Addisu Hailu (2016) Value Chain Analysis of Vegetables: The Case of Ejere District, West Shoa Zone, Oromia National Regional State of Ethiopia. Haramaya University, Haramaya, Ethiopia.
- Alemayehu Asale (2012) Analysis of Production and Market Channel of Ginger: The Case of Boloso Bombe and Kindo Koisha Woredas of Wolaita Zone. Haramaya University, Haramaya, Ethiopia.
- Alemnew Abay (2010) Market Chain Analysis of Red Pepper: The Case of Bure Woreda, West Gojjam Zone, Amhara National Regional State, Ethiopia. MSc Thesis, Haramaya University, Haramaya, Ethiopia.
- Mebrat Tola (2014) Tomato Value Chain Analysis in the Central Rift Valley: The Case of Dugda Woreda, East Shoa Zone, Oromia National Regional State, Ethiopia. MSc Thesis, Haramaya University, Haramaya, Ethiopia.
- Wendmagegn Belete (2014) Market Chain Analysis of Coffee in Dale District of Southern Ethiopia. MSc Thesis, Haramaya University, Haramaya, Ethiopia.
- Ayelech Tadesse (2011) Market Chain Analysis of Fruits for Gomma Woreda, Jimma Zone, Oromia Regional State. MSc Thesis, Haramaya University, Haramaya, Ethiopia.
- Mohammed D, David Asamoah, Felicity Asiedu-Appiah (2011) Cocoa Value Chain-Implication for the Smallholder Farmer in Ghana. pp. 1041-1049.
- Bizualem Assefa, Degye Goshu, Zekarias Shumeta (2015) Analysis of marketed Surplus of Coffee by Smallholder Farmers in Jimma Zone, Ethiopia. Journal of Biology Agriculture and Healthcare 5(5): 242-251.
- Yimer Ayalew (2015) Factors Affecting Fruit Supply in The Market: The Case of Habru Woerda, North Wollo, Ethiopia Regional State, Ethiopia. Journal of Marketing and consumer Research 7: 35-44.


