


The Relationship between Yield Parameters and Morphological Characters for Barley: Evaluating linear and Non-linear models
Ahmed H Abdullah1 Hail Z Rihan2*
1Department of agriculture Economy, Damascus University, Syria
2School of Biological and Marine Sciences, Plymouth University, UK
Submission: January 15, 2018; Published: February 15, 2018
*Corresponding author: Hail Rihan, School of Biological and Marine Sciences, Plymouth University, UK, Email: hail.rihan@plymouth.ac.uk
How to cite this article: Abdullah H A , Rihan H Z. The Relationship between Yield Parameters and Morphological Characters for Barley: Evaluating linear and Non-linear models. Agri Res & Tech: Open Access J. 2018; 14(1): 555907.DOI:10.19080/ARTOAJ.2018.14.555907
Abstract
The best statistical model (linear or non-linear) for use in the study of the relationship between yield parameters and morphological characters of barley was investigated. It was confirmed that Non-linear model (Exponential regression analysis) is better than linear for studying the relationship between yield parameters and morphological characters, because the determination coefficient for non-linear model was higher than the determination coefficient for linear model. Moreover, the residual distributions for non-linear equation were much better than the residual distributions for linear equation.
A relationship between leafiness and yield parameters was not shown by both linear and non-linear models, while analysis of variance (ANOVA) indicated a positive significant difference in yield according to levels of leafiness. Consequently, yield parameters had been affected by morphological characters. The non-linear model for the study of the relationship is suitable for forecasting yield.
Keywords: Barley breeding; Exponential; Linear; Multiple regression analysis
Introduction
Barley is the fourth world's cereal production after wheat, rice and maize. It is the second most important cereal crops in Syria after wheat. It is one of the most suitable cereal crops, which can survive and grow over a wide range of soils and under many adverse climatic conditions compared with many other cereal crops [1].
Multiple regression analysis is frequently used to study the effect of sets of independent variables, X, on one variable Y [2]. Multiple linear regression has been employed in agricultural research. For example, in 1990, Lungu [3] applied multiple linear regression to wheat in order to study the intra- and intergenerational relationship among yield components and characteristics. He suggested that 1000-kernel weight, grain yield per plant and number of tillers per plant (in that order) were the most significant variables affecting yield.
Many agronomic barley experiments employed multiple linear regression analysis, and most of them used this kind of analysis to increase barley yield. For example, multiple linear regression has been used to identify climatic factors effecting barley yield [1]. The latter studied the effects of weather on grain yield over a 15-year period. Multiple linear regression analysis was also used to predict cadmium concentrations and PH in barley grain by testing soil properties [2].
Multiple regression has been compared with an artificial neural network model. For example, in 2011, Zaefizadeh compared multiple linear regressions (MLR) and artificial neural networks (ANN) in predicting barley yield. They found that the neural network for estimating barley genotypes yield was more effective than a regression approach, because the degree of error in multiple linear regression model was greater than in the artificial neural network [3]. Also, multivariate regression and artificial neural network have been used to predict barley production from soil characteristics in northern Iran [4]. The latter indicated that artificial neural network is a more powerful tool than multivariate regression for the prediction of the biomass and grain yield of barley from soil properties. In 2013, Paswan and Begum used regression and neural network models for the prediction of crop production. Paswan and Begum found that neural network models were more powerful than linear regression for data analysis. However, they found there was an overlap between the two fields and there were several models that could be used by neural networks [5].
Multiple linear regression analysis was applied to barley data in Egypt to identify and qualify the relationship between grain yield and morphological characters [6]. He found that the grain yield strongly and positively correlated with grain numbers per spike, grain weight/spike, 1000-grain weight, number of spikes per square meter and spike length.
In 2015, Dorostkar et al. [7] studied the relationship between grain yield and yield components, using multivariate analysis in barley cultivars. They used correlation coefficient, regression and path analysis for the analysis of data. It was found that path analysis was the best model for showing the relationship between grain yield and yield components. These models of analysis showed that the spikes per square metre had a negative correlation with kernels per spike, kernel weight and the effects of spikes per square metre. Kernel weight of grain yield was significantly different.
Multiple linear regression analysis indicated that the parameters of high water, nutrients and ecotype plant size significantly affected plant fitness, whether estimated by reproductive biomass or by yield [8].
Multiple linear regression analysis was compared to variate models of multivariate analysis to characterize spring barley accessions. According to multiple regression analysis, 72.8% of the variance in germplasm was to be explained by plant height, lodging and grain yield [9].
Multiple non-linear regression analysis has also been used by scientists to decide whether there are relationships between variables. Some of them found linear regression analysis not to be useful and sought alternative equations. For example, nonlinear regression analysis has been used to study the relationship between leaf appearance rate (LAR) and temperature in wheat trials [10]. They found that a non- linear model is better than a linear model for ascertaining the extent to which the leaf appearance has been affected by the lower root.
The ultimate goal of this research is located in two points:
a. To choose the optimal model for studying the relationship between yield parameters and morphological characters.
b. To indicate the most important morphological characters variables affected yield parameters.
Materials and Methods
Materials
Two field experiments were carried out at the experimental stations (Tel Hadya and Breda, Syria). There were 306 observations in each area (three hybrids each hybrid 102 observations). The experiments were designed as a randomized block design, with two replicates in Tel Hadya and Breda. Seed rate was 100 (kg ha-1). Plants were fertilized according to the commercial practice.
Data are divided into two sets, morphological characters and yield parameters:
Morphological characters
Plant height was estimated by taking the mean of three random samples from each experimental plot.
Leafiness was recorded as a five point scores estimated by eye at ear emergence.
Score 1: very low leafiness.
Score 2: low.
Score 3: medium.
Score 4: high.
Score 5: very high.
Vegetative duration was the number of days from germination until 50% ear emergence.
Length of growing season was the number of days from germination to harvest.
Yield parameters
A. Total plant yield: a two metre plot length of barley was harvested from each experimental plot after removing the border rows. Total plant yield was recorded and expressed as kg ha-1.
B. Grain and straw yields were measured after mechanically separating grain from straw expressed as kg ha1.
Statistical methods
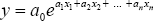
The multiple regression equation is formulated as a linear model [11,12]:

The standard error of ai (SEai,i =12.........,p) is given by the equation [14]:
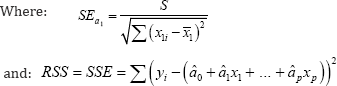
Each of the independent variables can be tested by the equation:

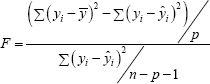
Subsequently, an f-test was used to study the significance of these equations [21,22]
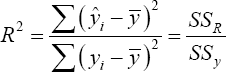
The coefficient of determination (r2 ) tells us how much of the variation in the dependent variable y is explained by the equation according to independent variables. It is given by Tabachnick & Fidell [15]:
does not indicate the significance of the regression Kollo & Rosen [16].
The residual are expected to be normally distributed ~ N(0,σ2). Residual plots use standardized and studentized residuals. Studentized residuals are used to find the outlier. It is given by:
Where, hii the diagonal element of the hat matrix H. <
Results
Total plant yield
Multiple regression analysis (linear and exponential) was used to study the relationship between total plant yield as dependent variables (y) and morphological characters (vegetative duration χ1 , plant height χ2 , length of growing season χ3 and leafiness χ4) as independent variables.he linear and exponential results are summarized in Table 1.

P<0.001***, P<0.01**, P<0.05*
According to Table 1, the equations were:
Linear: y = 26021.034 + 124.578χ1 + 111.159χ2 + 104.660χ3 -141.505χ4
Exponential:y = 19.202e0.027 x1+0. 021x2+0. 014x3+0. 008 x4
There were significant multiple correlations (linear: 0.802*** and exponential: 0.847***) between total plant yield and morphological characters. The regression coefficients for vegetative duration, plant height, length of growing season and leafiness were significant P<0.05 (linear and exponential; Table 1). 64% and 72% of the variation in the total plant yield is explained by the linear equation and exponential equation respectively. Figure 1 showed that the residual distribution for the exponential and linear equations.

Grain yield
The results for multiple regression analysis (linear and exponential) for the relationship between grain yield and morphological characters are summarized in Table 2. The regression equations are:
Linear: y = -13621.04 + 69.048x1 + 45.651x2 + 56.388x3 - 104.064x4
Exponential: y = 19.202e0.0301 x1+0. 0179x2+0.0144 x3+0. 0038 x4
Multiple regression analysis (linear, exponential) showed that grain yield was affected positively and significantly (P<0.05) by morphological characters except leafiness. The regression coefficient were significates (P<0.05) except leafiness (P=0.32>0.05; Table 2). The determination coefficients were 58.8% and 67.71% for linear and exponential equations respectively. Figure 2 showed the residuals distribution for exponential and linear equations.


P<0.001***, P<0.01**, P<0.05*.
Straw yield

P<0.001***, P<0.01**, P<0.05*.

The relationship between straw yield and morphological characters was computed by using multiple regression analysis, as summarized in Table 3. The regression equations are:
Linear: y = —12401 + 65.501x1 + 55.500x2 + 48.303x3 -31.5x4
Exponential: y =12.81e 0.0235x1+0.0235x2+0.0125x3+0.0210x4
There were a significant relationship (linear and exponential) between straw yield and morphological characters (P<0.05). 64.5% and 71% of the variation in the total plant yield is explained by the linear equation and exponential equation respectively Figure 3 showed the residuals distribution for exponential and linear equations.
Discussion
Discussion The relationship between total plant yield and morphological characters
The morphological character variables, except leafiness, were highly correlated (positively) with total plant yield (Table 1). These results agree with those of Zakova and Benkova [9]. Thus, regression analysis showed that total plant yield was not affected by leafiness, while analysis of variance (ANOVA) indicated that total plant yield had been affected by leafiness (F= 11.124; P<0.05) and the mean total plant yield at leafiness levels 4.5 and 5 were the best . When comparing models with the same number of parameters, the model with the highest significant determination coefficient (r2 ) should be selected [17]. Thus, 72% of the variation in the total plant yield is explained by the exponential equation, while 64% of variation was explained by the linear equation. Figure 1 showed that the residual distribution for the exponential equation was much better distributed than the linear equation. In the linear equation, there were forty-two points (612 points) that were more than two standardised residuals away from the expected value, but in the exponential equation, there were only thirty-two points that were more than two standardised residuals away from the expected value (according to studentized residuals ri ).
In conclusion, the total plant yield was strongly and significantly affected by plant height, vegetative duration and length of growing season respectively. Multiple linear regression did not show how much total plant yield had been affected by leafiness. The exponential equation was better than the linear equation for studying the relationship between total plant yield and morphological characters in barley breeding trials.
The relationship between grain yield and morphological characters
The grain yield was significantly affected by morphological characters except leafiness, while analysis of variance test (ANOVA) showed that grain yield was affected by leafiness (F= 9.016; P<0.05). The least significant deference test (LSD) showed that the best grain yield was with levels of leafiness 4, 4.5 and 5. these results agree with Ohlander L, et al. [18]. Multiple regression analysis did not show this result because there were no significant differences for grain yield between levels of leafiness 2, 2.5, 3 and 3.5. Also there were no significant difference in grain yield by the levels of leafiness 4, 4.5, 5. Thus, the grain yield had two levels according to leafiness, the first one with level 2, 2.5, 3 and 3.5 and the second level of grain yield was with level of leafiness 4, 4.5 and 5 These results agree with those of Zakova & Benkova [9]. Grain yield was affected by vegetative duration slightly more than by plant height, because the simple correlation between vegetative duration and grain yield (R=0.74; P<0.01) was higher than the simple correlation between grain yield and plant height (R=0.72; P<0.01). According to Table 2, the multiple regression in the linear and exponential models with coefficients of determination (R2) value 58.8 and 67.71, 59 respectively were significantly acceptable for studying the relationship between grain yield and morphological characters. The coefficient of determination was close to a maximum of R2% = 68 for exponential regression and R2% = 59 for linear regression. The coefficient of determination for exponential regressions were higher than the coefficient of determination for linear regression. Figure 2 showed that, the residuals distribution for exponential equation was much better than the residuals distribution for linear equation. Also, according to studentized residuals r , Forty-two points (612 observations) were more than two standardised residuals away from the expected value for linear equations, while in the exponential equation there were thirty-eight points only (Figure 2). In conclusion, the grain yield was significantly affected by morphological characters. The determination coefficient and the distribution of the residuals indicated that the exponential equation were better than the linear equation for studying the relationship between grain yield and morphological characters.
The relationship between strawyield and morphological characters:
Plant height had the greatest influence on straw yield. Vegetative duration was the second independent variable that affected the straw yield. Vegetative duration and length of growing season increased the determination coefficient to 64% (increased nearly 3.5%) for linear equation and 71% (increased nearly 4.5%) for exponential equation. Regression analysis showed that, Straw yield was positively and significantly affected by morphological characters, except leafiness (P =0.22>0.05). However, ANOVA test showed that, straw yield was affected positively by leafiness (F= 12.310; P<0.05) Ohlander L, et al. [18].
The non-linear (exponential) equation was better than the linear equation for describing the relationship between straw yield and morphological characters Zakova & Benkova [9], because the determination coefficient for exponential (72%) was higher than the determination coefficient for linear (64%; Table 3). Plant height had the greatest influence on straw yield, which explained 60.55% (R2% = 60.55%, P < 0.05) of the variation for linear equation and explained 66.54% (R 2% = 66.54%, p < 0.05) for exponential equation. These results agree with Capper et al. [19]. The residuals distribution for exponential relationship was better than linear (Figure 3). Studentized residuals indicated that there were thirty-eight points that were more than two standardised residuals away from the expected value for equations (linear and exponential). In conclusion, there was a significant relationship between straw yield and morphological characters. Exponential equation was better than linear equation for studying the relationship between straw yield and morphological characters.
Conclusion
Multiple regression analysis (linear and non-linear) indicated that there was a significant and positively relationship between yield parameters and morphological characters except leafiness. According to analysis of variance, it can be seen that yield parameters were affected by leafiness, but these relationships were not significant when multiple regression analysis was used.
Non-linear equations (exponential equations) were better than linear equations for studying the relationship between yield parameters and morphological characters, because the determination coefficients in exponential equations were higher than the determination coefficients in linear equations. The residuals distribution for exponential equations were better than the residuals distribution for linear equations. The outlier points in exponential equations was less than the outlier points in linear equations. Consequently, the exponential equations for the study of the relationship between yield parameters and morphological characters are more suitable for forecasting yield than linear equations.
Acknowledgment
The authors acknowledge the provision of a PhD grant from the University of Damascus, Syria. The author also gratefully acknowledges a Fellowship grant from CARA (the Council for At- Risk Academics).
References
- Sharratt BS, Knight CW, Wooding F (2003) Climatic impact on small grain production in the subarctic region of the United States. ARCTIC 56(3): 219-226.
- Adams ML, Zhao FJ, McGrath SP, Nicholson FA, Chambers BJ (2004) Predicting Cadmium Concentrations in Wheat and Barley Grain Using Soil Properties. Journal of Environmental Quality 33(2): 532-541.
- Zaefizadeh M, Khayatnezhad M, Gholamin R (2011) Comparison of Multiple Linear Regressions (MLR) and Artificial Neural Network (ANN) in Predicting the Yield Using its Components in the Hulless Barley. American-Eurasian J Agric & Environ Sci 10(1): 60-64.
- Shamsollah A, Kanwar LS (2011) Comparing multivariate regression and artificial neural network to predict barley production from soil characteristics in northern Iran. Archives of Agronomy and Soil Science 57(5): 549-565.
- Paswan RP, Begum SA (2013) Regression and Neural Networks Models for Prediction of Crop Production. International Journal of Scientific & Engineering Research 4(9): 98-108.
- Abd El-Mohsen A (2013) Correlation and regression analysis in barley Scientific Research and Review Journal 1(3): 88-100.
- Dorostkar S, Pakniyat H, Kordshooli M, Aliakbari M, Sobhanian N, et al. (2015) Study of relationship between grain yield and yield components using multivariate analysis in barley cultivars (Hordeum vulgare L.). International Journal of Agronomy and Agricultural Research (IJAAR) 6: 240-250.
- Volis S, Mendlinger S, Ward D (2002) Differentiation along a gradient of environmental productivity and predictability in populations of Hordeum spontaneum Koch: multilevel selection analysis. Biological Journal of the Linnean Society 75(3): 313-318.
- Zakova M, Benkova M (2006) Characterization of spring barley accessions based on multivariate analysis. Communications in Biometry and Crop Science 1(2): 124-134.
- Xue QW, Weiss A, Baenziger PS (2004) Predicting leaf appearance in field-grown winter wheat: evaluating linear and non-linear models. Ecological Modelling 175: 261-270.
- Hair JF (2005) Multivariate data analysis. NJ xxiv, Prentice Hall International.
- Dillon WR, Goldstein M (1984) Multivariate analysis: methods and applications. John Wiley and sons, UK.
- Chatterjee S, Price B (1991) Regression analysis by example. (5th edn), John Wiley and sons, UK.
- Eddison J (2000) Quantitative investigations in the biosciences using Minitab. Chapman & Hall, USA.
- Tabachnick BG, Fidell LS (2001) Using multivariate statistics. Pearson, USA.
- Kollo T, Rosen D (2005) Advanced Multivariate Statistics with Matrices. Springer, Netherlands.
- Broersen PMT (1986) Subset regression with stepwise directed search. Applied Statistics 35(2): 168-177.
- Ohlander L, Bergkvist G, Stendahl F, Kvist M (1996) Yield of Catch Crops and Spring Barley as Affected by Time of Under sowing. Journal of Agriculturae Scandinavica, Section B-Soil & Plant Science 46(3): 161168.
- Capper BS, Thomson EF, Herbert F (1988) Genetic variation in the feeding value of barley and wheat straw. Plant Breeding and the Nutritive Value of Crop Residues 1: 177-192.
- Aiken LS, West SG (1991) Multiple Regression: testing and interpreting interactions. Sage, Arizona State University, USA.
- Allison PD (1999) Multiple Regression: A Primer (Research Methods and Statistics). (1st edn), Pine Forge Press, London, UK.
- Jeffrey M (2001) Galton, Pearson, and the Peas: A Brief History of Linear Regression for Statistics Instructors. Journal of Statistics Education 9(3).
- Lungu DM, Kaltsikes PJ, Larter EN (1990) Intra- and intergeneration relationships among yield, its components and other related characteristics in spring wheat. Euphytica 1: 641-658.
- Naesah G (1996) Inhalants of quality characters of three barley hybrids. Aleppo University, Syria.


