


Scale-up and Optimization of Natural Product Fermentation Processes using Mass-Guided Metabolite Fingerprinting
James A Zahn*
DuPont Industrial Biosciences and DuPont Tate & Lyle Bio Products, USA
Submission: March 28, 2017; Published: May 24, 2017
*Corresponding author: James Zahn, DuPont Industrial Biosciences, 198 Blair Bend Drive, Loudon, TN 37774, USA, Tel: (865) 408-1962; Email: james.a.zahn@dupont.com
How to cite this article: James A Zahn. Scale-up and Optimization of Natural Product Fermentation Processes using Mass-Guided Metabolite Fingerprinting. Adv Biotech & Micro. 2017; 3(3): 555614.DOI: 10.19080/AIBM.2017.03.555614
Abstract
This study describes a metabolite fingerprinting method employing liquid chromatography-electrospray ionization mass spectrometry (LC-MS) and similarity algorithms to identify growth conditions that support equivalent secondary metabolite production from actinomycetes during fermentation scale-up processes. Validation of the metabolite fingerprinting method was completed by comparing this method to a traditional fermentation optimization approach using a single natural product biomarker from a known producing microorganism-tylosin production from Streptomyces fradiae(ATCC 19609). Fermentations were completed in a custom high-throughput microscale fermentation system (5-30ml working volume range) ora 2.5L nominal volume Tunair flask (260-1100ml working volume range), and fermentation volume and shaker speed was varied to explore the response-surface for tylosin production, or chemical similarity [Julian et al., 1998, Anal. Chem, 70:3249] using DOE methodology. Isoresponse contour plots for the combined effect of agitation speed and culture volume on tylosin production or chemical similarity identified conditions that generatedboth equivalenttylosin production (800mg*L-1) and chemical similarity (0.76 relative similarity units) for the fermentation scale-up process. These conditions were then further evaluated for their ability to support equivalent metabolite output for forty-four uncharacterized actinomycetes from a natural product library, using the optimized scale-up conditions. A bimodal distribution of chemical similarity scores was observed for the actinomycete population, with approximately 31% producing equivalent chemical output, and a majority (69%) producing non-equivalent output. These results show that the LC-MS metabolite fingerprinting technique can be successfully applied for optimization of growth conditions to achieve equivalent output natural product fermentations during scale-up processes.
Keywords: Mass spectrometry; Natural products; Secondary metabolites
Abbreviations: LC-MS: Liquid chromatography-Electrospray-Ionization Mass Spectrometry; ELSD : Evaporative Light Scattering Detector; RSU: Relative Chemical Similarity Unit
Introduction
Microbial secondary metabolites represent a rich, chemically-diverse source of bioactive compounds that have been exploited for applications in human medicine, agriculture, and industry [1-3]. Natural product fermentation bioprocesses have remained an important tool in efforts to acquire chemical diversity in bioactive compound libraries for lead generation [4]. In recent years, natural product discovery groups have become increasingly focused on optimization of scale-up processes to successfully re-supply target-directed biological assays, and subsequent structural elucidation efforts to structurally-characterize bioactive compounds [3,5]. Changes in this workflow have been driven by wide scale adoption of miniaturized high-throughput screening technology (HTS) that has significantly reduced the sample volume that is available for parallel discovery efforts, and has increased the difficulty in achieving equivalent chemical output of bioactive metabolites during scale-up fermentation processes [6,7]. Fermentation systems supporting HTS screening efforts have subsequently been miniaturized (0.1-10mL) into formats that have enhanced their compatibility with the liquid handling and microfludic components, and have dramatically enhanced total throughput of discovery processes [8-10]. Once novel bioactive compounds have been identified using HTS approaches, the producing microorganism is transferred to larger volume fermentation systems (0.1-100L) for production of larger quantities of the bioactive material in order to support further testing, or compound purification and structural elucidation efforts [11]. The inability to achieve sufficient and reproducible quantities of bioactive compounds from natural production fermentations during this multi-step fermentation process is an obstacle that has limited natural product discovery efforts.
Feedback on the expression of secondary metabolites comes from two types of analyses, biological and chemical [12,13]. Because chemical properties of bioactive compounds remain unknown during screening and secondary supply efforts, consistency in the production of secondary metabolites from fermentation processes is dependent upon HTS or indirect measures of fermentation performance. However, due to the many vagaries of biological assays, namely that activity is not always proportional to concentration and activity is subject to many chemical interferences in natural product extracts, secondary supply efforts also may rely on measurements of growth, including concentration of biomass, protein, deoxyribonucleic acid, uptake of oxygen, or evolution of carbon dioxide, as a means to achieve reproducible production of secondary metabolites from microorganisms. An assumption with this approach is that the production of secondary metabolites can be related to indirect biological or physical measurements in the producing microorganism or the fermentation system. While many models have been developed for predicting expression behavior of secondary metabolites from a few well characterized microorganisms, these indirect approaches are generally not suitable for predicting secondary metabolite production from the uncharacterized microorganisms that are typically screened in natural product discovery programs. Additionally, indirect methods provide information indirect to the ultimate objective, which is to achieve identical secondary metabolite expression profiles from microorganisms cultivated in different fermentation systems.
Recently, a method to directly measure chemical similarity between natural product extracts was developed by Julian et al. [14] using high-performance liquid chromatography-mass spectrometry (LC-MS) and bioinformatics tools that used novel similarity algorithms. This approach used similarity algorithms to compare metabolite fingerprints from natural product extracts that were based on the liquid chromatographic retention and the mass-to-charge ratio of compounds detected by positive-ion LC- MS [15,16]. This method was unique in that the overall chemical similarity of fungal and actinomycete extracts could be compared for large numbers of samples without prior knowledge of the chemical properties of secondary metabolites in the samples. In this study, chemical similarity measurements are applied to the more difficult problem of establishing fermentation conditions that provide equivalent chemical output from actinomycetes that were cultivated in two types of fermentation systems. The goals of this study were to define the fermentation volume and agitation conditions that support equivalent chemical output from high-throughput microscale fermentation and large-scale fermentation of Streptomyces fradiae, and secondly, to test whether these optimized conditions could support equivalent secondary metabolite production for scale-up fermentations of an uncharacterized population of actinomycetes that were part of a natural product library.
Materials and Methods
Bacterial strains and cultivation
Vegetative cultures of S. fradiae ATCC 19609 were started from cryogenic stocks (~90°K) in a vegetative medium (CSM), consisting of tryptic soy broth (30g/l; Difco, Detroit, MI), yeast extract (3g/l; Sigma, St. Louis, MO), MgSO4 (2g/l), glucose (5g/l), and maltose (4g/l). At mid-log phase, a 0.2% inoculum of the vegetative culture was transferred into a complex growth medium, referred to as medium G, which contained glucose (10g/l), potato dextrin (40g/l; Avedex, Keokuk, IA), cane molasses (15g/l; Cargill, Minneapolis, MN), Hy-case amino (10g/l; Sheffield Products, Norwich, NY), MgSO4 (1g/l), and CaCO3 (2g/l). The effect of phosphate and ammonium on expression of tylosin and on chemical similarity was evaluated in small shake- flask fermentations (12 ml final volume) by the addition of dibasic sodium phosphate (Na2HPO4), or ammonium chloride (NH4Cl) to the complex growth medium, prior to autoclaving, at a final concentration of 0.5mM. The pH of all fermentation media was adjusted to pH 7.2 with 0.1M HCl or KOH before autoclaving and was assayed for proper pH before inoculation. High-throughput microscale (working volume range 5-30ml) or larger (working volume range 260-1100ml) Tunairshake-flask fermentations were incubated at 30 °C for 7 days on orbital shakers (2-inch throw) under the agitation rates and volumes described in the text. Fermentation vessels employed in the experiments consisted of a custom high-throughput microscale bottle (rectangular Axid ◊bottles; Eli Lilly and Co., Indianapolis, IN) that were molded of polypropylene and measured approximately 3.5cm in lengthx4.25cm in widthx6cm in height. The individual bottles were locked in a rack for loading on the orbital shaker. The larger shake flask fermentations were completed using a 2.5L nominal volume cylindrical Tunair □ (Dot Scientific, Inc., Burton, MI) flask that was molded of polypropylene. The enclosure for small shake-flask fermentation bottles consisted of a γ-irradiated geotextile membrane (~ 0.2 μim porosity) and the enclosure for large shake-flask fermentation vessels consisted of two layers of Bio-Shield regular sterilization wrap (Baxter, Deerfield, IL) that were fixed over the orifice of the vessel with rubber bands.
Response surface experiments for analysis of the combined effects ofvolume and agitation speed on volumetric concentration of tylosin and total chemical similarity of fermentation extracts were designed using JMP statistical software (SAS Institute, Cary, NC). All response surface experiments were performed in triplicate using central composite orthogonal design. The following conditions were used for the high-throughput microscale shake-flask fermentations: 5ml volume at 110, 110, 125 and 150rpm; 13ml volume at 75, 110, 125 and 150rpm; 10ml volume at 75, 100, 110, 125 and 150rpm; 20ml volume at 75, 110 and 125 rpm; and 30ml volume at 75, 100 and 125rpm. The following conditions were used for the larger Tunairshake- flask fermentations: 260 ml volume at 225rpm; 300ml volume at 177, 190 and 250rpm; 600ml volume at 177, 190, 220, and 250 rpm; 800ml volume at 177, 220, and 250rpm; 900ml volume at 177, 190, 220 and 250rpm; and 1100ml at 177, 190, 220 and 250rpm.
Forty-four actinomycetes were isolated from central Indiana soil samples using the method of Arronson, 1970. Classification of the isolates as actinomycetes was based on the presence of aerial mycelia with chains of nonmotile conidia, sequence analysis of the full-length 16S rDNA, and the presence of 2,6-diaminopimelic acid in whole cell lysates. Pure cultures were transferred from tryptic soy agar plates into CSM vegetative medium and grown until late log phase at 30°C. At late log phase, a 0.2% inoculum was transferred from the vegetative culture into 5 ml of the fermentation medium for high-throughput microscale fermentations or 260ml of the fermentation medium for Tunair fermentations. Small and large fermentations were incubated at 30 °C for 7 days on orbital shakers (2-inch throw) at 125rpm and 225rpm, respectively. Contamination was assessed at termination of the fermentation period by plating fermentation liquid on tryptic soy agar (Difco, Detroit, MI). Culture purity was assessed after a 2 day of incubation period that was completed at 30 0C, and contaminated fermentations (containing more than one microorganism) were discarded. The rate of contamination for fermentations completed in this study was less than 0.8%.
Dry Cell weight, protein, and DNA concentration
Dry cell weight was determined on 6ml fermentation samples in pre-weighed aluminum weighing dishes after drying under vacuum at 70°C for 30 hours. Protein and DNA concentrations were determined on the particulate fraction (3,000xg) from 12ml fermentation samples by digesting cell material under alkaline-heat treatment. Centrifuged material was resuspended in 10ml of 60mM KOH and boiled in aluminum weighing dishes to near dryness (<5min). Digested samples were rinsed into a glass Dounce homogenizer with a minimal volume of dH2O, and then thoroughly homogenized. The homogenized material was resuspended in dH2O to a final volume of 12ml and assayed immediately for total protein and DNA. Protein concentration was determined by the method of Lowry et al. (1951) and DNA concentration was determined by spectrophotometric analysis on the ethanol/isopropanol precipitant using the Wizard genomic DNA purification kit (Cat.#A1120, Promega, Madison, WI).
Ethanolic extraction and analysis by liquid chromatography-mass spectrometry
Fermentation output was prepared for high-performance chromatography by solublization and extraction of secondary metabolites in submerged fermentations by addition of an equal volume of absolute ethanol into the fermentation vessels. The ethanolic mixture was agitated for 2hrs on an orbital shaker and then allowed to settle for 18hrs at 4°C. The ethanolic mixture was then filtered through a 100Äm filter and transferred to 96 well plates for chemical analysis.
Ethanolic extracts of cultures were filtered through 100μm polyproplene screen and transferred to 96 well plates for analysis by LC-MS as previously described previously by Julian et al. [14]. Briefly, ethanol-solublized analytes (50μl) were separated on a Novapak C18 analytical column (3.9x100mm) over a 30 minute linear gradient from 2% methanol plus 6.5mM ammonium acetate (pH 5.5) to 95% methanol plus 6.5mM ammonium acetate (pH 5.5) at a flow rate of 1ml min-1. The column effluent was split to a Finnigan Navigator mass spectrometer (160μl min' 1) equipped with a Finnigan electrospray source and to a Sedex 55 evaporative light scattering detector (840μl min-1) (ELSD; Alfortville, France). Ultraviolet and visible absorption spectra (190-550nm) were acquired with a Series 1100 Hewlett Packard photodiode array spectrophotometer on column effluent prior to analysis by evaporative light scattering. The electrospray source was switched between positive and negative ion mode in 0.5sec intervals to acquire both positive and negative ion spectra over a mass-to-charge ratio (m/z) range from 160 to 1600m/z. During data acquisition, the MS probe was maintained at 3.6 kV, cone voltage was maintained at 36V, the source temperature was held at 179°C, and drying gas flow was set at 505 1•hr-1. MS tuning was performed daily using m-cresol purple. Exactly 50 μl of a standard solution consisting of caffeine (Sigma, St. Louis, MO), m-cresol purple (Sigma, St. Louis, MO), spinosad (Dow AgroSciences, Indianapolis, IN), narasin A (Sigma, St. Louis, MO), and tylosin A (Eli Lilly & Co., Indianapolis, IN), each at a concentration of 100 μg/ml, was injected at the beginning, end, and then after every tenth experimental sample to assess instrument stability and performance. Chemical similarity indices were computed from the two-dimensional LC-MS contour plots (m/z by retention time) on a UNIX workstation using similarity algorithms previously described by Julian et al. [14]. Tylosin concentration was based on the ELSD integrated peak area for tylosin A (916.1g/mol) and tylosin D (918.1g/mol), which co-eluted at 18.1 minutes on the reverse-phase gradient.
Results and Discussion
Instrument and fermentation reproducibility
Instrument reproducibility was assessed by repeated injection of the standard solution. Analysis of the distribution for 91 pair wise similarity comparisons for 14 injections of the standard solution showed a normal distribution for data points with a mean of 0.78 relative chemical similarity units (rsu) and a standard deviation of 0.020rsu. This similarity coefficient value was similar to the value reported by Julian et al. [14] for repeated injections of a tylosin-containing extract. This value (0.78±0.020 rsu) represents the maximum chemical similarity that can be achieved for analysis of experimental samples.
The chemical similarity between individual fermentation extracts was assessed in 34 replicate shake flask fermentations (12mL working volume) of the tylosin-producing strain, S. fradiae using the same fermentation media, and conditions. The distribution of 561 pair wise similarity comparisons from the 34 individual fermentations of S. fradiae produced a sample mean of 0.77rsu and a standard deviation of 0.024rsu. Analysis of positive-ion contour plots for chromatographic retention versus mass-to-charge ratio (m/z) of fermentation samples showed that samples with rsu values near 0.77 had nearly indistinguishable m/z fingerprints (Figure 1), while comparison of extracts with low rsu scores had few similarities in m/z fingerprints (Figure 1). The sample mean for independent fermentations was slightly lower than the mean achieved for repeated injections of a single standard solution. An experiment employing eight individual fermentations of S. fradiae, grown in large shake-flask fermentation vessels achieved a sample mean and standard deviation (0.77±0.027) that was nearly identical to values achieved for small shake fermentation. This result indicated that the fermentation vessels supported reproducible growth and expression of secondary metabolites from S. fradiae.

Phosphate and ammonium have been shown to be potent, negative modulators of tylosin biosynthesis in S. fradiae. The effects of these nutrient amendments on tylosin biosynthesis and on chemical similarity measurements were investigated to establish sensitivity of chemical similarity measurements and to define response ranges for chemical similarity measurements. The addition of either Na2HPO4 or NH4Cl to submerged fermentations containing the basal medium resulted in significantly lower yields of tylosin and altered the level of chemical similarity that was achieved between treatment groups or between treatment groups and the control (Table 1). A pairwise comparison of the eight individual fermentations for each treatment group revealed that a high level of reproducibility was achieved between individual fermentations within each treatment group (Table 1). However, comparisons between treatment groups showed that major differences (p<0.05) had occurred in the chemical composition of these extracts. These differences could not directly be attributed to residual amounts of nutritional amendments (Na2HPO4 or NH4Cl), since neither phosphate nor ammonium contributed directly to the MS detector response (<160g/mol). Differences observed in chemical similarity measurements were attributed to the effects of phosphate or ammonium on expression of primary and secondary metabolites from S. fradiae.

Chemical similarity was computed for pairwise comparisons between the basal medium group and media treatment groups receiving 0.5mM ammonium chloride (NH4Cl) or 0.5 mM sodium phosphate, dibasic (Na2HPO4). Values represent the mean ± the standard deviation.
† = Data for tylosin yield are the averages from eight individual fermentations and are expressed as ±g tylosin/mg dry cell weight.
‡ = The average similarity for pairwise comparisons was computed from eight individual fermentations for each treatment.
Effect of the fermentation vessel on tylosin biosynthesis and chemical similarity
The introduction of NH4+ or PO4-3 into fermentation media repressed tylosin biosynthesis and significantly decreased the level of chemical similarity between the control and treatments. This observation provided evidence that chemical similarity measurements were responsive to physiological changes in S. fradiae and that chemical similarity could be used to measure generic chemical equivalence in actinomycetes grown in different fermentation systems. To test this hypothesis, a response-surface experiment was designed using a central composite-orthogonal design to define the combined effects of agitation speed and fermentation volume on tylosin biosynthesis and chemical similarity in small and large shake- flask fermentations of S. fradiae. The experiment consisted of 34 individual small shake-flask fermentations and 42 individual large shake-flask fermentations that were grown for 144 hours in the basal fermentation medium. The volumetric concentration of tylosin was fit with a response-surface model to determine the relationship between the agitation rate and fermentation volume for the two types of fermentation vessels. Results for the response-surface models are shown in Figure 1 as isobar contour plots of the volumetric concentration of tylosin.
The overall F-test comparing the response surface model to the mean model indicated that the response surface models were highly significant in explaining the observed variability in the response (p<0.0001 for small shake flasks and p=0.005 for large shake flasks). Analysis of contour plots for small and large shake-flask fermentations showed similar trends in production of tylosin over the range of agitation rates and fermentation volumes evaluated. The highest concentration of tylosin was achieved under conditions of low volume and high agitation for both small and large shake-flask fermentation vessels, while the lowest concentration of tylosin was achieved under high volume conditions.

The effect of fermentation conditions on the level of chemical similarity achieved between small and large shake- flask fermentations was investigated by comparing LC- MS fingerprints from four large shake-flask fermentation conditions to those acquired from 34 different small shake-flask fermentation conditions. This experimental design, referred to as the "scale-down" technique, was used because agitation rate and shaker capacity were limiting factors for large shake- flask fermentations, but were not limits to throughput for small shake-flask fermentations. Four large shake-flask fermentation conditions (260ml/225 rpm; 600ml/220 rpm; 800ml/250 rpm; 1024ml/220 rpm) were chosen as endpoints for fermentations based on the observation that these conditions provided the greatest range for volumetric concentration of tylosin (Figure 1). Response surface models were developed from the chemical similarity data to determine conditions of optimum chemical similarity between the small and large shake-flask vessels. A graphical representation for each of these four models (p<0.0001) is shown in Figure 2 as isobar contour plots of chemical similarity. Isobar patterns for chemical similarity measurements were highly similar to isobar patterns observed for volumetric concentration of tylosin (Figure 1). This result indicated that chemical equivalence measurements responded well to changes in tylosin concentration for S. fradiae.
For small shake-flask vessels, an agitation rate of 125rpm and a fermentation volume between 5ml and 12ml provided the highest chemical similarity for any of the four conditions evaluated (Figure 2). There was a lower level of chemical similarity achieved between small and large shake-flask fermentations when larger volumes were used in large shake- flask vessel. For example, chemical similarity contours ranged from 0.75 csu to 0.5 rsu for comparisons made between the 176ml/220rpm condition and the 34 small shake-flasks (Figure 2). The slope decreased across similarity contours as the fermentation volume increased in large shake flask vessels. Large volume fermentations achieved a lower range of chemical similarity values (Figure 2) and lower regression coefficients (r2) for response-surface models (data not shown). There was greater statistical uncertainty in obtaining chemical equivalence between small and large shake-flask fermentations when the volume of the large shake-flask vessel exceeded 300ml.
Near optimum volumetric concentration of tylosin (800 mg*L-1) and chemical similarity (0.76 relative similarity units) between extracts from the two fermentation vessels was achieved simultaneously using a culture volume of 5ml or 260ml and an agitation rate of 125rpm or 225rpm for small and large shake flask vessels, respectively. These latter conditions were considered optimal because they provided the largest volume of fermentation extract that was most similar in chemical composition.
The observation that high volumetric concentration of tylosin occurred under conditions of low volume and high agitation was similar to results reported by Jensen et al. [2] for relomycin and tylosin production in Streptomyces hydroscopicus, and by McDaniel & Bailey [17] for production of candidin, by Streptomyces viridoflavus. The latter authors showed that gas diffusion rates were a limiting factor in production of candidin by S. viridoflavus. A number of physical strategies, including diffusive closures, agitation, surface area to volume ratio enhancement, baffles, and headspace-purging devices have been developed to enhance gas diffusion rates in shake flask fermentations. In the current system, agitation rate, surface area to volume ratio, and closure gas diffusion rate (data not shown) have been optimized to achieve equivalent secondary metabolite production from S. fradiae fermentations that were completed in the two types of shake flask vessels. Future studies will focus on characterizing the effects of baffles (wire coils and stationary) on chemical equivalence of fermentation extract between the small and large shake flask vessels. An enhancement in gas diffusion rates due to the use of baffles may alleviate the restrictions in fermentation volume, especially in the large scale vessel and thus, provide greater yields of bioactive compounds.
Chemical similarity measurements are responsive to physiological changes in S. fradiae during cell growth Tylosin biosynthesis in batch fermentations has been shown to follow a trophophase-idiophase kinetic pattern that is responsive to changes that occur in cell physiology during growth. Contour plots of volumetric concentration of tylosin and chemical similarity for small and large shake-flask fermentations of S. fradiae showed similar response patterns over the conditions evaluated. This result provided evidence that chemical similarity measurements may be responsive to changes that occur in cell physiology during growth. To confirm that this hypothesis, chemical similarity, volumetric concentration of tylosin, dry cell weight, deoxyribonucleic acid (DNA) concentration, and total protein concentration were measured throughout a 144 hour fermentation of S. fradiae.

Volumetric concentration of tylosin, DNA concentration, and total protein increased logarithmically during the course of the fermentation (Figure 3). Dry cell weight measurements, however, were found to be an unreliable measure of cell growth due to the presence of particulate growth medium compounds (potato dextrin) that associated with the bacterial cells prior to the 95hr sample collection event (Figure 3). Chemical similarity measurements were performed by comparing LC-MS chemical fingerprints from s144hr fermentations to five prior samples collected during the course of the fermentation (0,26,49,72,95 hours). The line shape for chemical similarity measurements emulated the line shape for tylosin concentration, DNA concentration, and protein concentration in fermentation extracts (Figure 3). This result showed that chemical similarity measurements were sensitive and highly correlated to physiological changes that occurred during growth phases of S. fradiae.
Conditions that support chemical equivalence in actinomycetes are culture dependent
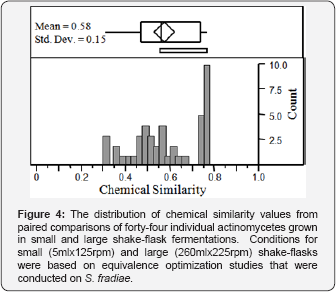
Conditions that supported similar chemical output in S. fradiae fermentations were used to assess chemical similarity between small (5ml x 125rpm) and large (260ml x 225rpm) shake flask fermentations of forty-four uncharacterized actinomycetes (Table 2). A bimodal distribution of chemical similarity scores was observed for the actinomycete population, with approximately 31% producing highly equivalent chemical output and a majority (69%) producing non-equivalent output (Figure 4).
Physical differences between fermentation vessels, including vessel geometry, gas exchange efficiency, heat-removing capacity, and mixing effects have been used successfully to establish conditions that result in equivalent chemical output from microorganisms that have been cultivated in dissimilar fermentation systems. These bioprocess modeling methods have been validated experimentally through measurement of gas transfer rates by direct chemical methods, or through the use of dissolved oxygen, pH, redox or similar insitu probes placed in the fermentation environment [8-10,18]. Chemical methods, such as oxidation of sulfite by catalytic action of the cupric ion have been used to assess gas transfer rate in shake-flask fermentation vessels. These methods have the advantage that they are non- invasive when compared to sampling probe methods. However, some chemical methods must be performed off-line to avoid matrix interferences and toxicity of the reagents [7]. Thus, chemical methods provide limited information concerning the effect that different fermentation environments may have on the expression of secondary metabolites. While sampling probes are common with large-scale fermentations, they have not been widely adapted to the shake-flask scale due to the limited fermentation volume or with the high-throughput often required for these processes [8].
In addition to the physical effects, McDaniel & Bailey [17] found that rheological properties of the culture contributed significantly to the reproducibility of secondary metabolite biosynthesis by Streptomyces viridoflavus and biomass production by insitu. Results from this study demonstrate that it is necessary to consider both the biological and physical attributes of the bioprocess during the scale-up procedures if the goal is to achieve an equivalent chemical or biological state between two or more fermentation systems. Furthermore, results indicate that the LC-MS metabolite fingerprinting technique can be applied during scale-up efforts for empirical development of conditions that support equivalent expression of secondary metabolites in bioprocess development phases of discovery research.
Direct chemical measurement of the total yield or volumetric concentration of secondary metabolites in fermentations is considered the most accurate method to achieve equivalent secondary metabolite production during scale-up of bioprocesses [1,11]. The successful use of this direct approach, however, is dependent upon the availability of chemical data for targeted secondary metabolites. Knowledge concerning the chemical properties of bioactive secondary metabolites that are present in natural product extracts is often not available during the initial phases of discovery research. Re-supply efforts are thus, dependent on the use of bioassys or indirect measures of cell growth (e.g., substrate utilization, carbon dioxide evolution, and dissolved oxygen) as a means to establish bioprocess conditions that support equivalent production of bioactive secondary metabolites from microorganisms. Both approaches are nonideal in regard to the ultimate objective, to achieve identical chemical output from a microorganism that is cultivated in two different types of fermentation systems.
In conclusion, this study demonstrates that LC-MS can be employed as a method to measure generic chemical equivalence in natural product discovery bioprocesses. The method was shown to be efficient in detecting and quantifying changes that occurred in the expression of secondary metabolites from S. fradiae and a group of uncharacterized actinomycetes that were scaled up from a high-throughput microscale fermentation system to a 2.5L nominal volume Tunair flask system. This approach could also be used for the systematic classification of microorganisms based on the presence of common or unique secondary metabolites, or for categorizing microorganisms that have highly similar or unique secondary metabolite expression patterns [19-31].
Acknowledgement
The author would like to express his sincere appreciation to Dr. Matthew Hilton and Richard Higgs for helpful discussions concerning the experimental design of this project and assistance in review of the manuscript.
References
- Genilloud O, González I, Salazar O, Martín J, Tormo JR, et al. (2011) Current approaches to exploit actinomycetes as a source of novel natural products. J IndMicrobiolBiotechnol 38(3): 375-389.
- Jensen PR. (2016) Natural Products and the Gene Cluster Revolution. Trends Microbiol 24(12): 968-977.
- Katz L, Baltz RH (2016) Natural product discovery: past, present, and future. J Ind Microbiol Biotechnol 43(2-3): 155-176.
- Ito T, Masubuchi M (2014) Dereplication of microbial extracts and related analytical technologies. J Antibiot (Tokyo) 67(5): 353-360.
- Zhang MM, Qiao Y, Ang EL, Zhao H (2017) Using natural products for drug discovery: the impact of the genomics era. Expert Opin Drug Discov 12(5): 475-487.
- Ymele-Leki P, Cao S, Sharp J, Lambert KG, McAdam AJ, et al. (2012) A high-throughput screen identifies a new natural product with broad- spectrum antibacterial activity. PLoS One 7(2): e31307.
- Pereira DA, Williams JA (2007) Origin and evolution of high throughput screening. Br J Pharmacol 152(1): 53-61.
- Hilton MD (1999) Small-scale liquid fermentations. In: Demain AL & Davies JE (Eds.), Manual of Industrial Microbiology and Biotechnology, (2nd edn), ASM Press. Washington DC, USA.
- Isett K, George H, Herber W, Amanullah A (2007) Twenty-Four-Well Plate Miniature Bioreactor High-Throughput System: Assessment for Microbial Cultivations. Biotechnol Bioeng 98(5): 1017-1028.
- Liu B, Li S, Hu J (2004) Technological advances in high-throughput screening. Am J Pharmacogenomics. 4(4): 263-276.
- Zhu F, Qin C, Tao L, Liu X, Shi Z, et al. (2011) Clustered patterns of species origins of nature-derived drugs and clues for future bioprospecting. Proc Natl Acad Sci 108(31): 12943-12948.
- Abdelmohsen UR, Grkovic T, Balasubramanian S, Kamel MS, Quinn RJ, et al. (2015) Elicitation of secondary metabolism in actinomycetes. Biotechnology Advances 33 (6 Pt 1): 798-811.
- Causon TJ, Hann S (2016) Review of sample preparation strategies for MS-based metabolomic studies in industrial biotechnology. Analytica Chimica Acta 938: 18-32.
- Julian RK, Higgs RE, Gygi JD, Hilton MD (1998) A method for quantitatively differentiating crude natural extracts using high- performance liquid chromatography-electrospray mass spectrometry. Anal Chem 70(15): 3249-3254.?
- Higgs RE, Zahn JA, Julian RK, Gygi JD, Hilton MD (2001)Rapid Method To Estimate the Presence of Secondary Metabolites in Microbial Extracts. Appl Environ Microbiol 67(1): 371-376.
- Zahn JA, Higgs RE, Hilton MD (2001) Use of Direct-Infusion Electrospray Mass Spectrometry to Guide Empirical Development of Improved Conditions for Expression of Secondary Metabolites from Actinomycetes. Appl Environ Microbiol 67(1): 377-386.
- McDaniel LE, Bailey EG (1969) Effect of shaking speed and type of closure on shake flask cultures. Appl Microbiol 17(2): 286-290.
- Huber R, Ritter D, Hering T, Hillmer AK, Kensy F, et al. (2009) Cultivations in microtiter plates with high information content. Microb Cell Fact 8: 42.
- Ashton MJ, MC Jaye, Mason JS (1996) New perspectives in lead generation II: Evaluating molecular Diversity. Drug Discovery Today 1(2): 71-78.
- Bennett JW, Bentley R (1989) What's in a name?-Microbial secondary metabolism. In. Neidleman SL (Ed.), Advances in Applied Microbiology Volume 34, Academic Press, Inc. New York, USA, pp. 1-28.
- Beppu T (1992) Secondary metabolites as chemical signals for cellular differentiation. Gene 115: 159-165.
- Diminic J, Starcevic, A, Lisfi, M (2014) Evolutionary concepts in natural products discovery: what actinomycetes have taught us.J IndMicrobiolBiotechnol. 41: 211-217.
- Franco CM, Coutinho LE (1991) Detection of novel secondary metabolites. Crit Rev Biotechnol 11(3): 193-276.
- Guiochon G, Moysan A, Holley C (1988) Influence of various parameters on the response factors of the evaporative light scattering detector for a number of non-volatile compounds. J Liquid Chrom 11(12): 25472570.
- Horinouchi S, Beppu T (1992) Autoregulatory factors and communication in actinomycetes. Annu Rev Microbiol 46: 377-398.
- Lechevalier HA, Pine L (1977) The actinomycetales. In: Laskin AI and Lechevalier HA (Eds.), CRC Handbook of Microbiology. CRC Press, Cleveland, Ohio, pp. 361-380.
- Marahiel MA, Stachelhaus T, Mootz HD (1997) Modular peptide synthetases involved in nonribosomal peptide synthesis. Chem Rev 97(7): 2651-2673.
- Rose AH (1979) Production and industrial importance of secondary products of metabolism. In: Rose AH (Ed.), Secondary Products of Metabolism. Academic Press, New York, USA, pp. 1-33.
- Tang L, Kebarle P (1993) Dependence of ion intensity in electron spray mass spectrometry on the concentration of the analytes in the electrosprayed solution. Anal Chem 65(24): 3654-3668.
- Yang SS, Ling MY (1989) Tetracycline production with sweet potato residue by solid-state fermentation. Biotechnol Bioeng 33(8): 10211028.
- Yarbrough GG, Taylor DP, Rowlands RT, Crawford MS, Lasure LL (1993) Screening microbial metabolites for new drugs: Theoretical and practical issues. J Antibiot (Tokyo) 46(4): 535-544.


