Quantification of Physicochemical Components in Yoghurts from Coconut, Tiger Nut and Fresh Cow Milk
Chukwuma Stephen Ezeonu*, Verwiyeh Silas Tatah, Chukwumaobim Daniel Nwokwu and Soyinka Malantso Jackson
Department of Biochemistry, Federal University Wukari, Nigeria
Submission: October 12, 2016; Published: December 06, 2016
*Corresponding author: Chukwuma Stephen Ezeonu, Department of Biochemistry, Faculty of Pure Applied Science, Federal University Wukari, Taraba State, Nigeria, Tel: +2348066919780; Email:chuksmaristos@yahoo.com
How to cite this article: Ezeonu CS, Tatah VS, Nwokwu CD, Jackson SM. Quantification of Physicochemical Components in Yoghurts from Coconut, 002 Tiger Nut and Fresh Cow Milk. Adv Biotech & Micro. 2016; 1(5): 555573. DOI: 10.19080/AIBM.2016.01.555573
Abstract
This research work was conducted to quantify the components in the yoghurts produced from coconut and tiger nut as well as their composite with fresh cow milk yoghurt serving as the control. The yoghurts were hygienically produced under clean environment and evaluated to determine the biochemical contents in addition to the vitamin/mineral composition, pH, titratable acidity and sensory qualities.
This research work was conducted to quantify the components in the yoghurts produced from coconut and tiger nut as well as their composite with fresh cow milk yoghurt serving as the control. The yoghurts were hygienically produced under clean environment and evaluated to determine the biochemical contents in addition to the vitamin/mineral composition, pH, titratable acidity and sensory qualities.
The total sugar content is higher in sample CMY (13.59±0.02 %) than in sample CTY (12.76±0.01 %). In terms of nitrogen free extract sample CCY (7.89±0.01 %) was higher compared to sample CMY (3.38±0.01 %) whose value was low, but sample CMY (86.31±0.03 Kcal/100g) has higher energy value compared to sample CTY (83.21±0.01 Kcal/100g).The addition of artificial enhancers such as the milk flavor, has great impact on the overall acceptability of the products because all values obtained from the enhanced product were significantly higher (p<0.05) when compared with those in their natural forms. It was concluded that yoghurts from the composite (coconut/tiger nut yoghurt) obtained from plant sources can serve as a close substitute for yoghurt produced from fresh cow milk.
Keywords: Cow milk; Coconut; Tiger nut; Proximate composition; Mineral/Vitamin; Sensory evaluation
Introduction
The consumption of yoghurt in Nigeria has increased tremendously so much so that lots of beverage industries are producing it in commercial quantities for millions of the populace who have embraced this fermented food product as part of their daily diet. Yoghurt, a fermented milk product consumed by large segments of the population either as a part of diet or as a refreshing beverage is one of the oldest fermented milk products known. Adolfssonet al. [1], stated that it is nutritiously balanced containing almost all the nutrients present in milk in a more assimilable form. It is obtained by lactic acid fermentation of milk through the action of a starter culture containing Streptococcus thermophilus and Lactobacillus bulgaricus [1]. Human consumption of yoghurt has been associated with tremendous health benefits due to improvement of gastrointestinal functions and disease risk reduction [2] following it daily consumption. It is believed to promote good gum health, facilitates the absorption of calcium, thus preventing osteoporosis, possibly because of the probiotic effect of lactic acid bacteria present in it [3].
Different brands and forms of yoghurt are available in the market like: stirred, strained, set, frozen, sweetened or flavored and liquid yoghurt. The quality of yoghurt in local markets varies from one producer to another. Poor quality milk, unhygienic practices associated with the process involved and the use of “wild type” starter culture give rise to poor grade [4]. However, the inclusions of non-dairy ingredients have been found to improve yoghurt quality, create new brands of yoghurts and modulate perception of consumers [5-6]. Yoghurt like products have been prepared from soybean [7], it has also been prepared from coconut and tiger nut [8]. This research was aimed at producing yoghurts from tigernut, coconut and their composite in other to evaluate their biochemical composition as a means of augmenting alternative protein source especially to vegetarians, lactose intolerant individuals and low income earners.
Materials and Methods
Materials and equipment used
The materials and equipment used for the Laboratory work include: Tiger nut, coco nut, fresh cow milk, plastic bowls, packaging bottles, knife, stirrer, measuring cup, thermometer, pH meter, Ohaus analytical weighing balance, table spoon, sugar, milk flavor, starter culture, Whatman No 1 filter paper, refrigerator, electric kettle, jug, sensory evaluation cups, table, masking tape, marker, blender, pots, muslin clothes, pestle, mortar, grater, water, oven, petri dish, dessicator, tong, crucible, spatula, hot metal plate, fume cupboard, muffle furnace, kjeldahl flask, kjeldahl digestion compartment, conical flask, fat extractor, beaker, Buchner funnel, litmus paper, atomic absorption spectrophotometer (AAS), high performance liquid chromatography machine (HPLC) and refractometer.
Procurement of raw materials
Approximately 3kg of yellow tiger nut (Cyperus esculentus) were obtained from a market in Wukari town, Taraba State, Nigeria and transported to the Food Science and Technology Laboratories in Federal University Wukari, Nigeriain a polyethylene bag. The coconut fruit were also obtained locally within Wukari metropolis in Taraba State, Nigeria. The fresh cow milk was obtained from the Fulani grazing area of Wukari Local Government Area in Taraba State, Nigeria. The freeze-dried starter culture was purchased from a confectionary supermarket in Makurdi city, Benue State, Nigeria. Portable water was used strictly throughout this project work.
Preparation of tiger nut yoghurt
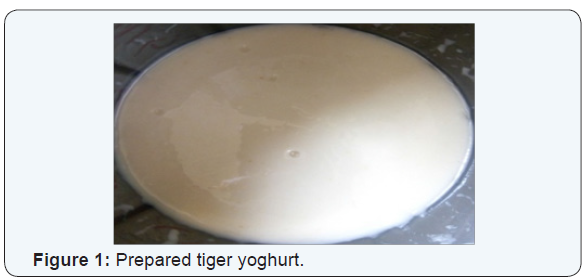
The fresh yellow tiger nuts (Cyperusesculentus) were washed and crushed using pestle and mortar and were blended using the Master Chef blender. It was then filtered using muslin cloth to obtain the filtrate (pure tiger nut milk).The tiger nutmilk was pasteurized (i.e heated to 85 °C for 15 minutes) to kill any undesirable bacteria and to partially break down the milk proteins. The pasteurized tiger nut milk was then cooled to 45 °C and dispensed into an air-tight plastic container. Commercial freeze-dried mixed culture (5g) ‘Yogourmet’ containing L. bulgaricus, S. thermophilus and L. acidophilus was dissolved in a 10 ml sterile warm water to activate the organisms. This active culture was used to inoculate 1litre (1,000 ml) tigernut milk, at the same temperature of 45 °C. It was then incubated and allowed to stand for 24 hours for fermentation (Figure 1).
Preparation of coconut yoghurt
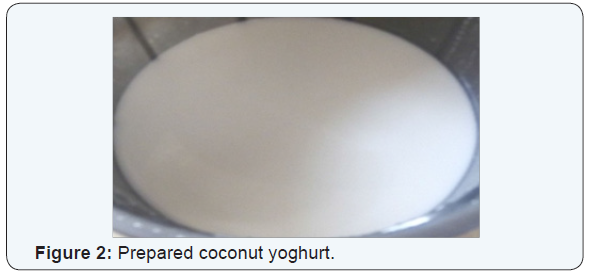
The method used was a modification of that reported by Ndifeet al. [9]. The coconuts were washed and de-husked using knife and hammer; they were peeled using knife to remove the outer woody mesocarp and then washed with portable water to remove all dirt. They were then chopped into smaller pieces before grating to fine particles followed by blending (using the Master Chef blender) and addition of water to produce milkslurries. It was then filtered to obtain the filtrate using the muslin cloth. The other methods for complete production is as reported above for tiger nut yoghurt production (Figure 2).
Preparation of fresh cow milk yoghurt
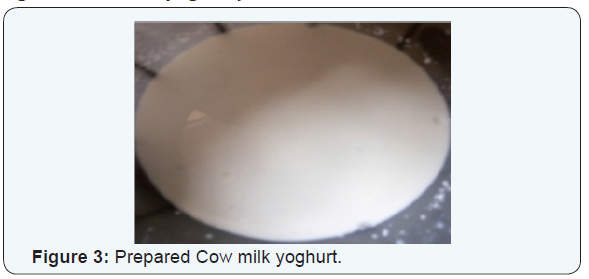
The fresh cow milk was strained (sieved) through muslin cloth. The procedure for complete production of fresh cow milk yoghurt (Figure 3) has been mentioned above (for production of tiger and coconut yoghurt).
Preparation of Composite yoghurt
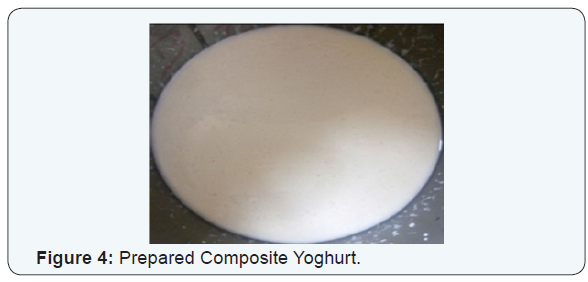
The composite yoghurt (Figure 4) was prepared in the ratio of 1:1 (i.e 50% Tiger nut and 50% Coconut milk). The coconut milk (500mls) as well as 500mls of the tigernut milk were measured using the measuring cup. The well homogenized blend was transferred into a pot. The yoghurt production procedures are as reported above
Analytical methods
Proximatec composition: Proximate analysis was carried out to determine the nutritional composition of yoghurt samples. The parameters include; Moisture, Ash, Protein, Crude fibre, Fat and Carbohydrate. The procedure used for the proximate analysis of the produced yoghurt was adopted from the analytical method described by AOAC [10].
Determination of moisture content: The oven drying method of AOAC [10] was adapted. A clean suitable Petri dish was dried in an oven for 30 minutes. The dish was transferred into a desiccator to cool using a pair of tong. The cooled empty dish was weighed and the weight was recorded as W1. Two grams (2g) of the test samples were weighed into the dish and the dish was reweighed and recorded as W2. The sample was dried in an oven (Genlab MINO/30 UK) set at 1000C until constant weight was recorded. The dish and its dried content were then weighed and the reading was recorded as W3. The recorded weights i.e. W1, W2 and W3 were used to calculate the moisture content of the food sample using the formula
% Moisture= (W2-W3)/(W2-W1) X 100
Where; W1 = weight of empty dish,
W2 = weight of dish + sample before drying,
W3 = weight of dish + sample after drying.
Determination of Ash content: The dry ashing method of AOAC [10] was used. A clean crucible was dried in an oven and transferred into a desiccator to cool. The crucible was weighed and recorded as W1. Using a spatula, 5g yoghurt sample was weighed into the crucible, it was weighed and recorded as W2. The sample was pre-ashed on a hot metal plate in a fume cupboard to prevent the fume from contaminating the laboratory environment with foul smell. The pre-ashed sample was transferred into a muffle furnace (Vecster ECF3, UK) set at 600 °C for complete ashing of the sample. Ashing was complete when the colour of the sample changes to whitish-ash. The crucible containing the ashed sample was removed and kept in a desiccator to cool after which it was weighed and recorded as W3. The ash content of the analysed sample was calculated from the values of W1, W2 and W3 using the formula:
% Ash C ontent= (W3-W1)/(W2-W1) X 100
Where; W1 = weight of empty crucible,
W2 = weight of crucible+ weight of sample before ashing,
W3 = weight of crucible+ weight of sample after ashing.
Crude protein determination: Crude protein was determined by Kjeldahl method described by AOAC [10]. The sample (2g) was weighed on a filter paper and transferred into Kjeldahl flask. Concentrated H2SO4 (25ml) and half Kjeldahl tablet (catalyst) was added into the Kjeldahl flask. The flask was placed in the Kjeldahl digestion compartment and the heater turned on. The mixture was heated till the solution turned colorless. The heater was then, turned off and allowed to cool to room temperature. Distilled water (200ml) was added to dilute the acidic medium. Also added was 75ml of 5% NaoH. Glass beads were also added to the mixture as anti-bumping agent. A mixture comprising of 50ml of 4% boric acid and 3 drops of screened methyl red was made into a 250ml conical flask. The neutralized sample was transferred immediately to the Kjeldahl distillation compartment and the apparatus was set up, the heater was again turned on and the conical flask containing boric acid and the indicator was placed on the ammonia outlet. The ammonia was allowed to distil into the boric acid beaker until it reached the 250ml mark. The mixture above was titrated with 0.1N HCl to a light reddish color. The titre value was recorded and used to calculate the percentage nitrogen content and the protein content using the expressions below;
% Nitrogen= (0.00014 X Titre X 50)/(Wt. of sample taken) X 100
The % crude protein is determined by multiplying the calculated nitrogen content of the sample by a conversion factor.
% protein = %N x 6.2
Determination of lipids: Crude fat was determined using the solvent extraction method described by AOAC [10]. The conical flask was dried in an oven at 100oC for 15 min, and allowed to cool in a desiccator, and weighed. Yoghurt samples (3g) were measured and transferred into a thimble plugged with a cotton wool. The thimble with its contents was placed into the extractor with petroleum spirit (petroleum ether) and the extraction process was left for 4 hrs. The residue from the thimble was transferred to a small mortar it was gently ground and returned into the thimble fitted to the extraction apparatus for further extraction for 1hour. The thimble was removed from the extractor and allowed to cool using a desiccator. Diethyl ether (12mls) was added into the sample in the flask, and was properly agitated. Dilute ammonia (0.5 ml) was added to the samples in the flask; water (4.5ml) and light petroleum ether (12.5 ml) were added and gently mixed. The upper layer of the sample was siphoned into a cleaned weighed beaker. The extract was heated to remove solvent by evaporation and was re-weighed the values obtained were recorded. The percentage fat content was calculated using the formula:
% Fat Content = (Weight of Extract)/(Weight of Sample) X 100
Determination of Percentage Crude Fiber: methodology by AOAC: Oil was removed from 2g yoghurt sample by soxhlet extraction, setting and decanting three times with petroleum spirit. The air-dried fat-free material was transferred into a 250ml conical flask. (Trichloroacetic acid) (100 ml) was added at room temperature and boiled by refluxing gently for 30 minutes; the acid was allowed to stand for approximately 1 min, maintaining constant volume by the flow of water. Whatman No. 541 (11cm) filter paper was fitted into a Buchner funnel and the acid poured into the prepared funnel. The insoluble material was washed with boiling water until the filtrates became neutral to the litmus paper. The filter paper containing the residue was transferred into the crucible and the crucible was dried with its contents at 100°C. This was allowed to cool in a desiccator and weighed. The crucible was placed in a cool muffle furnace and the temperature was increased to 500°C and maintained until ashing was complete. The crucible was removed from the muffle furnace and cooled in a desiccator and weighed after cooling. The percentage fiber in the sample was calculated by multiplying the loss in weight on ignition, by 100 [10].
Determination of Carbohydrate Content: Total carbohydrate content of each sample was determined by nitrogen free extractives and carbohydrate difference using the method described by Bryant et al. [11]. These were done by subtracting the total percentage values of moisture, ash, protein, fat, crude fiber obtained from 100 %, thus:
% Carbohydrate = 100% - (% moisture + % ash + % protein + % fat + % crude fiber).
Mineral Analysis
Mineral analysis was carried out using dry digestion method. The method described by AOAC [10] was adopted. Calcium, phosphorus, potassium were analyzed from the triple acid digestion (wet digestion method). Exactly 5g of the samples was weighed into porcelain crucible and the crucible with the sample was placed in a muffle furnace. Then, the temperature was increased gradually until it reached 550 °C. The sample was ashed until a white or grey ash was observed in the crucible. The ash was dissoslved by adding 2ml of conc. HNO3 to the crucible. The dissolved ash was transferred into 100 ml volumetric flask and diluted to 100 ml with water, agitated and filtered. The standard and unknown samples were run in an atomic absorption spectrophotometer (Shimadzu AA, 650 model) with specific lamps (for all mineral elements and heavy metals) and flame photometer (for Na and K) using air acetylene flame integrated mode and quantity of unknown concentration was determined from the calibration curve of standards.
Determination of vitamins
Prepared yoghurt sample (2ml) was measured into a 250ml volumetric flask and made up with mobile mixture, and refluxed. The mixture was centrifuged and decanted. The filtrate was filtered using HPLC filter paper. Analysis was performed by injecting 20μl of the above carefully prepared sample into a Buck scientific (USA) BLC10/11-model HPLC equipped with UV 254nm detector for fat and water soluble vitamins respectively. A C18, 4.6x150mm, 5μm column and a mobile phase of 95.5 (methanol: water) was used at a flow rate of 1.00 ml/minute at ambient temperature. A 0.1mg mixed standard was analysed in a similar manner for identification. Peak identification was conducted by comparing the retention times of authentic standards and those obtained from the samples concentrations which were calculated using a four point calibration curve.
Determination of titratable acidity (Ta)
The Ta values of each yoghurt sample was determined after mixing each yoghurt sample with 10ml hot distilled water (90 °C) and titrating with 0.1N NaoH containing 0.5% phenolphthalein as an indicator to an end point of faint colour. The % lactic acid produced as a result of fermentation in the sample was calculated thus:
Titre value × 0.09 × 100%
Titre value = Volume of sample solution used
Where; 0.09 is a conversion factor.
pH determination
The pH measurement was carried out using a digital pHmeter (Jenway 3505, UK) calibrated with pH 4 and 7 buffers. The sample (25 ml) was transferred to a 50 ml beaker. The pH probe was inserted into the sample, and the beaker was gently swirled until the pH reading stabilized before noting the value.
Note: The pH was determined a day after production and 7days after production.
Determination of total sugar
Total sugar was determined by refractometer method; where 20ml of sample was mixed with 10ml of 10% lead acetate in a beaker and filtered through Whatman filter paper No.1 into a 100ml volumetric flask. Two (2) spoons full of sodium hydrogen carbonate were added to the filtrate to precipitate the excess lead and it was filtered again. The filtrate was used to determine the total sugar content of the yoghurt sample by dropping 1ml of the prepared sample into a refractometer and the sugar content read directly from the refractometer.
Gross Energy Determination
The energy contained in food sample was measured in kilo-calories/100g (Kcal/100g). The energy value of samples according to AOAC [10] was determined by multiplying the % carbohydrate content by 4%, protein content by 4% and fat content by 9%. It was calculated thus:-
Energy value = (% CP * 4) + (% CFT * 9) + (% NFE * 4)
While,
% NFE (nitrogen free extract) = 100- (% CP + % CF + % CFT+ % ash + % moisture),
Where;
% CP = percentage crude protein
% CFT = percentage crude fat
% NFE = percentage nitrogen free extract
% CF = percentage crude fibre.
Sensory Evaluation
The sensory properties of samples were evaluated by a trained panel consisting of 10 assessors (including students and staff in Food Science and Technology and Biochemistry Departments). Different kinds of yoghurt samples were served at 7 to 10 °C in plastic cups and coded with three-digit numbers. Order of presentation of the samples was randomized. A test form (questionnaire) comprising five sensory attributes, namely, colour, taste, flavour, texture and overall acceptability, was given to each of the assessor. A standard 9-point scale was used for the evaluation of sensory characteristics of the samples. The evaluation was conducted at the Sensory Evaluation Laboratory of the Food Science and Technology Department of Federal University Wukari, Taraba State, Nigeria.
Statistical Analysis
The results obtained from proximate, minerals, vitamins and sensory analyses were subjected to independent sample T-test using IBM SPSS (20 Version). Significance different between samples was tested at p<0.05.
Results
Proximate composition analysis
Means in the same row with the same superscript letter are not significantly different at (p<0.05)
key: TNY= Tiger nut yoghurt, CCY=Coconut yoghurt, CTY= Coconut and Tiger nut Yoghurt (i.e Composite yoghurt), CMY= Cow milk yoghurt (the control), enhanced CCY (i.e Coconut yoghurt + Sugar + Milk flavour), TNY enhanced (i.e Tiger nut + Sugar + Milk flavour), CPY enhanced (i.e Composite + Sugar + Milk flavour)(Table 1).

The pH and titratable acidity of the yoghurt samples (Table 2).

Mineral Composition Analysis: Mineral composition of the yoghurt samples mg/100g) (Table 3).

Vitamins Composition Analysis: Vitamins composition of the yoghurt samples (mg/100g) (Table 4).

Sensory Evaluation Analysis: The result of sensory evaluation attributes (Table 5).

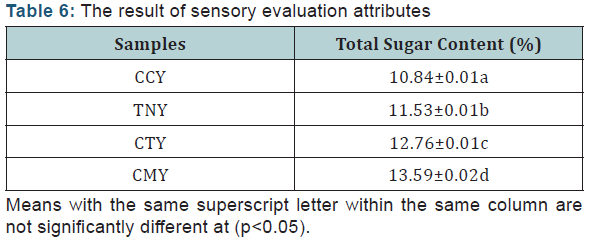
Total Sugar Analysis: The result of sensory evaluation attributes (Table 6).
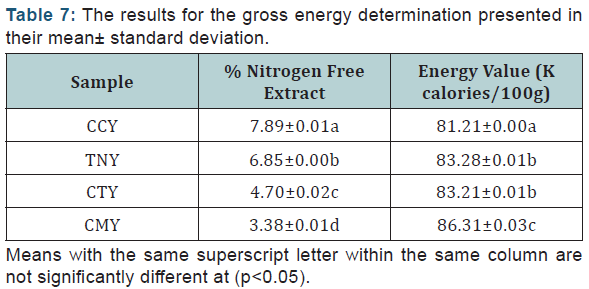
Gross Energy Determination: The results for the gross energy determination presented in their mean± standard deviation (Table 7).
Discussion
Proximate composition analysis
The results of the proximate composition analysis of the yoghurt samples are presented in Table 1. From the results, the mean values for crude protein are significantly different (p < 0.05) among coconut yoghurt (CCY) (4.87±0.01%); tiger-nut yoghurt (TNY) (5.24±.0.01%) and coconut/tiger nut yoghurt (composite) (CTY) (6.67±0.07%) samples. The crude protein was found to be higher in cow milk yoghurt (CMY) (7.41±0.023%) which is in agreement with similar a study [12], and it has no significant difference (p>0.05) with CTY (6.67±.0.07%). The high content of crude protein obtained in the cow milk yoghurt, may be due to the fact that animals contain more protein than plants. The lowest mean value was observed in coconut yoghurt (CCY) (4.87±0.01%), this was significantly different from the other yoghurt samples. There was significant difference (p<0.05) in crude fat content of CMY (4.81±0.07%) compared to the other three samples (CCY, TNY and CTY) with CCY having the least value (3.35±0.01%), whereas, there was no significant difference (p>0.05) between TNY (3.88±0.01%) and CTY (4.18±0.02%). Therefore, CTY can compare favourably with CMY in terms of the fat content. The ash contents was very low in all the samples, with CMY having the highest value of 0.73±0.07%, which may be due to dietary intake and metabolic activity of the cow. The lowest ash content was recorded in CCY (0.36±0.01%), this was found to be significantly different (p<0.05) with TNY, CTY and CMY (0.43±0.01%, 0.68±0.02%, and 0.73±0.07% respectively). There also was no significant difference (p>0.05) in ash content between CTY and CMY samples.
The samples contain high moisture content which was found to be above 83.0%. There was no significant difference (p<0.05) across all the samples (CCY (83.52±0.00%), TNY (83.60±0.00%), CTY (83.75±0.00%) and CMY (83.80±0.00%).There was significant difference (p<0.05) in carbohydrate contents across all the samples with CCY (7.89±0.49%) having the highest value followed by TNY (6.85±0.42%), CTY (4.70±0.04%) and CMY (3.38±0.03%). The high mean score value of carbohydrate was recorded in samples CCY and TNY which was not significantly different at p>0.05. The reason may be because carbohydrates are obtained more from plant source.
pH and titratable acidity (% lactic acid)
The results for the pH and titratable acidity of yoghurt samples produced are presented in Table 2. The pH was determined after 24hrs of fermentation and after 7 days of storage in the refrigerator at 2-4oC. The pH of the yoghurt samples after 24 hours of fermentation showed that there is no significant difference (p<0.05) between samples CCY (4.21±0.01) and CTY (4.21±0.02) and also between samples TNY (4.45±0.02) and CMY (4.52±0.01) respectively. Samples CCY and CTY had the lowest pH of 4.21, this agrees with the finding reported by Sanful, [13]. The slightly different pH among the samples could be as a result of lower viscosity which provided larger surface area for higher activity of the starter cultures on the different substrates, thus giving different effective interaction. The pH values of the samples after 7 days of refrigeration showed that, there were no significant differences (p<0.05) across all the samples with CCY having 5.68±0.07, TNY (5.90±0.14), CTY (5.69±0.00) and CMY (5.99±0.14). This may be due to storage conditions (2-4OC) and at this temperature; the metabolic activity of the microorganisms which would produce more lactic acid was inhibited. The pH values of all the samples produced fell within the range of good quality yoghurt [14]. There was no significant difference observed in the titratable acidity of samples CTY (0.75±0.14) and CMY (0.81±0.01). There was significant difference observed between sample CCY (0.60±0.01) and TNY (0.65±0.00) respectively.
Mineral and vitamins composition of yoghurt
From the result of the mineral composition of the yoghurt samples presented in Table 3 it showed that, there is a significant difference (p<0.05) across all the samples with the CMY having high content of Potassium (K) (561.42±0.00). This may be because it was gotten from animal source. Sample CCY has the lowest level of Potassium (K) (387.62±0.00). Sample CMY which is the control has the highest level of Potassium (K), Phosphorus (P) and Calcium (Ca). The results of the mineral content suggest that sample CTY can compare favourably with sample CMY in terms of Calcium, Potassium and Phosphorus. The result for the vitamin composition of the yoghurt samples is as presented in Table 4.There was a significant difference (p<0.05) in vitamin A content across all the samples, the result shows that vitamin A content is higher in sample CMY (67.25±0.01) compared to the other samples CTY (65.76±0.01 IU/mL), TNY (63.47±0.00 IU/ mL) and CCY (59.68±0.02 IU/mL). Sample CMY had the highest value of vitamin B6 (0.20±0.00mg/100mL), and the lowest value was observed in CCY (0.16 ±0.00 mg/100mL). From the result, there was no significant difference in the vitamin B6 content between sample TNY (0.17±0.00mg/100mL) and CTY (0.18±0.00mg/100mL) respectively. Vitamin C was found to be highest in sample CCY (5.83±0.00mg/100mL), and lowest in sample CMY (4.83±0.01mg/100mL).
The sensory evaluation of yoghurt samples
The results for the sensory evaluation are presented in Table 5. The evaluation conducted included those of enhanced samples since no sugar or any other enhancer was added in the course of the production (i.e additives like flavor and sugar additives were added to enhance the samples and to test the effect of additives in the choice for overall acceptability). The result showed that, there was no significant difference (p<0.05) in terms of the colour of CCY (7.90±0.87), CMY (7.70±1.05), and their enhanced derivatives. Sample CCY had the highest value in terms of colour rating this is because Coconut is naturally white in colour. However, there was a great significant difference (p<0.05) in the colour of sample TNY (5.40±2.01) when compared with sample CCY, this is because the natural colour of tiger nut used for the production is yellowish. Even though the result showed that CMY and CCY are not significantly different, TNY can compete favourably with CCY and CMY in terms of colour. Hence sample TNY can be presented as substitute for CCY and CMY in terms of colour. The CTY had higher mean score for taste (6.70±1.88) for the natural products (i.e without enhancers). Although the enhanced CCY had the highest mean score (7.60±1.07), which was significantly different (p<0.05) from the other samples. This was due to the addition of sugar. There was no significant different (p<0.5) between the taste of sample CCY (6.00±2.26), and TNY (5.80±2.74). Sample CMY (5.30±2.16) had the lowest mean score. The enhanced TNY sample had the highest mean score (8.30±0.82) for flavor even though the natural form had the lowest mean score in terms of flavour, this was significantly different (p<0.05) from other samples as shown in Table 5, but there was no significant difference (p<0.05) between samples CCY, CTY and CMY. The mean score for texture showed that, there was no significant difference in samples TNY (6.00±2.40), CTY (5.90±2.68), enhanced CCY (6.20±1.93), enhanced TNY (5.70.±2.31) and enhanced CTY (6.10±2.35) samples. The lowest mean score was observed in enhanced TNY (5.70±2.31). The mean score for overall acceptability showed that, enhanced CCY sample had the highest mean score of 7.30±1.25. The lowest mean score was observed in sample TNY (5.60±2.17). The mean score values of the sensory evaluation for the enhanced products were reasonable higher compared to the products in their natural forms this is due to the effect of artificial additives added during the evaluation process.
Total sugar analysis
The results for the analysis of the total sugar are presented in table 6 above. The results showed that the total sugar content are significantly different at (p<0.05) for all the samples, with CMY having a highest mean score of 13.59±0.02%. This could be as a result of the high content of lactose contained in cow milk. Sample CCY had the least sugar content of 10.84±0.01%, sample CTY is slightly below that of CMY (12.76±0.01%).
Gross energy determination
The result obtained showed that there is significant difference (p<0.05) across the samples in terms of % nitrogen free extract with sample CCY having the highest value of (7.89±0.01) followed by sample TNY (6.85±0.00) whereas sample CMY has the least % value (3.38±0.01). Sample CMY (i.e cow milk yoghurt) had the highest energy value with the mean score of 86.31±0.03 Kcal/100g while sample CCY has the least mean score of 81.21±0.00, but there was no significant difference between sample TNY (83.28±0.00 Kcal/100g) and CTY (83.21±0.01 Kcal/100g) at p>0.05.
Conclusion
This research shows that the combined coconut/tiger nut yoghurt produced can serve as a close substitute for the ones produced from cow milk, since the product contains the desired nutrient in their correct proportions as indicated by the results obtained from analysis. Therefore, this product (coconut/tigernut yoghurt) can nutritionally replace yoghurt produced from cow milk. Moreover yoghurts produced from plant sources are less expensive when compared to the ones produced from animal sources, which vegetarians would appreciate.
References
- Adolfsson O, Meydani SN, Russel RM (2004) Yogurt and gut function. Am J Clin Nutr 80(2): 245-256.
- Heyman M (2000) Effect of lactic acid bacteria on diseases. J Am Coll Nutr 19(supply 2): 137S-146S.
- Jackson KA, Savaiano DA (2001) Lactose maldigestion, calcium intake and osteoporosis in african, asian and hispanic-americans. J Am Coll Nutr 20(supply 2): 198S-207S.
- Younus S, Masud T, Aziz T (2002) Quality Evaluation of Market Yoghurt/Dahi. Pak J Nutri 1(5): 226-230.
- Karagul-Yuceer Y, Coggins PC, WilsonSS JC, White CH (1999) Carbonated yogurt- sensory properties and consumer acceptance. J Dairy Sci 82(7): 1394-1398.
- Iwalokun, BA, Shitu, MO, (2002) Effect of hibiscus Sabdariffa (Calyce) extract on biochemical and organoleptic properties of yogurt [2007]. Pak J Nutr 6: 172-182.
- Terna G, Musa A (1998) Soybeans yoghurt production using starter culture from ‘nono’. Nig J Biotech 9(1): 17-23.
- Akoma O, Elekwa UO, Afodunrinbi AT, Onyeukwu GC (2000) Yogurt from Coconut and Tiger nut. The Journal of Food Technology in Africa 5(4): 132-134.
- Ndife J, Idoko F, Garba R (2014) Production and Quality Assessment of Functional Yoghurt Enriched with Coconut. Inter J Nutri Food Sci 3(6): s545-550.
- AOAC (2000) Association of Official Analytical Chemists. (18th edn), Official methods of analysis, Washington DC, USA, pp. 188-189.
- Bryant LA, Monlecalvo JJR, Morey KS, Lay B (1988) Processing, functional and nutritional properties of okra seed products. J Food Sci 53(3): 810-816.
- Adgidzi EA, Abu JO (2010) Effect of processing methods on the yield and quality of aqueous extracts and yoghurt- like products from Tigernuts (Cyperusesculentus). University of Agriculture, Makurdi Benue State, Nigeria, p. 73.
- Sanful R (2009) Promotion of coconut in the production of yoghurt. African J Food Sci 3(5): 147-149.
- Tamime AY, Deeth HC (1980) Yoghurt technology and biochemistry. J Food Sci and Tech 43: 939-977.


