Post Processing Analysis for Calculation of In Vivo Brain Temperature Using Magnetic Resonance Spectroscopy
Letizia Squarcina1,4, Nereo Bresolin1,2,3,4 and Mario Rango1,2,3,4*
1Department of Neuroscience and Mental Health, Foundation IRCCS Cà Granda-Ospedale Maggiore Policlinico Foundation, Milan, Italy
2Neurology Unit, Foundation IRCCS Ca’ Granda Ospedale Maggiore Policlinico, Milan, Italy
3Department of Pathophysiology and Transplantation, Foundation IRCCS Ca’ Granda Ospedale Maggiore Policlinico, Milan, Italy
4 Excellence Center for Advanced MR Studies, Foundation IRCCS Cà Granda-Ospedale Maggiore Policlinico, Milan, Italy
Submission: March 05, 2019; Published: April 01, 2019
*Corresponding author: Harold H Kraft, Georgetown University Hospital, CMO at Laser MD Pain Relief, 1821 Wilshire Ave #300, Santa Monica, CA 90403, USA
How to cite this article:Letizia S, Nereo B, Mario R. Post Processing Analysis for Calculation of In Vivo Brain Temperature Using Magnetic Resonance Spectroscopy. Psychol Behav Sci Int J. 2019; 11(2): 555806. DOI: 10.19080/PBSIJ.2019.11.555806.
Abstract
Brain temperature is a relevant quantity in the clinical practice, and it is linked to brain activation changes and to neurological and psychiatric pathologies such as neurodegenerative diseases and schizophrenia. To date there is no consensus on which the best calibration method is to use when estimating temperature employing magnetic resonance spectroscopy. Aim of this study is to compare three different calibration techniques and parameters to identify the most suitable for brain temperature estimation.
A phantom was used, with a solution containing choline 10 mM, N-Acetyl Aspartate, 10 mM, creatine 8 mM, Glutamate 2 mM/ Glutamine 2 mM with a pH of 7.1. Single voxel spectroscopy data were acquired for a healthy volunteer in the posterior cingulum and the hypothalamus. Brain temperature was estimated using three different calibration techniques and results were compared, employing the estimation error and the residual sum of squares. Good results were obtained with all three methods, but attention must be given to peculiar situations, such as hyperthermia or hypothermia. The number of components to be estimated resulted to be a critical parameter, especially with human data as there is the need of a balance between the risks of overfitting and of losing resonance peaks due to noise. Even if different methods give similar results, there is the need to reach a consensus on which method to use when estimating brain temperature using magnetic resonance spectroscopy.
Keywords: Brain Temperature; Spectroscopy; Thermometry; Magnetic Resonance Spectroscopy
Introduction
The study of brain temperature in vivo is of high relevance in the investigation of tissue functioning, since temperature is strictly related to brain metabolism and underlying reactions. Production of heat in the brain is dependent on metabolic rates of glucose and oxygen [1] related to mitochondrial oxidative processes. On the other hand, heat removal is linked to cerebral blood flow, since blood leaves the brain at higher temperature than the incoming blood. However, the mechanisms underlying its regulation are to date still not entirely clear [2].
A modification of basal brain temperature has been hypothesized in several brain-related diseases, as schizophrenia [3,4], Parkinson’s disease [5-7], multiples sclerosis [8], metabolic disorders [9] or multiple systemic atrophy [7]. Brain temperature changes also reflect brain activation [10], thus making it a quantity which could be of great interest in psychological and behavioral studies. Intraventricular temperature has been found increased in multiple systemic atrophy and Parkinson’s disease using diffusion weighted magnetic resonance imaging [7], possibly indicating an involvement of homeostasis in these diseases. Temperature in Parkinson’s disease has been found increased also employing MRS, probably related to dopaminergic alterations typical of this condition [5]. Brain temperature in mitochondrial disease9 has been found decreased, probably due to malfunctioning of oxidative phosphorylation, which is linked to reduced neuronal activity, which leads to brain hypothermia. Moreover, elevated brain temperature has been found in stroke [11] and brain injury [12]. High brain temperature is responsible for tissue damage and changes in metabolism [13]. It is to be noted that alterations in cerebral blood flow and metabolism have been demonstrated in first episode psychosis [14], in schizophrenia [15-17] and in bipolar disorder[18-19], suggesting an involvement of vascular changes linked with functional psychoses
Brain temperature measurement in vivo, although interesting, is particularly difficult, as the use of internal probes would be obviously extremely invasive and not feasible in most cases. The possibility of measuring brain temperature non-invasively has been studied extensively: in 1993, the dependence of the 1H-MRS signal on temperature was employed by Lutz et al. [20] to estimate temperature in cell cultures. In their 1995 work, Corbett et al.[21] found that it was possible to infer temperature changes using MRS. MRS is a technique which allows the quantification of metabolites inside living tissues, using the concept of chemical shift. Notably, the chemical shift of water depends approximately linearly on water temperature [22]. This is since the equilibrium between water molecules bound to hydrogen and monomeric molecules changes with temperature [23]. It is important to notice that the chemical shift of water is relatively insensitive to changes in pH or ionic fluctuations in physiological ranges [24], so that these factors can be ignored in the analysis. Since other metabolites are not influenced by temperature changes, it is possible to quantify the temperature of the medium where reactions are taking place, considering the difference in frequency between the resonance peak of water and other metabolites in the MRS signal. Corbett et al. proposed N-Acetyl aspartate (NAA) as a reference in the estimation of brain temperature using MRS [21]. In this work, the authors presented a method which also employed a linear model for the relationship between brain temperature and difference of water and NAA resonance peaks, where they found slight slope and intercept changes with pH and protein content, limited to values around 1%, thus negligible. They compared the MRS-measured temperature with brain temperature invasively measured with implanted probes in swine, obtaining an accuracy of under 1°C. In a later work [25] they extended their method to human data acquired in a 1.5T clinical scanner.
Cady et al. [23] proposed a method where they also employed NAA and water signals, measuring the distance between the resonating peaks, in piglet brain and in a phantom solution. They obtained reliable temperature measures using a linear model, considering the tympanic temperature as a proxy of brain temperature.
More recently, it has been demonstrated [26] that brain temperature is linearly dependent on the difference of water resonance and Choline, Creatine or NAA. Authors obtained good correlation results between temperature measured with MRS and using implanted probes, in rats. There is to date no consensus on the best technique to evaluate brain temperature with MRS. In fact, the estimation method regarding metabolites and resonance peaks has not been defined with certainty. Moreover, the algorithm to be used to estimate temperature, once the metabolites are known, is left to the preference of scientists. With this study, brain temperature was non-invasively measured using a phantom in a simulation of hypo- and hyperthermia, in a clinical setting, and results obtained using the three afore-mentioned methods,and with different sets of parameters, were compared, with the aim of defining the most accurate post-processing pipeline. Then, single voxel MRS data from the posterior cingulum and the hypothalamus in a healthy volunteer were considered.
Materials and Methods
Phantom Data Acquisition
For measurement of temperature using MRS a phantom with a solution containing the metabolites of interest was used, with concentrations like those of human brain. It was composed as follows: choline (Cho) 10 mM, NAA 10 mM, creatine (Cr) 8 mM, Glutamate (Glu) 2 mM, Glutamine (Glm) 2 mM. Solution pH was 7.1. The phantom MRS data were acquired at different temperatures. A calibrated alcohol thermometer with a sensitivity of 0.05°C was placed within the phantom, and the temperature brought from 34°C to 44°C using warm water pads. The chemical shift between water and NAA was also measured with ten different acquisitions at room temperature with the same parameters to evaluate the measurement error. Data were acquired with a 1.5T Siemens AVANTO scanner (Siemens Healthcare GmbH, Erlangen, Germany). A double inversion spin echo (PRESS) single voxel spectroscopy sequence (svs-se), with a 30 ms echo time and a 4000 ms repetition time was acquired. A body coil was used during MRS acquisition. Flip angle was 90°. Each acquisition was made with 36 averages. Voxel size was 20x20x20 mm3. An MRS acquisitions was done at each 1°C step with weak water suppression.
Healthy Volunteer Data Acquisition
Single voxel MRS data for a healthy volunteer (female, 24 y.o.) were acquired in the posterior cingulum and the hypothalamus, to test the impact of the number of components on the temperature estimation of human tissue. Data were acquired with the same scanner and TR = 4000 ms, TE = 270 ms, flip angle 90°, no water suppression and 32 averages. Voxel size was 20x20x20 mm3. The study was approved by the local ethical committee and the subject gave his informed consent. The same coil as for the phantom was used.
Metabolites Estimation
The JMRUI software for metabolites estimation was used. One of the available algorithms for estimation was used, based on the Hankel-Lanczos algorithm, singular value decomposition (SVD) and total least squares (HLTLS algorithm [27]). Water and NAA chemical shift were estimated in two different steps: the water chemical shift was obtained fitted only one component to the data, while the NAA chemical shift was estimated considering 10, 15 or 20 components to be used in the model. The signal was composed of 1024 points or truncated at 800 points. A black-box algorithm with no filtering or preprocessing was chosen with the aim of introducing the smallest possible number of steps prior to elaboration, to reduce confounding factors. Then results were compared in terms of temperature using these different sets of parameters.
Temperature Estimation
The temperature was estimated using water and NAA resonance frequencies (in ppm), using the three most widely used calibration method. The method proposed by Cady et al. [23] was employed first, where the temperature T is computed as follows:

where δH2O-NAA is the difference in resonant frequencies for water and NAA.
Also, the regressions proposed by Corbett et al. [25] and by Zhu et al. [26] were considered, which are defined respectively as follows:


The temperature was computed at each °C increase, and the performances of the different calibrations were compared in respect to the known temperature, considering the correlation of estimated values with the true values. Also, the normalized sum of squared residuals was considered, defined as follows:

Where TM is the measured temperature, Ti estimated temperature at point i, and N the number of samples.
Results
Phantom data
A measurement error of 0.0002 ppm was obtained for the chemical shift between water and NAA. This translates into an error of around 0.016°C for the temperature estimated with (1), 0.014°C and 0.019°C for temperatures estimated with (2) and (3) respectively.


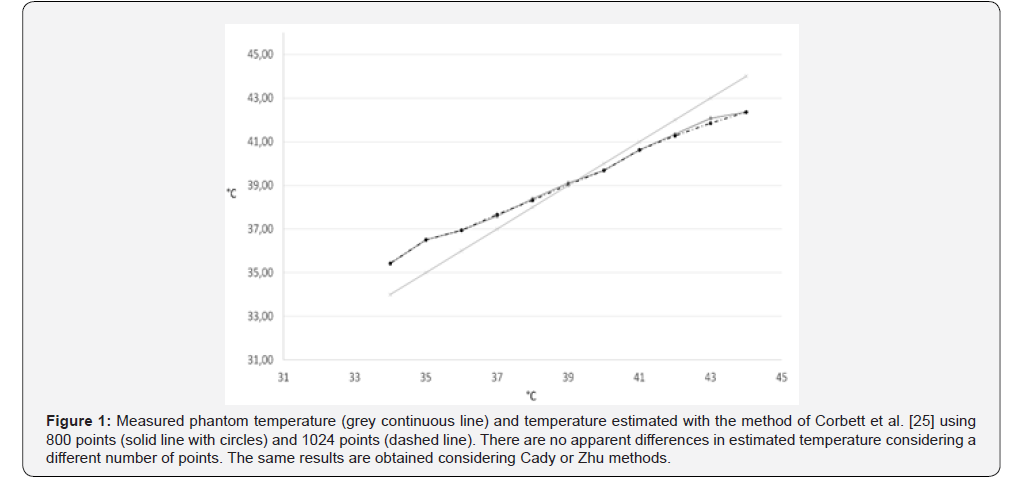
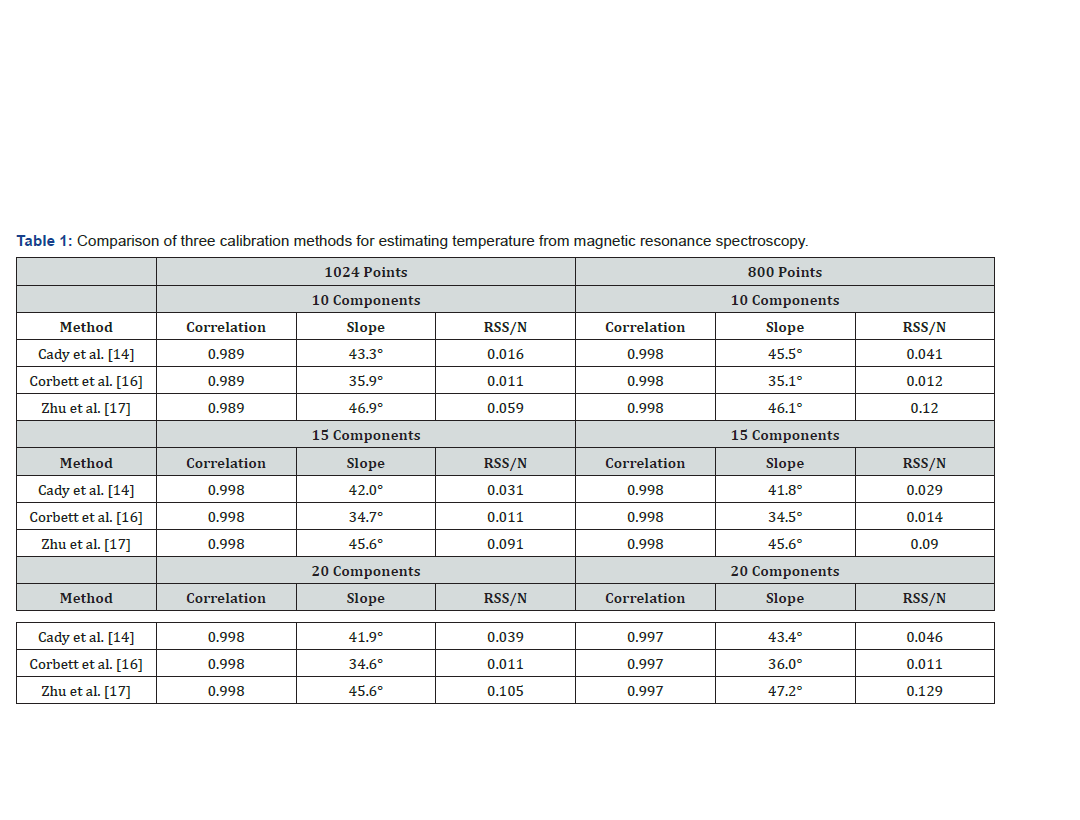
All three calibrations gave values with a high correlation with the true temperature. No relevant differences were found employing 1024 or 800 points: an example obtained using Corbett et al. method [25] is reported in Figure 1. The temperature was estimated using either 800 or 1024 points with all three methods and reported the results in (Table 1). Results for the three compared methods are listed considering 10, 15 and 20 components, and 800 or 1024 points. The correlation with the measured temperature, the slope of the regression line obtained with a linear regression, and the residual sum of squares (RSS) are reported. A perfect correspondence of measured and estimated results would give a slope of 45° and a correlation coefficient of 1.

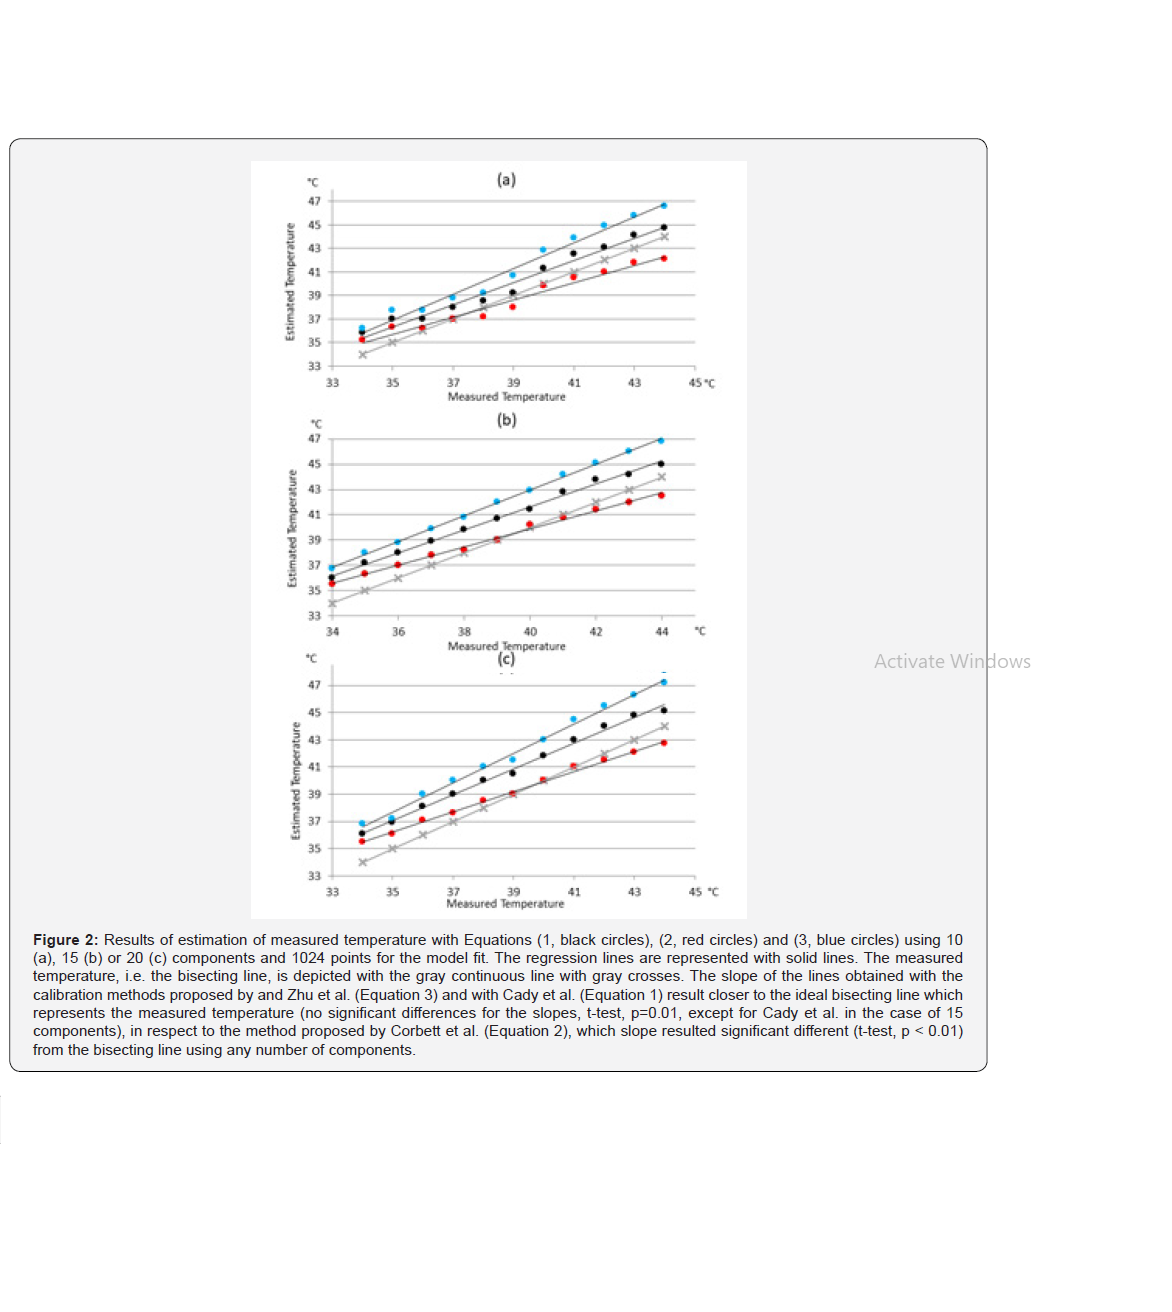
With the data used in this work, Eq.2 proposed by Corbett, et al. [25] resulted the most accurate in terms of estimation error, regardless of the number of estimated components. The slope of the regression line, though, was more distant from the ideal bisecting line [the bisecting line, with a 45° slope, would be obtained with a perfect correspondence between measured and estimated data] when compared with the other two methods (Figure 2). In fact, the slope of the linear regression of the temperature values obtained with Eq. 2 resulted significantly different from the slope obtained joining the points obtained with the measured temperature. With 10 components, the slope resulted 35.9° (p<<0.01), with 15 component it was 34.7° (p<<0.01) and with 20 component the slope was 34.6° (p<<001) On the other hand, results given by Eq.1 and Eq.3 consisted in slopes closer to 45° but gave greater estimation errors. The slope of the regression lines obtained with these methods did not significantly differ from the slope of the measured temperature line, except in the case of Eq.1 applied to temperature computed using 15 components to estimate metabolites (p=0,00017). Results are reported extensively in Table 1. As can be noted from the figures, results obtained using the model proposed by Corbett et al. [25] were the most accurate when dealing with temperatures in the range of soft tissues, i.e. between 37 and 41°C.
Healthy Volunteer Data

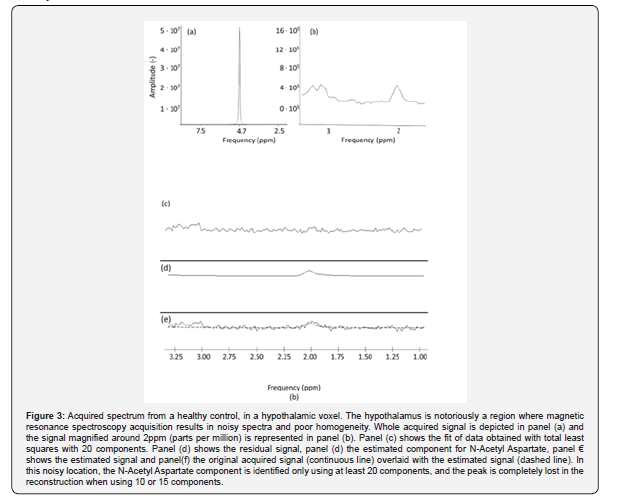
The NAA component was effectively estimated in the posterior cingulum using 10, 15 or 20 components. The chemical shift between water and NAA was 2.633 ppm with a standard deviation of 0.007 ppm. The estimated temperature was 39.37 +/- 0.68 with the method (1) 38.07 +/- 0.52 °C using (2) and 40.4 +/- 0.77 using Eq. (3). The identification of the NAA peak was more difficult when considering the hypothalamic voxel. From the magnified picture of the signal in panel (b) of Figure 3, there is a component with a peak resonance around 2 ppm, which can be identified as NAA. HLTLS with either 10 or 15 components doesn’t allow the quantification of this peak, while the using 20 components it is identified at 2.11 ppm, leading to a temperature of 43.53°C using Eq. 1, 41.27 using Eq.2 and 45.14 using Eq.3
Discussion
The estimation of brain temperature in vivo holds a great clinical interest, since hyperthermia can lead to brain damage, and induced hypothermia has been proposed to reduce the effects of, for example, brain trauma. Moreover, brain temperature is linked with cerebral blood flow, which is altered in various diseases, for example in psychotic disorders [14-19]. An accurate estimation of brain temperature would thus benefit the psychiatric field, since it could mirror the functionality and integrity of blood flow. Various methods have been proposed to estimate non-invasively and in vivo brain temperature, employing MRS. However, there is no consensus on which calibration method is the most accurate in temperature estimation, leading to multiple interpretations. Some authors redefine the parameters to be used for the fit of data, to better match some a-priori hypothesis, for example an assumed brain temperature [28,29], while others [5,6] pick one of the available algorithms without taking the others into account. Such studies would benefit of a clear indication as to which algorithm to choose and of the knowledge of the differences in the estimation due to different parameters, as number of components or points, used in the data processing.
In this work, the three most used calibration techniques for the estimation of in vivo brain temperature using MRS were evaluated. All three methods employed the information obtained from the chemical shift of water, dependent on temperature, and NAA, independent from it. A more recent method [30] which employs the chemical shift of NAA, Creatine and Choline together was not considered, because, even if it leads to more stable results, it is less feasible in clinical settings due to increased difficulties in consistently estimating all three metabolites.
Although the considered algorithms employ the same quantities for temperature estimation, i.e. the chemical shift of NAA and water, the linear fit giving the temperature estimate from the difference in resonance frequencies is slightly different, thus giving different results. These methods were applied to MRS scans, acquired using a phantom at controlled temperatures, simulating hypo- and hyperthermia. In fact, the temperature was brought from 34°C to 44°C and acquired MRS data at each 1°C step.
All three methods estimated temperature with a very high correlation with the measured temperature. The method proposed by Corbett and colleagues resulted in a closer fit with the data used in this work in terms of error, as measured with the sum of squared residuals. Especially in a physiological range of temperatures [38- 41°C], results given by the method proposed by Corbett were very close to the measured temperature. It is to be noted, though, that an offset may be present between phantom and human brain estimated temperature, because of different composition. Thus, it could be argued that it is preferable to estimate brain temperature with a method resulting in a slope of the fit parallel to the slope obtained joining the measurement points, which would mean that once the offset between measurement and estimation is known, the true measured temperature can be inferred. In these terms, the method proposed by Zhu et al. [26] results to be the most accurate of the three. The results from our study suggest that the number of points used to reconstruct the signal and the number of components to be estimated are important parameters to be considered when estimating temperature using MRS.
In fact,
i. There are only slight differences in terms of error, slope and residuals when modifying the number of points used in the HLTLS algorithm which are not likely to influence significantly the temperature estimates.
ii. The number of components instead is critical (Figure 2) and affects the estimates.
Another important point is the reliability of temperature estimation in human data, especially when dealing with noisy signal and with brain areas known to be difficult to analyze with MRS. To this aim, we acquired the spectra in the posterior cingulum and in the hypothalamus for a healthy volunteer. In regions selected because of reliability for MRS, such as the posterior cingulum, , the temperature results in the physiological range. In regions with low signal to noise ratio and poor homogeneity, as the hypothalamus, the estimation of the resonance peaks is more difficult. For the hypothalamus, it was not possible to identify the NAA peak using less than 20 components. This demonstrates that in specific cases more components may be required, even if our results indicate that the temperature estimation results more reliable using 15 components.
Thus, the number of components is clearly a critical issue, and there is a need of balance between overfitting and obtaining spurious peaks as a result when using too many components, and using too few components, which could lead to the risk of not identifying peaks. Another method, instead of rising the number of components, could be the suppression of water after acquisition, via software. While this could lead to the identification of all components, it must be kept in mind that if the estimation of the NAA peak is obtained thanks to the suppression of water using a filter, its resonance frequency results different in respect to that calculated with no suppression. Moreover, it is worth noticing that all data in the same dataset should be evaluated using the same set of parameters in the estimation of the components and of the temperature.
Conclusion
In conclusion, in this work three well-known calibration techniques were compared, and a set of parameters, for the estimation of brain temperature in vivo, with the aim of identifying the nature of the differences in the results and of shedding light on the parameters which come into play in the estimation process. We obtain that, while Cady’s method results in more precision in terms of absolute error, it may be best to adopt xxx, whose regression line resulted parallel to the line obtained for the measured temperatures. This means that increases and decreases in temperature can be precisely estimated, and that the temperature itself is effectively computed, provided the offset is known. Nevertheless, it would be beneficial if future studies would consider these differences and if the community would converge to a method of temperature estimation to be used, with the aim of making comparisons between studies more reliable.
Grant support
This research did not receive any specific grant from funding agencies in the public, commercial, or not-for-profit sectors.
Conflict of Interest
Authors do not have any conflict of interest to disclose
References
- American Psychiatric Association (2013) Diagnostic and Statistical Manual of Mental Disorders, (5th edn.), American Psychiatric Publishing: Arlington, VA, USA.
- Center for Disease Control and Prevention (2014) Prevalence of autism spectrum disorder among children aged 8 years-autism and developmental disabilities monitoring network, 11 sites, United States, 2010. Morbidity and Mortality Weekly Report. Surveillance Summaries 63: 1-21.
- Post-Traumatic Stress Disorder (PTSD) (2018) National Institutes of Mental Health, United States.
- van Steensel FJA, van Bögels SM, Perrin S (2011) Anxiety disorders in children and adolescents with autistic spectrum disorders: A metaanalysis. Clin Child Fam Psychol Rev 14(3): 302–317.
- Mehtar M, Mukaddes NM (2011) Posttraumatic Stress Disorder in individuals with diagnosis of Autistic Spectrum Disorders. Res Autism Spectr Disord 5: 539-546.
- De Bruin EI, Ferdinand RF, Meester S, de Nij PFA, Verheij F (2007) High rates of psychiatric comorbidity in PDD-NOS. J Autism Dev Disord 37(5): 877-886.
- Storch EA, Sulkowski ML, Nadeau J, Lewin AB, Arnold EB, et al. (2013) The phenomenology and clinical correlates of suicidal thoughts and behaviors in youth with autism spectrum disorders. J Autism Develop Disord 43(10): 2450-2459.
- Dell’Osso L, Dalle Luche R, Carmassi C (2015) A new perspective in post-traumatic stress disorder: Which role for unrecognized autism spectrum. International Journal of Emergency Mental Health and Human Resilience 17(2): 436-438.
- Nietlisbach G, Maercker A (2009) Social cognition and interpersonal impairments in trauma survivors with PTSD. Journal of Aggression Maltreatment & Trauma 18(4): 382-402.
- Kerns CM, Newschaffer CJ, Berkowitz SJ (2015) Traumatic childhood events and autism spectrum disorder. J Autism Dev Disord 45(11): 3475-3486.
- Stavropoulos K, Bolourian Y, Blacher J (2018) Differential Diagnosis of Autism Spectrum Disorder and Post Traumatic Stress Disorder: Two Clinical Cases. J Clin Med 7(4).
- Trelles Thorne Mdel P, Khinda N, Coffey BJ (2015) Posttraumatic stress disorder in a child with autism spectrum disorder: Challenges in management. J Child Adolesc Psychopharmacol 25(6): 514-517.
- Morries LD, Cassano P, Henderson TA (2015) Treatments for traumatic brain injury with emphasis on transcranial near-infrared laser phototherapy. Neuropsychiatr Dis Treat 11: 2159-2175.
- Hamblin MR (2016) Shining light on the head: Photo biomodulation for brain disorders. BBA Clin 6: 113-124.


