Discovering Hidden Offshore Lighting Structures with Multiyear Low-Light Imaging Satellite Data
Christopher D Elvidge1*, Tilottama Ghosh1, Namrata Chatterjee1,2, Mikhail Zhizhin1,3 and Morgan Bazilian4
1Earth Observation Group, Payne Institute for Public Policy, Colorado School of Mines, Golden, Colorado, USA
2Department of Geography, University of Denver, Denver, Colorado, USA
3Space Research Institute, Russian Academy of Science, Moscow, Russia
4Payne Institute for Public Policy, Colorado School of Mines, Golden, Colorado, USA
Submission:August 07, 2023;Published:August 14, 2023
*Correspondence author: C D Elvidge, Earth Observation Group, Payne Institute for Public Policy, Colorado School of Mines, Golden, Colorado, USA
How to cite this article:Elvidge CD, Ghosh T, Chatterjee N, Zhizhin M, Bazilian M. Discovering Hidden Offshore Lighting Structures with Multiyear Low-Light Imaging Satellite Data. Oceanogr Fish Open Access J. 2023; 16(4): 555944. DOI: 10.19080/OFOAJ.2023.16.555944
Abstract
The NASA/NOAA Visible Infrared Imaging Radiometer Suite (VIIRS) day/night band (DNB) has a capability to detect lighting present at the earth’s surface. This low-light imaging capability was built to satisfy a requirement from meteorologists to detect clouds at night in the visible based on reflected moonlight. On land, human settlements are the dominant source of DNB detected surface lighting. Lights are also detected offshore primarily arising from fishing boats using lights to attract catch. In 2015, the Earth Observation Group developed the VIIRS Boat Detection (VBD) product and today several fishery agencies use VBD data to monitor fishing activity and compliance with closures. Recently EOG compiled the full record VBD detections as a 15 arc second global grid. The record spans 2012-2021 in Asia and 2017-2021 elsewhere. Upon reviewing the multiyear accumulation of VBD detections we were surprised to find a diversity of previously unseen lighting features [1]. These structures are not evident in VBD from single nights but are only revealed by accumulating the detections across a year or more. The additional features include lit platforms, transit lanes, and vessel anchorages associated with ports and passage straits. Another surprising finding is geopolitical divisions in the density of cumulative vessel detections. In this paper we provide a look into one of the densest areas of VBD detections in the world, from the Yellow Sea, East China Sea and Sea of Japan (East Sea).
Keywords:VIIRS; Day/night band; Vessel detection; Fishing grounds; Light pollution
Abbreviations:DNB: Day/Night band; DMSP: Defense Meteorological Satellite Program; OLS: Operational Linescan System; VIIRS: Visible Infrared Imaging Radiometer Suite; EOG: Earth Observation Group; JPSS: Joint Polar Satellite System; USAID: United States Agency for International Development; VBD: VIIRS boat detection; VMS: Vessel monitoring system; AIS: Automatic Identification System; QF: Quality Flags
Introduction
It has been known since the 1970’s that heavily lit fishing boats can be detected with nighttime visible low-light imaging data collected by polar-orbiting meteorological sensors [2]. The two-sensor series having low-light imaging capabilities include the U.S. Air Force Defense Meteorological Satellite Program (DMSP) Operational Linescan System (OLS) and the NASA/NOAA Visible Infrared Imaging Radiometer Suite (VIIRS). These sensors use light intensification to enable the detection of moonlit clouds at night - to satisfy a requirement from meteorologists for day and night visible and thermal imagery of clouds. The OLS digital archive extends from 1992 to the present and collects relatively coarse resolution (2.7km ground sample distance) global data. The VIIRS sensor provides key improvements [3] in low-light imaging from 2012 to the present and the pixel resolution (742m × 742m) is finer and has in-flight calibration to radiance units. In 2015, the Earth Observation Group (EOG) developed the VIIRS boat detection (VBD) algorithm [4] with support from NOAA’s Joint Polar Satellite System (JPSS) proving ground program and United States Agency for International Development (USAID). The VBD data were produced in near real-time, and the nightly record extends back to April 2012 in Asia and back to 2017 outside of Asia. In addition to the nightly product, the EOG also made monthly and annual summary grids.
Several fishery agencies rely on VIIRS boat detection (VBD) data in monitoring fishing activity and detection of vessels fishing in closures [5] and marine protected areas. This includes the Philippines, Indonesia, Thailand, Japan and South Korea. Maritime domain awareness relies extensively on vessel location data from services such as VMS (vessel monitoring system) and AIS (automatic identification system). Several studies have shown that VBD detects “dark” fishing vessels operating without VMS or AIS [6,7]. In many cases, vessels detected in VBD but lacking signals from VMS or AIS are below the tonnage levels set for the GPS beacons.
In order to define the outlines of fishing grounds and temporal patterns of usage, we produce both monthly and annual summary grids. We recently made a global long-term VBD cumulative detection grid and report here on some of our findings.
Methods
All of the nightly VBD products were ingested in a database which facilitates extractions based on user specified criteria. From the database, EOG produced long term summary grids spanning 2012 to present for Asia and 2017 to present in other parts of the world. Each VBD pixel is labeled based on its sharpness and location. The labels are referred to as quality flags or QF. We built a multiyear cumulative detection grid using QF 1,2,3,8 and 10. This corresponds to the labels of strong, weak, blurry, recurring, platforms and flares [4,8]. The detections were accumulated in a global 15 arc second grid, whose grid cells are approximately half km on a side at the equator. The grids produced include number of detections, number of valid VIIRS observations, and average radiance. The percentage frequency of detection is calculated by dividing the number of detections by the number valid observations. The percentage frequency of detection normalizes for the differences in the number of years of data in Asia and other parts of the world. EOG also developed methods to extract temporal profiles for specific spatial features found in the summary grids.
Results
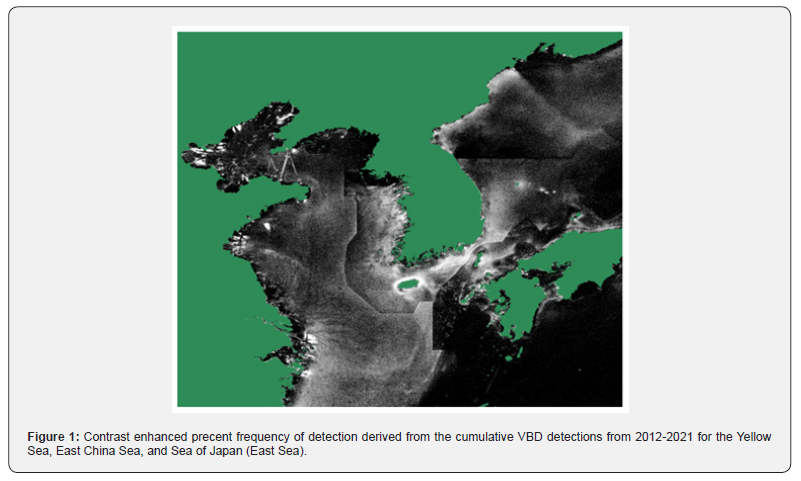
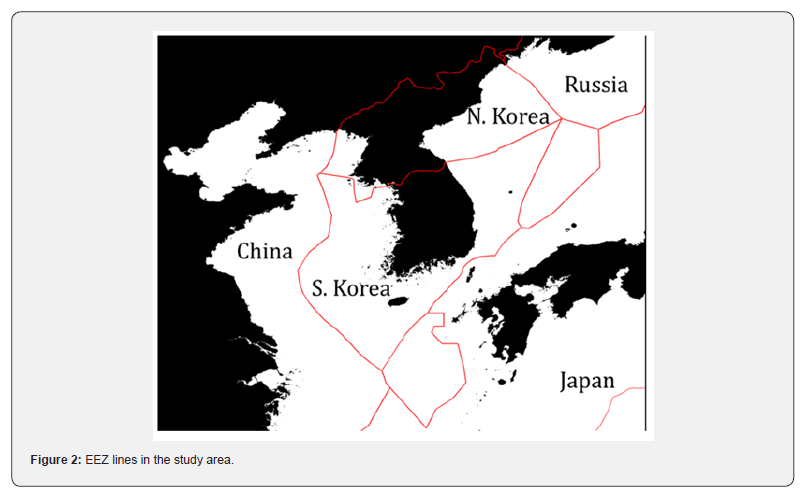
Figure 1 shows the percent frequency of VBD detection for one the densest parts of the world for VBD, the Yellow Sea, East China Sea, and Sea of Japan (East Sea). The fishing grounds show up as large light gray features. In other parts of the world, fishing grounds tend to appear as amorphous clusters. In some cases, fishing vessels operate in international waters and are pressed against the EEZ boundary of a country that prohibits foreign vessel fishing in their EEZ. This is the case in Peru, where international squid fishing boats operate just outside of Peru’s EEZ line. In this area it is possible to see changes in the density of VBD detections along the Japan – South Korea EEZ, the North and South Korea EEZ boundaries, and the EEZ boundary between North Korea and Russia (Figure 2).


This Asia area is unique in the appearance of linear features dividing fishing ground that have no correspondence to EEZ lines. These trace back to bilateral agreements between South Korea with China and Japan with China that permits Chinese fishing boats to operate in other country’s EEZ waters up to the lines visible in the image.
While fishing grounds cover that largest area having VBD detections, the percent frequency of detection for an individual half kilometer grid cell in fishing grounds is small - rarely exceeding 1% over. There are compact clusters of non-fishing VBD features, mostly near shore having higher percent frequencies of detection, in the range of 1-3%. The non-fishing features include anchorages, platforms, and aquaculture. These show up as white on the contrast enhance image in figure 1. Note the large number of vessel anchorages along the shore of China, associated with the export of manufactured products. Another type of feature that can be seen in the northern end of the Yellow Sea are linear features going from port to port. These are passenger ferry transit lanes. The most prominent in this case is the ferry line operating between Dalian and Yantai, China.
Conclusion
The ocean at night is a vast dark palette where any lighting can be readily detected by the VIIRS day/night band. While VIIRS boat detection data are produced nightly, they hold no hint of the sharply defined structures shown in figure 1. The structures are revealed through the lens of time - by accumulating detections over multiple years.
Acknowledgment
The original VBD algorithm development was sponsored by the U.S. NOAA Joint Polar Satellite Program proving ground and the U.S. Agency for International Development.
References
- Elvidge CD, Tilottama G, Namrata C, Mikhail Z (2023) Lights on the Water? Accumulating VIIRS boat detection grids in Southeast Asia spanning 2012 - 2021. Fish for the People 21(1): 33-38.
- Croft TA (1979) The brightness of lights on Earth at night, digitally recorded by DMSP satellite. SRI International 6: 57.
- Elvidge CD, Baugh KE, Zhizhin M, Hsu FC (2013) Why VIIRS data are superior to DMSP for mapping nighttime lights. Proceedings of the Asia-Pacific Advanced Network 35: 62.
- Elvidge C, Zhizhin M, Baugh K, Hsu FC (2015a) Automatic Boat Identification System for VIIRS Low Light Imaging Data. Remote Sensing 7(3): 3020-3036.
- Elvidge CD, Ghosh T, Baugh K, Zhizhin M, Hsu FC, et al. (2018) Rating the Effectiveness of Fishery Closures with Visible Infrared Imaging Radiometer Suite Boat Detection Data. Frontiers in Marine Science p. 5.
- Hsu FC, Elvidge CD, Baugh K, Zhizhin M, Ghosh T, et al. (2019) Cross-Matching VIIRS Boat Detections with Vessel Monitoring System Tracks in Indonesia. Remote Sensing 11(9): 995.
- Park J, Jungsam L, Katherine S, Timothy H, Brian AW, et al. (2020) Illuminating dark fishing fleets in North Korea. Science advances 6(30): eabb1197.
- Elvidge C, Zhizhin M, Baugh K, Hsu FC, Ghosh T (2015b) Methods for Global Survey of Natural Gas Flaring from Visible Infrared Imaging Radiometer Suite Data. Energies 9(1): 14.


