An Analysis on the Pattern of Precipitation Distribution Over Taiwan Strait and its Coastal Areas
Nan Li1*, Xingchao Lv1, Li Gao2, Jiawen Pan3 and Yongjiang Yu4
1 School of Atmospheric Physics, Nanjing University of Information Science and Technology, China
2 Taizhou Meteorological Bureau, China
3Xiamen Meteorological Bureau, China
4 Fujian Institute of Meteorological Science, China
Submission: January 11, 2019; Published: February 04, 2019
*Correspondence author: Nan Li, School of Atmospheric Physics, Nanjing University of Information Science and Technology, Nanjing, China.
How to cite this article:Nan Li, Xingchao Lv, Li Gao, Jiawen Pan, Yongjiang Yu. An Analysis on the Pattern of Precipitation Distribution Over Taiwan Strait and its Coastal Areas. Oceanogr Fish Open Access J. 2019; 9(1): 555753. DOI: 10.19080/OFOAJ.2019.09.555753
Abstract
This article tries to analyze the pattern of rainfall distribution over Taiwan Strait and its coastal areas using long-term Doppler weather radar data based on statistics. According to the statistical results of the reflectivity at 0.5° elevation of Fuzhou weather radar from June to December 2013, the frequency difference of rainfall over two categories of areas can be determined by fuzzy cluster analysis. The identified results show the rare rainfall over the Taiwan Strait and imply the significant adverse effect of cold sea surface on the precipitation.
Keywords: Fuzzy Cluster Analysis; Precipitation Distribution; Statistics; Taiwan Strait; Weather Radar
Abbrevations: EOF: Empirical Orthogonal Function; POD: Probability of Detection; PPI: Plane Position Indicator
Introduction
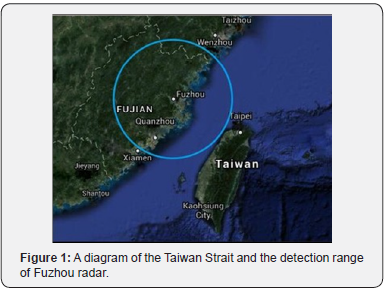
Taiwan Strait as well as its adjacent coastal areas is on the west shore of the Pacific and is influenced strongly by both continental and marine environment. It is also in the transitional zone of the warm and the tropical region, and thus the humidity and the prevailing wind vary with seasons. It is dominated by the subtropical oceanic monsoon climate with abundant rainfall. The west coast of Taiwan Strait mainly includes Fujian Province, and the northeast part of Guangdong Province and the southern part of Zhejiang Province (Figure 1).
The precipitation over Taiwan Strait and its coastal areas has a significant impact on the local economy, transportation and people’s livelihood, and related studies are very important for severe weather monitoring and nowcasting, water balance, hydrological model and climate change. Previous studies mainly used ground-based rain gauge data to implement the research. Chen and Huang [1] analyzed rainfall characteristics of Taiwan Strait based on the observations during 1961 to 1980. The results showed that the annual precipitation was characterized by a larger proportion of precipitation in the east coast than in the west coast and a smallest in Penghu Islands. Yu [2] analyzed the spatial distribution of precipitation and its annual variability in Fujian Province according to the statistical analysis on observations. Lin et al. [3] analyzed the rainfall distribution before the flood season, and they found that the frequency of strong precipitation was closely related to the geography. Wu [4] analyzed the annual and the seasonal precipitation in Fujian Province and the results indicated the north-south variation and the west-east variation. Chang et al. [5] studied the precipitation pattern in Fujian Province using empirical orthogonal function (EOF), wavelet and cross wavelet techniques, and they found a unique pattern and a southeast-northwest pattern. Lin et al. [6] studied the temporal and spatial distribution of typhoon rainfall influencing Fujian Province from 1960 to 2005. The results showed that the precipitation gradually decreased from the coastal region to the northwestern part of Fujian and the maximum appeared in the northeast and the south of Fujian. The high frequency of typhoon torrential rainfall occurred in the coastal and southwest regions of Fujian.
Rain gauges can provide direct and actual amounts of rainfall but can only represent the point distribution of rainfall. In addition, the observation of rain gauges cannot cover vast oceans, deserts and mountain areas. By comparison, weather radars can provide high spatial and temporal resolution data, and they have a much wider observation and can observe rainfall in sparsely populated areas [7]. Statistics on weather radar echoes can reflect features of precipitation and some scholars introduced statistical methods to distinguish between different echoes. Berenguer et al. [8] made statistics on radar echoes to give the possibility of ground clutter based on a fuzzy logic algorithm. Sadouki & Haddad [9] used fuzzy logic approaches to classify echo types and identify ground clutter, and they applied the method to two radars in Algeria and France. Kucera et al. [10] and Krajewski et al. [11] used the probability of detection (POD) as a statistical parameter to analyze patterns of the partial radar beam occultation. Similarly, Gou [12] proposed an idea of identifying partial beam blockage based on probabilistic characteristics of radar echoes.
Regarding the statistics on the radar echo of precipitation, there should be a smaller proportion of precipitation echoes over areas where rainfall does not frequently appear. Conversely, it can be inferred that the areas with a smaller proportion of precipitation echoes are those where rainfall does not frequently appear. Accordingly, statistics on precipitation echoes of radar data and classification techniques can be used to study the pattern of precipitation distribution over Taiwan Strait and its coastal areas.
The Method Based on Statistics and Fuzzy Cluster Analysis
The method uses weather radar data of Plane Position Indicator (PPI) to accomplish the statistics. Because azimuth angles of radials on a PPI of a fixed elevation are inconsistent for different time intervals, all of PPI reflectivity data at the given elevation are resampled on a uniform grid polar coordinate.
A reflectivity threshold Zt is set, and then the times that the reflectivity Z exceeds the given threshold Zt on a grid are counted, i.e.

where N is the number of all effective reflectivity samples appear on the grid. The ratio of the times that Z exceeds Zt on the grid is computed, i.e.

This calculation process is implemented for all grids, and the spatial distribution of P within an analysis range can be obtained.
Based on the spatial distribution of P and under a suitable fixed Zt, grids can be divided into two categories by fuzzy cluster technique. The category with a larger P corresponds to areas where rainfall frequently occurs while the category with a smaller P corresponds to areas where rainfall does not frequently occur.
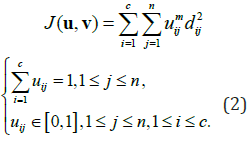
The objective function and the constrains of the fuzzy C-means clustering algorithm are

where c is the number of clusters (c=2), n is the number of the grids, uij is the membership of the j th grid Pj to the ith clustering center vi and dij = ||Pj − vi|| is the Euclidean distance between the grid and the clustering center.
The Identification Results
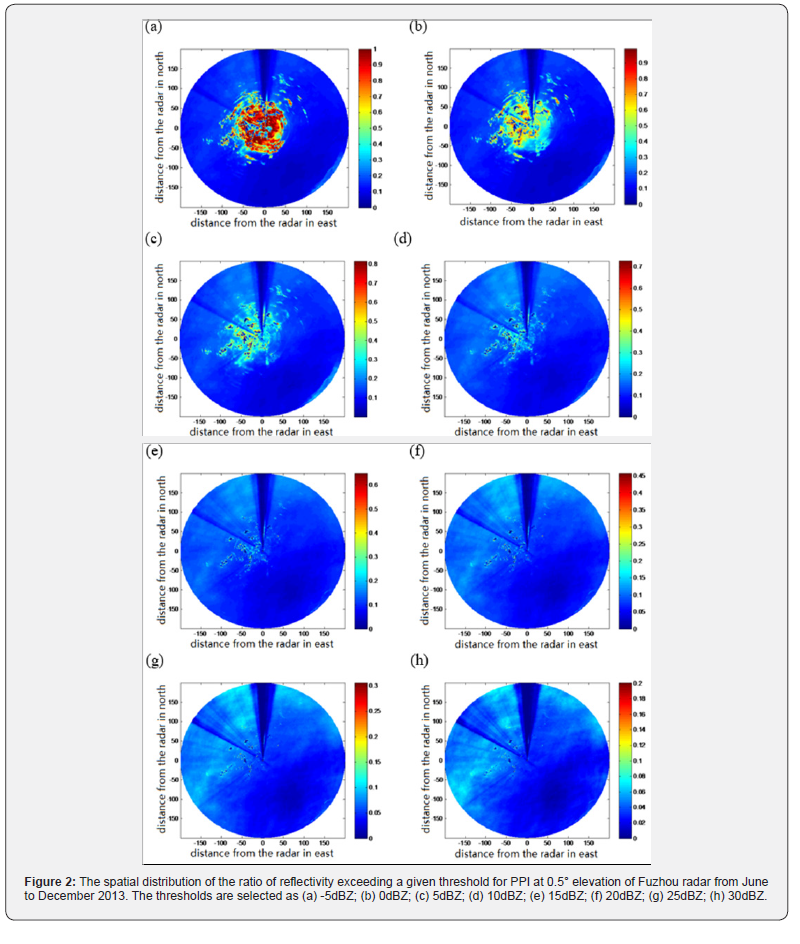
The reflectivity data of China new generation weather radar (CINRAD) in Fuzhou of Fujian province is used to implement the statistical and fuzzy cluster method presented above. The reflectivity is collected at 0.5° elevation of the radar from June to December 2013, altogether 40582 samples, considering that the precipitation analysis usually uses PPI data at the lowest elevation. Fuzhou radar is an S-band CINRAD and is at longitude 119.5°E, latitude 26.0°N, and 650.6m above the sea level (Figure 1). The beam width of the radar is about 1° and the gate length of the reflectivity is 1km, therefore the polar-coordinate grid network for resampling is set to 1°×1 km. The analysis range is set to 200 km, within which echoes are detected over Taiwan Strait and its coastal areas. All the PPI reflectivity data at 0.5° elevation is resampled on the grids of the polar coordinate, and the numbers of samples on each grid are counted for every 5dBZ reflectivity interval. Different reflectivity thresholds Zt are used to calculate the ratios of reflectivity Z exceeding Zt on grids, as shown in Figure 2.

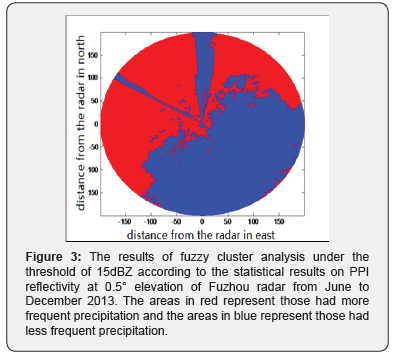
It can be seen from Figure 2 that for different threshold Zt there are areas in the southeast where precipitation did not frequently appear compared with the areas in the northwest. The boundary between the two categories of areas corresponds to the boundary between the land and the sea, and the areas of less frequent precipitation belong to Taiwan Strait. Because the sea surface was usually colder compared with the land surface, the water vapor was more difficult to be evaporated into the atmosphere and thus the rainfall was more difficult to occur over the sea surface of Taiwan Strait. For an appropriate threshold Zt like 15 dBZ (the clear air echoes around the radar station would not influence the identification of precipitation under this threshold), the fuzzy clustering algorithm is used to divide the grids into two categories and the category with a smaller proportion corresponds to areas where rainfall did not frequently occur over Taiwan Strait (Figure 3). This identification may give useful reference for the monitoring and warning of precipitation in related regions. Meanwhile, it should be noted that areas of beam blockage were around 310° and 360° (the azimuth angle of radar detection is calculated clockwise from the north). The radar beam was shaded in these areas due to the topography and thus could not detect echoes or partially detected echoes, also leading to a small proportion.


Conclusion
Weather radars are very helpful for precipitation detection and severe weather monitoring because they can provide highresolution data above large regions. This article attempts to use long-term weather radar data to analyze the precipitation distribution over Taiwan Strait and its adjacent regions. Based on the seven-month PPI reflectivity of Fuzhou radar, areas where the precipitation did and did not frequently appear can be determined by the statistics and the fuzzy clustering technique. The results show that Taiwan Strait is an area of low rainfall due to the cold sea surface. The preliminary work in this article provides a useful idea and method for the study on rainfall distribution and weather monitoring and nowcasting.
References
- Chen G, R Huang (1992) An analysis of the precipitation characteristics in Taiwan Strait. Tropical Geography 12: 178-184
- Yu S (2002) Analysis of precipitation characteristics of Fujian Province. Journal of Heilongjiang Hydraulic Engineering College 29: 24-26.
- Lin X, Z Liu, Y Zou, H Ren, R Zhou (2002) Statistical features of the ultra-short-range precipitation during early rainy season in Fujian Province. Journal of Applied Meteorological Science 13: 469-477.
- Wu B (2005) The trend and regional variation characteristics of precipitation for the past 50 years in Fujian Province. Journal of Guangxi Meteorology 26: 14-15.
- Chang H, J Min, J Gao, Z Deng (2007) On the relation between Asian summer monsoon and rainfall in Fujian Province. Journal of Oceanography in Taiwan Strait 26: 177-187.
- Lin X, F Ren, A Liu, Z Huang, K Liao (2008) Climatic variation features of the typhoon precipitation influencing Fujian for the past 46 years. Journal of Tropical Meteorology 24: 411-416.
- Wilson J, N Crook, C Muelle, J Sun, M Dixon (1998) Nowcasting Thunderstorms: A Status Report. Bulletin of the American Meteorological Society 79: 2079-2099.
- Berenguer M, D Sempere-Torres, C Corral, R. Sánchez-Diezma (2006) A Fuzzy Logic Technique for Identifying Nonprecipitating Echoes in Radar Scans. Journal of Atmospheric and Oceanic Technology 23: 1157-1180.
- Sadouki L, B Haddad (2013) Classification of radar echoes with a textural-fuzzy approach: an application for the removal of ground clutter observed in Sétif (Algeria) and Bordeaux (France) sites. International Journal of Remote Sensing 34: 7447-7463.
- Kucera P, W Krajewski, C Young (2004) Radar beam occultation studies using GIS and DEM technology: An example study of Guam. Journal of Atmospheric and Oceanic Technology 21: 995-1006.
- Krajewski W, A Ntelekos, R Goska (2006) A GIS-based methodology for the assessment of weather radar beam blockages in mountainous regions: two examples from the USNEXRAD network. Computers & Geosciences 32(3): 283-302.
- Gou Y (2014) The Optimization and Evaluation of Quantitive Precipitation Estimation Based on Multi-Radar Mosaic. University of Chinese Academy of Sciences.


