




 ARTOAJ Home



Abstract
Pigmented maize is rich in phenolic compounds, carotenoids, and anthocyanins, which are linked to health-promoting and nutraceutical properties. Consequently, this type of grain is categorized as a functional food due to its high antioxidant activity and its potential preventive roles against cancer, diabetes, obesity, and neurodegenerative diseases. The numerous health advantages of anthocyanins in pigmented maize have recently drawn more attention from consumers. A better understanding of how genes influence anthocyanins is crucial for breeding initiatives aimed at increasing antioxidant levels. This study aimed to analyze the genetic influence on anthocyanin levels in the grain and cob of purple maize utilizing generation mean analysis, for which six generations (P1, P2, F1, F2, BCP1, and BCP2) were developed and planted in a randomized complete block design with three replications at the experimental station of the Facultad de Agronomía, Universidad Autónoma de Nuevo León in Marín, Mexico. A six-parameter model was used to estimate the genetic effects controlling the inheritance of anthocyanins, revealing the significance of all genetic effects for the studied traits in grain and cob, up to varying extents. Additive gene effects appeared to have a greater contribution in the inheritance of total monomeric anthocyanins and cyanidin-3-glucoside in grain and cob, indicating the possibility of making an early generation or recurrent selection, whereas dominant effects had a major contribution to total phenolic content in grain and cob. Moreover, among epistatic effects, the dominance x dominance gene interaction was important for all parameters in grain and cob, suggesting that the selection should focus on a strategy harnessing dominance, such as hybrid development.
Keywords: Additive and Dominance Effects; Epistatic Gene Effects; Cyanidin-3-glucoside; Monomeric Anthocyanins
Introduction
Mexico is the original center for the domestication and diversification of maize, maintaining a broad array of grain colors and traits, including growth speed, height of both plants and ears, physiological attributes, chemical makeup of grains, nutritional benefits, and various uses [1,2]. Consequently, the diversity of maize is primarily found among indigenous communities or ethnolinguistic groups [3]. There is a research bias concerning maize due to its commercial significance, with most investigations on maize grain composition concentrating on yellow and white varieties [4]; studies focusing on pigmented maize have only recently begun to receive attention over the last ten years [5].
Pigmented maize is rich in phenolic compounds, carotenoids, and anthocyanins, which are linked to health-promoting and nutraceutical properties. Consequently, this type of grain is categorized as a functional food due to its high antioxidant activity and its potential preventive roles against cancer, diabetes, obesity, and neurodegenerative diseases [6,7]. Although lutein, zeaxanthin, and α and β cryptoxanthin are the most frequently studied carotenoids in yellow maize [8], cyanidin-3-glucoside (C3G), cyanidin-3,5-diglucoside, pelargonidin, and peonidin-3-glucoside, along with their malonyl derivatives, are the main anthocyanins present in blue, red, and purple grains [9]. Anthocyanins, a kind of naturally occurring phenolic phytochemical found in many food sources, particularly fruits and vegetables, which have a well-established presence in the diet, are produced via the flavonoid pathway in plant tissues [10]. These compounds serve as pigments that display a spectrum of colors, including red, orange, purple, and blue, which depend on pH levels and their chemical structure. The potency of these colors is reliant on the concentration of anthocyanins found in maize grain and cob. Although environmental variables also have a role, genetic factors are the main determinant of this pigment’s occurrence [11]. Reports state that water-soluble anthocyanins, reddishpurple pigments found in a range of fruits and vegetables [12,13], as well as phytochemicals and antioxidants, are abundant in purple maize and its byproducts, including cobs, grains, silk, and husks [14]. Growing consumer demands may be met by maize, a scalable crop that might provide a natural supply of colorant [15]. However, large-scale commercial production will require breeding lines with the stability, color, and maximal anthocyanin production while maintaining yield and other agronomic qualities [12]. Finding lines that produce the most anthocyanins and have ideal anthocyanin profiles to backcross into existing elite inbreds will be necessary to achieve these objectives. Selections need to be made with every backcrossing cycle to minimize linkage drag without compromising any elements linked to anthocyanin synthesis. Backcrossing with non-pigmented lines may cause a variety of structural genes and regulatory systems necessary for anthocyanin production to become unfixed. The advantage of creating genetic resources to aid in breeding is demonstrated by the fact that losing any one of these elements might have varied effects on anthocyanin output.
To develop the best breeding practices for enhancing the desired trait, plant breeders are interested in assessing gene effects [16]. Thus, breeders require knowledge of heritability, heterosis, inbreeding depression, predictability of genetic gain from selection for yield, and the mechanism of gene action [17]. Designing a suitable breeding process for genetic improvement requires an understanding of genetic behavior and the type of gene activity that governs nutraceutical properties [18,19]. Because quantitative characteristics are influenced by interactions between genes as well as between genotype and environment, in addition to the minor individual impacts of numerous genes, the inheritance of these traits has been characterized as a shifting target [20]. To study how certain features are inherited, genetic statistical models have been developed. Among these models, generation means analysis is a helpful method for estimating the effects of genes, variance components, and heritability-regulating characteristics of interest [21,22]. It provides information on the relative significance of dominance deviations, effects from non-allelic genetic interactions, and the average impact of genes (additive effects) in determining the genotypic values of individuals and, in turn, the mean genotypic values of families and generations [23]. A helpful method for estimating the impact of genes on quantitative variables, such as yield and yield components, is generation mean analysis. Estimating the three different forms of epistatic gene effects—additive × additive, additive × dominance, and dominance × dominance—has several advantages [24]. This approach facilitates understanding of the performance of selected parents and the potential of their progeny for use in pedigree selection or heterosis exploitation [25]. Numerous studies have documented the genetic pathways that control maize production, yield characteristics, and agronomic qualities [26-28]. On the other hand, data on the amounts of anthocyanins in maize cobs and grains are quite rare. This research was conducted to evaluate the relative importance of additive and non-additive gene effects in regulating the inheritance of anthocyanin and its derivatives in purple maize grain and cob.
Materials and Methods
Plant material
This study utilized two native genotypes of maize (purple and white) gathered from farmers in San Luis Potosí and Hualahuises, Nuevo León, Mexico. The experiment was conducted at the experimental field of the Facultad de Agronomía, Universidad Autónoma de Nuevo León, in Marín, Mexico (located at 24°19’16.71”N and 99°54’58.06” W).
Field management
The original native populations, Morado San Luis Potosí (purple grain and cob) and Blanco Hualahuises (white grain and cob), served as the genetic basis for the creation of backcrosses (BCP1, BCP2), F1 hybrids, and inbred lines. The parents were the inbred lines of purple maize (P1) and white maize (P2). Both parents were crossed to develop the F1 generation, which was then self-pollinated to produce the F2 generation. The F1 seeds were subsequently backcrossed with both parental lines to generate backcrosses (BCP1 and BCP2). Therefore, in March 2025, the six populations were set up in the field using a random complete block design with three replications. The genetic homogeneity of each generation determined the size of the experimental units. The experimental units were two rows for the non-segregating generations (P1, P2, and F1) and five rows for the F2 generation. Four rows were utilized for backcrosses. The row length was 5 m, with 0.8 m and 0.25 m between rows and plants, respectively. For the parents, F1, and backcross generations, adjacent plants in each plot were manually pollinated to prevent contamination from stray pollen. For the F2 generation, individual self-pollination was performed. When they reached maturity, cobs were handpicked. Maize ears with a moisture level of less than 14% were allowed to air dry. Before being ground into whole-grain flour and cob powder, samples of cob from the parental and F1 generations were first hand-shelled into grain and cob. Samples were then bulked within replications in each generation. Additionally, the F2 and first backcross cob samples were hand-shelled and ground into a fine powder. Before examination, all ground materials were thoroughly mixed, sieved through a 30-mesh screen, and stored at -20°C.
Data collection
Total phenolic content
A colorimetric technique based on the Folin-Ciocalteau reagent reaction was employed to measure the total phenolic content, following the methodology of Rodriguez-Salinas et al. [29]. After oxidizing with 0.2 mL of Folin-Ciocalteau reagent and neutralizing with 2 mL of a 7% Na2 CO3 solution for 5 minutes, 2 mL of the phenolic extract was combined with 2.6 mL of distilled water. The samples’ absorbance at 750 nm was ultimately measured when the process was halted after 90 minutes. The results were expressed as milligrams of gallic acid equivalent per 100 grams of sample, using 0, 40, 80, 120, 160, and 200 mg L-1 of gallic acid as a reference for the calibration curve (mg GAE 100 g-1).
Total monomeric anthocyanin content
Sample extraction
Anthocyanins extraction was performed using the protocol of Lao & Giusti [30] with some modifications. A 200 mg sample of powdered corn kernels was taken, and 10 mL of 70% aqueous acetone acidified with 0.01% (v/v) 6-N HCl was added. The samples were purged with nitrogen at 4 oC for 30 seconds and stirred for 30 minutes. The solution was filtered using Whatman No. 4 filter paper. 10 mL of chloroform was added, and the samples were allowed to stand overnight. The colored upper phase was collected the next day and placed on a rotary evaporator at 40 oC under vacuum to remove any remaining acetone. Finally, the remaining extract was topped up to the known volume with water acidified with 0.01% HCl.
Quantification by the pH differential method
For the pH differential method, a protocol by Yang & Zhai [31] was followed. In this method, the absorbance of purple maize pigments diluted in buffer at pH = 1.0 (0.025 M potassium chloride) and pH = 4.5 (0.4 M sodium acetate) was measured at a wavelength of maximum absorbance (around 520 nm) and 700 nm using a DLAB SP-UV1100 spectrophotometer (DLAB Scientific, Beining, China). The total monomeric anthocyanin was calculated using the molecular weight of cyanidin-3-glucoside (449.2) and its molecular absorptivity of 26,900 in an aqueous buffer solution. The measurement was performed in triplicate. The anthocyanin content of each sample was calculated using the following equation:

Where,
C = Anthocyanin concentration.

MW = Molecular weight of cyanidin 3-glucoside (449 g M-1).
DF = Dilution factor.
V = Final Volume.
ε = Molar absorptivity of cyanidin 3-glucoside (25,965 cm-
1 M-1).
l = 1 cm path length
Quantification of anthocyanins by HPLC
Anthocyanins (Cyanidin-3-glucoside) quantification was performed based on the methodology described by Rodriguez- Salinas et al. [29], on an Agilent Technologies 1260 Infinity HPLC with an Agilent 1260 diode array detector (DAD) (G4212B) and an Agilent 1260 quaternary pump (G1311B), with a ZORBAX Eclipse Plus C-18 reversed-phase analytical column (100 mm x 3 mm i.d., 5 μm). The mobile phase was 4.5% acidified water with formic acid (solvent A) and acetonitrile (solvent B). The gradient used was as follows: 0-1 min, 97% A and 3% B; 1-51 min, 60% A and 40% B; 51-53 min, 50% A and 50% B; 53-60 min, 97% A and 3% B. The post-run time was 5 min. The flow rate used was 0.8 mL min-1 with a 50 μL injection, and the wavelength was monitored at 520 nm. The spectrum of the compounds was obtained in the UV region (200-400 nm). Cyanidin-3-glucoside in the samples was identified by comparing its relative retention time with that of the standard compound.
Statistical Analysis
This study employed a randomized complete block design. The normality of the repeated data was evaluated by the Shapiro- Wilk test. Following the normal distribution, the data were then submitted to a two-way analysis of variance (ANOVA) using Statistix 10 software (Analytical Software, FL, USA). The mean comparison was determined using the Tukey test (p ≤ 0.05).
Generation mean analysis (GMA) was carried out individually for each trait to identify the type of gene action influencing their expression. To assess the suitability of the additive-dominance model and determine the existence of epistatic effects, scaling tests A, B, C, and D were employed, as outlined by Hayman & Mather [32]. Epistasis was present if one or more of the scales were significant. The genetic parameters, namely mean [m], additive gene effects [a], dominance gene effects [d], and three types of non-allelic gene interactions, namely additive x additive [aa], additive x dominance [ad], and dominance x dominance [dd], were thus estimated using the six-parameter genetic model proposed by Mather & Jinks [21]. The significance of the above genetic parameters was tested using the t-test. First, the standard error was worked out for each component separately by taking the square root of the variance of the respective element. The significance of the genetic effect was tested similarly using the t-test as in the case of the scaling test. All computations for the generation mean analysis were conducted using the Microsoft Excel software.
Results
The analysis of variance (ANOVA) revealed that the impact of different generations on all parameters studied was statistically significant (p ≤ 0.05), as shown in Table 1.
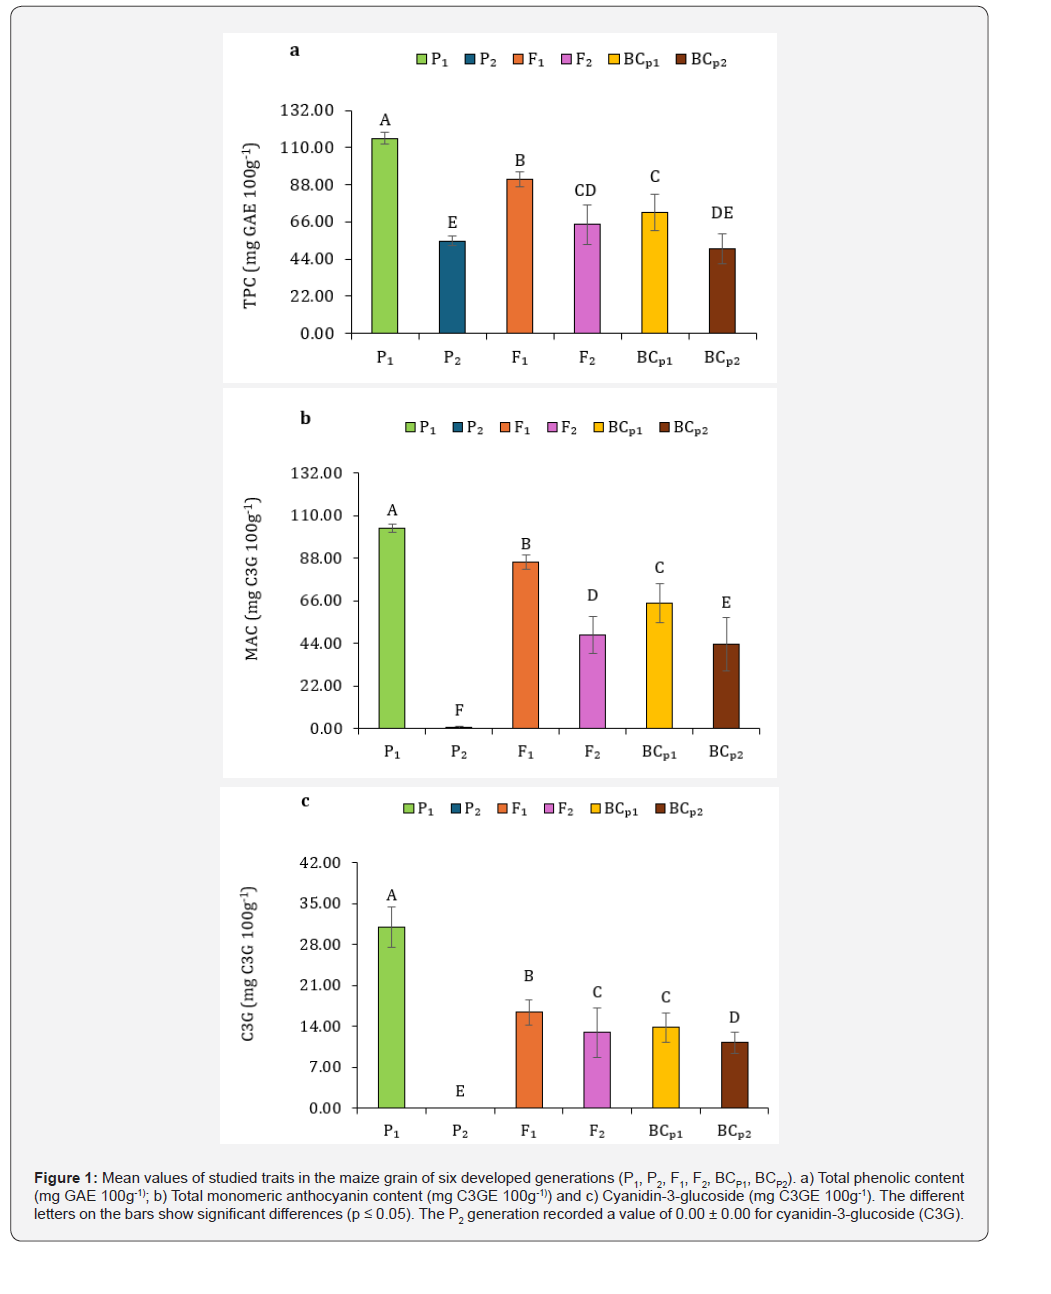
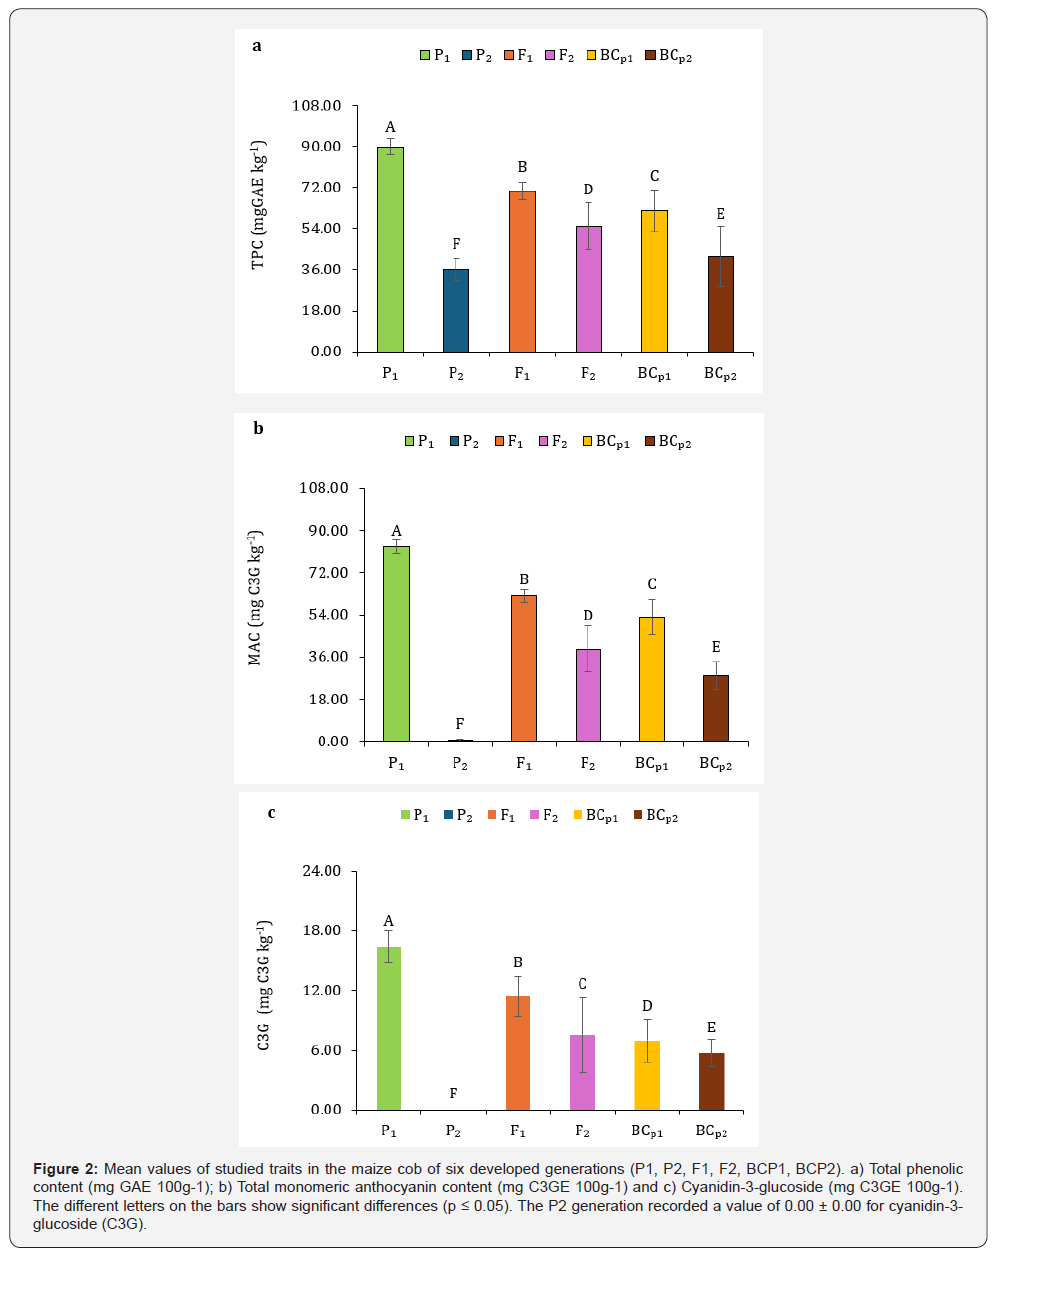
The maximum total phenolic content of 115.41 ± 2.46 in grain and 89.71 ± 2.34 in cob was recorded in purple maize corn. In contrast, the white maize genotype had the minimum total phenolic content of 54.74 ± 2.85 and 36.08 ± 2.91 in grain and cob, respectively (Figure 1a & 2a). The average total phenolic content for the F1 generation of maize grain and cob was 91.31 ± 2.64 and 70.41 ± 3.88 mg GAE 100g-1 DW, respectively, representing increases of 7% and 11% over the mid-parent values. In contrast, the average total phenolic content for the F2 generation of maize grain and cob, measured at 64.38 ± 8.51 and 54.84 ± 9.25 mg GAE 100g-1 DW, respectively, represented reductions of 32% and 15% compared to the mid-parent averages. The average values for the backcrosses were either situated between those of the F1 generation and the first backcross generation with a white parent, or they fell below the averages of the F1 and F2 generations for both grain and cob. Conversely, the backcross that included the F1 and the first backcross generation with a purple parent surpassed the average values of the F2 generation for both grain and cob (Table 2). These findings suggest that dominance deviations have a lesser influence. In contrast, additive effects have a more significant impact on the total phenolic content in the purple maize grain and cob.
The maximum total monomeric anthocyanin content of 103.53 ± 2.02 in grain and 82.83 ± 2.94 in cob was recorded in purple maize; meanwhile, the white maize genotype had the minimum total monomeric anthocyanin content of 0.39 ± 0.58 and 0.22 ± 0.58 in grain and cob, respectively (Figure 1b & 2b). The average total monomeric anthocyanin content in the F1 generation of maize grain (85.83 ± 3.67 mg CGE 100g-1 DW) exceeded the mid-parent value by 39%; similarly, the maize cob (62.01 ± 2.65 mg CGE 100 g-1 DW) was 33% higher than the mid-parent figure. In the F2 generation, the average total monomeric anthocyanin content for maize grain and cob (48.43 ± 8.53 and 39.35 ± 8.76 mg CGE 100g-1 DW, respectively) showed a 7% and 6% decrease compared to the mid-parent values. The means of the backcrosses fell between those of the F1 and the recurrent parents or were lower than the means for both the F1 and F2 generations in terms of grain and cob (Table 2). These findings suggest that the effects of additive variance and dominance deviations on total monomeric anthocyanin content in purple maize grain and cob vary in their relative significance.
The maximum cyanidin-3-glucoside of 30.92 ± 1.43 in grain and 16.35 ± 1.59 in cob was recorded in purple maize (Figure 1c & 2c). The average concentration of cyanidin-3-glucoside in the F1 generation of maize grain (16.38 ± 1.21 mg 100g-1 DW) was 6% greater than the mid-parent value, while in the maize cob (11.37 ± 2.02 mg 100g-1 DW), it was 28% above the mid-parent value. For the F2 generation, the average cyanidin-3-glucoside in maize grain (12.96 ± 5.25 mg 100g-1 DW) was 19% lower than the mid-parent value; likewise, in the maize cob (7.56 ± 3.75 mg 100g-1 DW), it was 8% lower than the mid-parent value. The means of both backcrosses fell between the values of the F1 and the recurrent parents or were lower than the means recorded for the F1 and F2 generations in both grain and cob (Table 2) (Figure 2).

Note: *indicates significance levels at p ≤ 0.05.

Note: P1= Morado San Luis Potosí; P2= Blanco Hualahuises; F1= First filial generation of crossing between parents; F2= Second filial generation of crossing; BCP1= First backcross between F1 and P1; BCP2= First backcross between F1 and P2; TPC= Total phenolic content; MAC= Monomeric anthocyanin content; C3G= Cyanidin-3-Glucoside. Values within the same column sharing different letters are indicated as significantly different (p ≤ 0.05).

Note: Note: m: mean effect; [a]: additive effect; [d]: dominance effect; [aa]: additive x additive effect; [ad]: additive x dominance effect; [dd]: dominance x dominance effect. *Significance from zero at p ≤ 0.05. N.S.: non-significant.


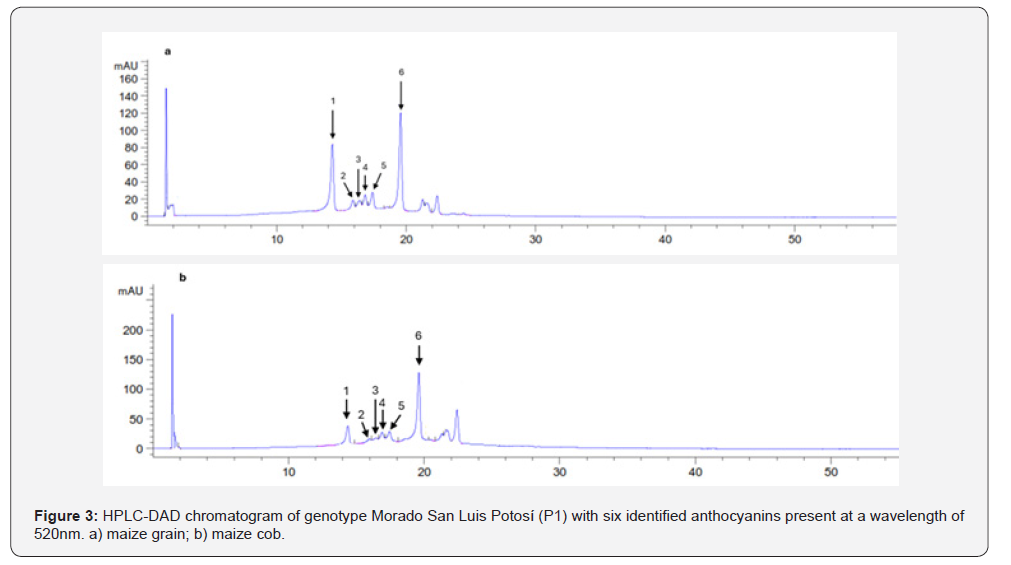
Note: 1: Cyanidin-3-glucoside (C3G); 2: Pelargonidin-3-glucoside (Pg3G); 3: Cyanidin-3-malonylglucoside (C3MG); 4: Cyanidin-3-malonylglucoside (C3GM); 5: Peonidin-3-glucoside (Pn3G); 6: Cyanidin-3-(6”-malonylglucoside) (C3-6’MG). The P2 generation was omitted from the data presentation because it had a value of 0.00 for both grain and cob.
Genetic Effects
In the F1 generation, utilizing purple-colored grains and cobs from a female parent and white-colored grains and cobs from a male parent resulted in progeny that all exhibited purple-colored grains and cobs. This outcome implies that the inheritance of purple maize coloration is primarily maternal. The color of the grains and cobs in the F2 generation varied from white to purple, displaying various intensities, which made it challenging to classify them into specific categories. The observed segregation pattern did not align with a single-gene or two-gene model, but rather displayed continuous variation, indicating that it follows a quantitative inheritance pattern. Additionally, the grain color within backcross generations leaned towards one of the parents. This suggested that the changes (whether an increase or a decrease) in color tendency depend on the selection of the P1 parent.
There is a strong interest in breeding maize with higher levels of anthocyanins due to their potent antioxidant properties and associated health benefits. To enhance anthocyanin levels through traditional hybrid breeding approaches, it is essential to comprehend the genetic influences associated with anthocyanins. One implication of the varying gene influences on selecting a breeding methodology is that the resulting hybrid, from crossing with a high parent, is anticipated to increase anthocyanin levels in maize due to prevailing additive gene effects. The model was expanded to include six parameters, demonstrating a good fit to the data.
The inheritance of various traits was significantly influenced by additive [a], dominance [d], and epistasis, highlighting the importance of both additive and dominance effects (Table 3). For total phenolic content in grain, the significant gene effects included additive [a] (21.23 ± 2.22), dominance [d] (46.91 ± 8.18), additive × additive [aa] (-14.07 ± 7.90), additive × dominance [ad] (-9.10 ± 8.82), and dominance × dominance [dd] (525.35 ± 11.82). In the case of cob, the significant gene effects were additive [a] (19.87 ± 2.44), dominance [d] (34.46 ± 8.65), and dominance × dominance [dd] (406.51 ± 13.12). Regarding monomeric anthocyanin content, all gene effects, including additive [a], dominance [d], and the three epistatic effects, were significant for total monomeric anthocyanin content in cob. In contrast, the additive x additive [aa] gene effect was found to be non-significant in grain.
Notable epistatic gene influences were detected for all traits in both maize grain and cob, although to varying extents (Table 3). For cyanidin-3-glucoside in the maize grain, all three types of epistatic effects—additive × additive [aa] (-12.95 ± 7.08), additive × dominance [ad] (-3.01 ± 8.12), and dominance × dominance [dd] (105.47 ± 10.49)—were significant. In contrast, in the maize cob, the dominance × dominance [dd] [64.23 ± 11.58] epistatic effect was the most prominent.
Identification of anthocyanins by HPLC-DAD
In the analysis of anthocyanin extraction and purification, chromatograms recorded at 520 nm revealed the presence of six glycosylated anthocyanins in the grain and cob of the pigmented maize genotype. The first peak is identified as cyanidin-3- glucoside, while the second peak corresponds to pelargonidin-3- glucoside. The third peak represents cyanidin-3-malonylglucoside, and the fourth is an isomer of cyanidin-3-malonylglucoside. The fifth peak is attributed to peonidin-3-glucoside, and the sixth peak is identified as cyanidin-3-(-6”-malonylglucoside) (Figure 3).
These six identified compounds were quantified, with the findings expressed in mg C3GE 100g-1 DW for genotype Morado San Luis Potosí in grain and cob, as shown in Table 4. In Table 5, the six identified anthocyanin compounds are quantified and presented for each generation in both grain and cob.
Discussion
The glycosylated anthocyanins observed in the chromatograms of the six generations of maize grain and cob align with the order of detection as noted by Lao & Guisti [30]. The differences in retention times are primarily attributed to adjustments in the methodology and conditions applied, which are influenced by the column length utilized in this research.
The ANOVA indicated significant differences in means for total phenolic content, total monomeric content, and cyanidin-3- glucoside in both grain and cob across all four crosses, suggesting a considerable level of genetic variability for all traits examined among the segregating populations derived from contrasting parental lines. This study observed a downward trend in the average values of all traits assessed in maize grain and cob across the four crosses, except the F1 generation, where a rise was noted compared to the mid-parent value in both grain and cob. Oladipo & Abe [33] found a 7% increase in total phenolic content in the F1 generation, while a 3% decrease was noted in the F2 generation compared to the mid-parent value in maize. Moreover, a separate study by Pfeiffer & Rooney [34] in sorghum reported increases of 25% and 15% in total phenolic content for F1 and F2, respectively, compared to the mid-parent value. In contrast to our findings, Noubissié et al. [35] observed a 5% reduction in mean phenolic content in the F1 generation relative to the mid-parent value. Previous studies assessed mean values from backcrosses between the F1 and recurrent parents, which were lower than those of the F1 and F2 generation means. Regarding total monomeric anthocyanin content, both grain and cob showed an increase in the F1 means. A decrease in the F2 mean is aligned with the findings of Harakator et al. [36], who noted increases of 38% and reductions of 30% in mean total monomeric anthocyanins for F1 and F2, respectively, in maize cob, while in maize grain, reductions of 15% and 80% were recorded for F1 and F2 means, respectively. Our analysis revealed that mean cyanidin-3-glucoside levels in the F1 generation exceeded the mid-parent value for both grain and cob, whereas a decline was seen in the F2 generation. Harakator et al. [36] found decreases of 28% and 25% in cyanidin-3-glucoside concentrations in the grain for F1 and F2 generations, respectively. For maize cob, they reported an increase of 45% and a decrease of 18% in F1 and F2 generations, respectively. These findings highlight the differing relative influences of additive effects and dominance deviation on cyanidin-3-glucoside levels in purple maize grain and cob. Additionally, the variances observed in the parents and F1 generation were minimal, suggesting a consistency in this anthocyanin derivative across these generations.
Epistasis refers to any non-allelic interaction [37,38].
In this context, a thorough understanding of gene actions and interactions can facilitate the selection of breeding strategies that effectively leverage genetic variance, which can also assist in interpreting the influence of breeding systems on crop evolution [39]. The presence of notable epistasis can distort the estimation of variance components. For instance, polygenic inheritance models featuring a wide range of allelic interactions can lead to underestimations or overestimations of heritability, primarily of the narrow-sense type, which may further result in additional inaccuracies in predicted gains. Generation mean analysis incorporates several foundational generations from crosses between two inbred lines and provides estimates for epistatic effects. To evaluate these effects, we utilized the six-parameter model proposed by Hayman [40] in our current study, we applied it to analyze four crosses. In our results, we observed a higher magnitude of additive effect for monomeric anthocyanin content and cyanidin-3-glucoside in both grain and cob, compared to the dominance, indicating the gene correlation. In other words, we can say that one parent had genes with high performance, whereas the other one had genes with low performance. For the total phenolic content in grain and cob, dominant effects were greater than additive ones, indicating the use of hybrid development to harness heterosis. Significant additive and dominance genetic effects were consistently observed for all examined traits across all four crosses, suggesting that both additive and non-additive genetic effects substantially influence the inheritance of genes related to phenolic content, monomeric anthocyanin content, and cyanidin-3-glucoside in maize grain and cob. Our findings demonstrated that all three epistatic effects were significant for each trait analyzed in grain; however, for cob, the total phenolic content exhibited non-significant additive x additive and additive x dominance interactions, while the additive x additive interaction was non-significant for cyanidin-3-glucoside. Similar findings were documented by Pfeiffer & Rooney [34], who reported that additive, additive × dominance, and dominance × dominance gene effects significantly contributed to the inheritance of total phenols in black sorghum, whereas, unlike our results, Oladipo & Abe [33] indicated that all gene effects were non-significant for total phenolic content in maize. Harakator et al. [36] noted the existence of additive, dominance, and all three epistatic gene effects for cyanidin-3-glucoside in grain and for monomeric anthocyanin content in cob. They found a non-significant additive x additive effect for monomeric anthocyanin content in grain and a non-significant additive x additive and additive x dominance effect for cyanidin-3-glucoside in cob.
It is crucial to recognize that the negative dominance value observed for total monomeric anthocyanin content and cyanidin-3- glucoside in both grain and cob signifies that this gene effect tends to reduce anthocyanin levels, depending upon the selection of the parental line designated as P1. The sign of the dominance effect correlates with the mean value of the F1 generation in relation to the mid-parent value, indicating that alleles from the parental line with high anthocyanin content (Morado San Luis Potosí) played a significant role. Similar findings were presented by Harakator et al. [36]. The predominance of dominance [d] and dominance × dominance [dd] epistatic effects for the total phenolic content, total monomeric anthocyanin content, and cyanidin-3-glucoside in both purple maize grain and cob suggests that the expression of these traits is primarily governed by genes exhibiting dominance characteristics. Furthermore, the significance of dominance and its epistatic effects on these traits in maize grain and cob suggests that breeding and selection strategies for purple maize could be adapted to take advantage of this dynamic epistatic effect by postponing selection to subsequent generations, thereby stabilizing additive genes. This breeding strategy can preserve larger populations before selection, maximizing chances for favorable gene combinations to emerge [41]. The dominance × dominance [dd] epistasis was found to contribute to the levels of anthocyanin and its derivatives, which aligns with expectations, given that the F1 generation exhibited substantial heterosis. In contrast, additive × additive [aa] and additive × dominance [ad] epistatic effects showed no contribution to heterosis activity. This finding offers valuable insights for corn breeders seeking to enhance populations or hybrids with higher levels of anthocyanin and its derivatives. Duplicate gene interaction in the form of epistatic effects was evident for all traits in both maize grain and cob, displaying contrasting signs for the estimates of dominance [d] and dominance × dominance [dd] effects. The contrary signs between additive [a] and additive × additive epistatic effects for cyanidin-3-glucoside in the maize grain imply that there exists an oppositional nature in the interactions of these traits (Table 3). Epistatic effects and linkage can enhance dominance, leading to partial dominance that may appear as pseudo-overdominance [42,43]. These findings are based on a single growing season and may be subject to some bias due to environmental factors and their interactions, necessitating further research. Nonetheless, prior studies have indicated that genotype represents the primary source of variation in anthocyanin levels in colored maize germplasm [44].
Conclusion
In this research, the genetic factors influencing the inheritance of total phenolic content, anthocyanin, and its derivatives were examined in the six fundamental generations resulting from a cross between purple and white maize. To summarize, the majority of additive [a], dominance [d], and interaction effects were found to be significant for all traits analyzed in both the maize grain and cob. These findings highlight the crucial role of additive [a], dominance [d], and epistatic gene actions in governing the inheritance of anthocyanin levels in purple maize. Given the strong presence of nonadditive gene effects found in this study for all traits in the grain and cob, it was concluded that the selection process in maize could be altered to stabilize additive genes by postponing selection until subsequent generations. Furthermore, the most effective method to elevate anthocyanin levels to their maximum potential is to utilize inbred lines with purple kernels and cobs as the maternal parent for creating purple-hued hybrid maize. In cases of duplicate epistasis identified in the inheritance of all observed traits, employing a combination of various breeding strategies that ensure the accumulation and stabilization of favorable alleles—such as recurrent selection and selection from early to advanced generations—would be essential for enhancing these traits.
Acknowledgement
This work has been financially supported by CONAHCYT through a scholarship given to the first author, Saba Yasin (CVU: 1193352), for a PhD program at the Facultad de Agronomía, Universidad Autónoma de Nuevo León. The funding source is not involved in the study’s execution or the publication’s submission.
References
- Amanjyoti, Singh J, Sowdhanya D, Rasane, P, Singh J, et al. (2024) Maize. In: Singh J, Kaur S (Eds.), Cereals and nutraceuticals. Springer International Publishing, pp. 47-80.
- Li J (2024) The Spread of Maize from Southern Mexico: Genetic and Archaeological Perspectives. Maize Genomics Genet 15(2): 80-92.
- Curry HA (2021) Taxonomy, race science, and Mexican maize. Isis 112(1): 1-21.
- Kaul J, Jain K, Olakh D (2019) An overview on role of yellow maize in food, feed and nutrition security. Int J Curr Microbiol Appl Sci 8(02): 3037-3048.
- Magaña-Cerino JM, Peniche-Pavía HA, Tiessen A, Gurrola-Díaz CM (2020) Pigmented maize (Zea mays) contains anthocyanins with potential therapeutic action against oxidative stress-a review. Pol J Food Nutr Sci 70(2): 85-99.
- Sánchez-Nuño YA, Zermeño-Ruiz M, Vázquez-Paulino OD, Nuño K, et al. (2024) Bioactive compounds from pigmented corn (Zea mays) and their effect on health. Biomolecules 14(3): 338.
- Navarro A, Torres A, Fernández-Aulis F, Peña C, (2018) Bioactive compounds in pigmented maize. In: Amanullah, Fahad S (Eds.), Corn-production and human health in changing climate. IntechOpen, pp. 69-91.
- Prasanthi PS, Naveena N, Vishnuvardhana-Rao M, Bhaskarachary K (2017) Compositional variability of nutrients and phytochemicals in corn after processing. J Food Sci Technol 54(5): 1080-1090.
- Colombo R, Ferron L, Papetti A (2021) Colored corn: An update on metabolites extraction, health implication, and potential use. Molecules 26(1): 199.
- Pervaiz T, Songtao J, Faghihi F, Haider, MS (2017) Naturally occurring anthocyanin, structure, functions and biosynthetic pathway in fruit plants. J Plant Biochem Physiol 5(2): 1-9.
- Enaru B, Drețcanu G, Pop TD, Stǎnilǎ A, Zorita D (2021) Anthocyanins: Factors affecting their stability and degradation. Antioxidants 10(12): 1967.
- Chatham LA, Juvik JA (2021) Linking anthocyanin diversity, hue, and genetics in purple corn. G3 11(2): jkaa062.
- Nawaz H, Muzaffar S, Aslam M, Ahmad S (2018) Phytochemical composition: antioxidant potential and biological activities of corn. in: Amanullah, Fahad, S., (Eds.), Corn-production and human health in changing climate. IntechOpen, pp. 49-68.
- Zhu F (2018) Anthocyanins in cereals: Composition and health effects. Food Res Int 109: 232-249.
- Chatham LA, Paulsmeyer M, Juvik JA (2019) Prospects for economical natural colorants: insights from maize. In: Snowdon R (Ed.), Theoretical and Applied Genetics. Springer International Publishing, pp. 2927-2946.
- Carvalho IR, Szareski VJ, Mambrin RB, Ferrari M, et al. (2018) Biometric models and maize genetic breeding: A review. Aust J Crop Sci 12(11): 1796-1805.
- Begna T (2021) Combining ability and heterosis in plant improvement. Open J Plant Sci 6(1): 108-117.
- Benavente E, Giménez E (2021) Modern approaches for the genetic improvement of rice, wheat and maize for abiotic constraints-related traits: a comparative overview. Agronomy 11(2): 376.
- Manimurugan C, Zanwar A, Sujatha M (2023) Genetic enhancement of nutraceuticals in linseed: breeding and molecular strategies. In: Kole C (Ed.), Compendium of crop genome designing for nutraceuticals. Springer Singapore, pp. 519-543.
- Mackay TF, Anholt RR (2024) Pleiotropy, epistasis and the genetic architecture of quantitative traits. Nat Rev Genet 25(9): 639-657.
- Mather K, Jinks JL, (1982) Components of means: additive and dominance effects. In: Mather K, Jinks JL (Eds.), Biometrical genetics: The study of continuous variation. Chapman and Hall Ltd, pp. 65-81.
- Kearsey DM, Pooni DH (1996) Basic generations-means. In: Kearsey DM, Pooni DH (Eds.). Genetical Analysis of Quantitative Traits. Garland Science, pp. 18-37.
- Said AA (2014) Generation mean analysis in wheat (Triticum aestivum ) under drought stress conditions. Ann Agric Sci 59(2): 177-184.
- Pujar M, Govindaraj M, Gangaprasad S, Kanatti A, Gowda TH, et al. (2022) Generation mean analysis reveals the predominant gene effects for grain iron and zinc contents in pearl millet. Front Plant Sci 12: 693680.
- Abd El-Aty MS, El-Hity MA, Abo Sen TM, El-Rahaman IAA, AI-Farga A, et al. (2023) Generation Mean Analysis, Heterosis, and Genetic Diversity in Five Egyptian Faba Beans and Their Hybrids. Sustainability 15(16): 12313.
- Zhang H, Lu Y, Ma Y, Fu J, Wang G (2021) Genetic and molecular control of grain yield in maize. In: Zhang Q, (Ed.), Molecular Breeding. Springer Science+Business Media BV, pp. 1-15.
- Baye W, Xie Q, Xie P (2022) Genetic architecture of grain yield-related traits in sorghum and maize. Int J Mol Sci 23(5): 2405.
- Dong Z, Wang Y, Bao J, Li YN, et al. (2023) The genetic structures and molecular mechanisms underlying ear traits in maize (Zea mays ). Cells 12(14): 1900.
- Rodríguez-Salinas PA, Zavala-García F, Urías-Orona V, Muy-Rangel D, Heredia JB, et al. (2020) Chromatic, nutritional and nutraceutical properties of pigmented native maize (Zea mays) genotypes from the northeast of Mexico. Arab J Sci Eng 45: 95-112.
- Lao F, Giusti MM, (2016) Quantification of purple corn (Zea mays ) anthocyanins using spectrophotometric and HPLC approaches: Method comparison and correlation. Food Anal Methods 9(5): 1367-1380.
- Yang Z, Zhai W (2010) Identification and antioxidant activity of anthocyanins extracted from the seed and cob of purple corn (Zea mays). Innov Food Sci Emerg Technol 11(1): 169-176.
- Hayman BI, Mather K (1955) The description of genic interactions in continuous variation. Biometrics 11(1): 69-82.
- Oladipo TG, Abe A (2022) Genetic Control of Total Phenolic Content and some Kernel Compositional Traits in Purple Maize. Int J Plant Breed 9(6): 001-011.
- Pfeiffer BK, Rooney WL, (2016) Inheritance of pericarp color, nutritional quality, and grain composition traits in black sorghum. Crop Sci 56(1): 164-172.
- Noubissié JBT, Youmbi E, Njintang NY, Abatchoua MA, Nguimbou RM, et al. (2012) Inheritance of phenolic contents and antioxidant capacity of dehulled seeds in cowpea (Vigna unguiculata L. Walp.). Int J Agr Agric Res 2(3): 7-18.
- Harakotr B, Suriharn B, Scott MP, Lertrat K (2016) Genetic analysis of anthocyanin content in purple waxy corn (Zea mays var. ceratina Kulesh) kernel and cob. SABRAO J Breed Genet 48(2): 230-239.
- Phillips PC (1998) The language of gene interaction. Genetics 149(3): 1167-1171.
- Gaoh BSB, Gangashetty PI, Mohammed R, Dzidzienyo DK, Tongoona P (2020) Generation mean analysis of pearl millet [Pennisetum glaucum (L.) R. Br.] grain iron and zinc contents and agronomic traits in West Africa. J Cereal Sci 96: 103066.
- Singh AP, Pandey PK, Joshi RP (2024) Harnessing Genetic Diversity for Climate-Resilient Maize: A Comprehensive Review. J Appl Biol Agric 1(1): 21-28.
- Hayman BI (1960) The separation of epistatic from additive and dominance variation in generation means. II. Genetica 31(1): 133-146.
- Khajoane TJ (2022) Genotype and environmental effects on maize grain yield, nutritional value and milling quality (Publication No. 8cbafbac-5082-46f7-946f-da3878877362) [Masters dissertation, University of the Free State, Bloemfontein] UFS Repository.
- Liang Q, Shang L, Wang Y, Hua J (2015) Partial dominance, overdominance and epistasis as the genetic basis of heterosis in upland cotton (Gossypium hirsutum). PLoS One 10(11): e0143548.
- Shang L, Liang Q, Wang Y, Zhao Y, Wang K, et al. (2016) Epistasis together with partial dominance, over-dominance and QTL by environment interactions contribute to yield heterosis in upland cotton. Theor Appl Genet 129(7): 1429-1446.
- Harakot B, Suriharn B, Scott MP, Lertrat K (2015) Genotypic variability in anthocyanins, total phenolics, and antioxidant activity among diverse waxy corn germplasm. Euphytica, 203(2): 237-248.

























