A Comparative Study of Wear Resistance and Bending Characteristics of Cutting Blades and Knife Guards for Combine Harvesters
Bahram Turapov*, Gabor Kalacska and Zoltan Szakal
Institute of Technology, Hungarian University of Agriculture and Life Science (MATE), Hungary
Submission: February 26, 2024; Published: March 13, 2024
*Corresponding author: Bahram Turapov, Institute for Mechanical Engineering Technology, Hungarian University of Agriculture and Life Sciences, Hungary
How to cite this article: Bahram Turapov*, Gabor Kalacska and Zoltan Szakal. A Comparative Study of Wear Resistance and Bending Characteristics of Cutting Blades and Knife Guards for Combine Harvesters. Agri Res& Tech: Open Access J. 2024; 28(2): 556405. DOI: 10.19080/ARTOAJ.2024.28.556405
Abstract
With the expected combine harvesters market‘s growth by 2033, the production loss during harvesting also increasing. The main reason for the header loss, which is one of the foremost, is the dull cutting steel parts, namely cutting blades (knives) and knife guards (fingers). Due to the short harvesting season per year, it is critical to change worn cutting parts promptly. When it is time to change worn knives and fingers, you must choose between original and aftermarket parts. This research work aims to compare original and aftermarket spare parts by mechanical comparison of original and aftermarket cutting steel parts of harvesters. The measurement was evaluated in terms of wear resistance and bending characteristics. New and 100 hours of field use original and aftermarket fingers and knives were subjected to a semi-guided bending test according to ASTM 290-14. Vickers hardness test of new knives and weight measurement of new and used knives were made. The hardness-ductility correlation of original and aftermarket spare parts was analyzed, and the best manufacturer was identified. Statistics were analyzed to determine the cost-effectiveness of spare parts. Comparison was evaluated in terms of wear resistance and bending characteristics. Wear and bend of the cutting steel parts of combines are the biggest causes of harvesting production losses. It was determined that original cutting steel parts have higher overall wear resistance and better ductility-hardness correlation. This research work provides advantages and disadvantages of the original and aftermarket cutting steel parts of harvesters.
Keywords: Wear Resistance; Knives and Fingers; Original and Aftermarket Spare Parts; Production Loss
Introduction
With certain requirements for the crop conditions, a combine harvester guarantees fast harvesting of clean grain with minimal time and product losses at a low cost (Miu, 2016). Due to human population growth, self-propelled combines sales were up to 18.2 percent from 4104 in 2017 to 4849 in 2018 [1]. According to Fact. MR report, combine harvester market’s growth is expected to be about 3,8% between 2023 and 2033. Production losses by combine harvesters are also increasing as the number of manufacturers of combine harvesters increases. Natural losses, header losses, and thawing and separation losses are the three types of harvest losses that occur in a combine. The header loss, which is foremost [2], is a result of a combination of crop-cutting variables and the conditions under which this cutting occurs [3]. Looking to platform, the highest wear part to going to be is your cutting components [4]. When it comes to your combine performance, it all starts from the front, with the cut (Xue et al. 2020). Calcante et al. [5], state that 49.3 % of problems in harvesting are caused by headers. Ismail & Pebrian [6] in their research provided data about repair and maintenance costs (R&M) for combine harvester in Malaysian paddy fields. According to his research repair, and maintenance cost of cutting knives during the harvesting season was 10,51%, while off-season time was less than 1%. Monitoring the cutting bar for dull components and changing them as the need arises prevents harvest losses [7]. And when it is time to change worn knives and fingers, you must choose between original spare parts with aftermarket parts.
The parts that are made by a manufacturer other than the original manufacturer are called aftermarket parts. They are not used, completely new parts. Aftermarket components are usually a less expensive option without compromising quality. Although aftermarket components are typically less expensive and more available, cost is not the only factor to consider when replacing worn cutting parts. Quality and performance [58], availability Kennedy et al. [9], van Houtum & Kranenburg [10], Zheng et al. [11], warranty and service are among them. The root cause of the harvester’s cutting part destruction and the limitations of knives and fingers life is an integration of impact and abrasive wear. Impact wear refers to any mechanical wear on the surface of the rigid bodies caused by repeated impacting; it is divided into two categories: percussion and erosion. In our case, the impact wear of cutting parts is percussion-type impact wear caused by repeated impacts of knives and fingers on stalks. The displacement of material from a surface by a softer material impinging on or rolling over the surface under the load is known as abrasive wear. Abrasive wear is considerably more extensive than most people think. For instance, because of the tiny proportion of silica present in the plant fibres, organic materials such as sugar cane are linked to abrasive wear of cane cutters and shredders [12]. The loss of performance of the header of the combine harvester is caused by abrasive wear, which causes the geometry of the cutting parts working edge to be violated [13].
This research work aims to test the assumption that aftermarket cutting steel parts’ mechanical characteristics are equal or close to the original parts and it is economically equal to the original.
This research work will address the following research questions to achieve the aforementioned research goal: • Which manufacturer has cutting steel spare parts with the highest wear resistance for combine harvesters?
• How does the wear resistance of cutting steel parts affect crop production?
• Which manufacturer has the highest bending resistance?
• Advantages and disadvantages of original cutting steel parts.
• Advantages and disadvantages of aftermarket cutting steel parts.
Compared with previous research, based on the measurement and analysis of the wear resistance, and bending characteristics of new and used cutting parts from different manufacturers, this approach can contribute to choosing the best cutting parts for harvesters. The research can also enhance the understanding of the factors and mechanisms that influence the quality and performance of the cutting parts.
Considering the aforementioned, to compare the wear resistance quality of the original and aftermarket cutting steel parts, a macrostructural quantitative comparison of the knives was conducted by studying the hardness under identical working conditions for the original and two aftermarket cutting steel parts. Determination of the mass of the blades and fingers before and after the same working condition also provided an evaluation of the wear resistance characteristics of the cutting knives. Even though the hardness of the material increases its wear resistance property, it doesn’t mean that hardened materials’ lifetime is also high. The hardness makes the material brittle. Brittle steel parts, usually knives, are easily broken. When cutting knife brakes, its broken parts can damage knife fingers and other header parts. Therefore, not only the hardness of the cutting knives and fingers should be high, but also, they must be ductile among the required ranges. The bending test of the knives and blades was also conducted to compare the bending characteristics of the cutting knives and blades.
Material and Methods
To compare original cutting tool parts, a comparison of Original parts with Manufacturer 1 and Manufacturer 2 aftermarket cutting tool parts was carried out. To avoid a conflict of interest, the name of the manufacturers is not mentioned. This research employs literature review, quantitative Nuțu et al. [14] and statistical analysis techniques to answer the research question. The quantitative research method is used to get the data related to the research question. For quantitative part mass measurement, hardness test and bending test of original and aftermarket spare parts were conducted. Statistical analysis is used to analyze quantitative research data. For statistical analysis Two-Sample F-Test and Two-Sample t-Test was employed in mass data and Paired Two-Sample for Means t-Test was employed in hardness data.
The materials under the research are knives and fingers of a wheat combine harvester. The mass, strength, and hardness of knife blades and fingers were measured before and after 100 hours of identical operation conditions to compare aftermarket cutting tool parts with original parts. For the mass measurement, five randomly selected new and used knives and fingers from each manufacturer were used. For the hardness test, only one randomly selected new knife from each manufacturer was used. For the bending test, five randomly selected new and used knives and fingers from each manufacturer were used.
Mass measurement
The research result Xu [15] indicates that the initial hardness of wearing materials is only one factor in determining the abrasion resistance and that other mechanical properties of the material should be taken into consideration as well, therefore the mass loss of the knives and fingers was also measured. The mass of the cutting tool parts was measured by a scale with an accuracy of ±0.1 (Table 1 & Table 2). The new cutting parts were degreased, their mass was measured, and after 100 hours of operation, the cutting parts were cleaned with a wire brush to remove the soil and debris.


The mean value and standard deviation of measurement is calculated by following equations:

Standard deviation:

where  – mean value, xi– value of i-th measurement, n –
number of measurements.
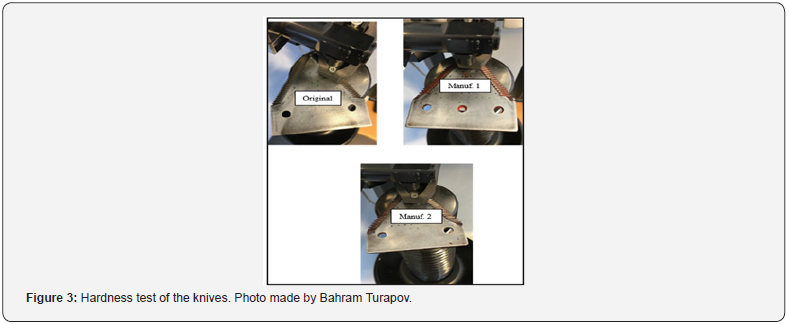
Hardness test of knives
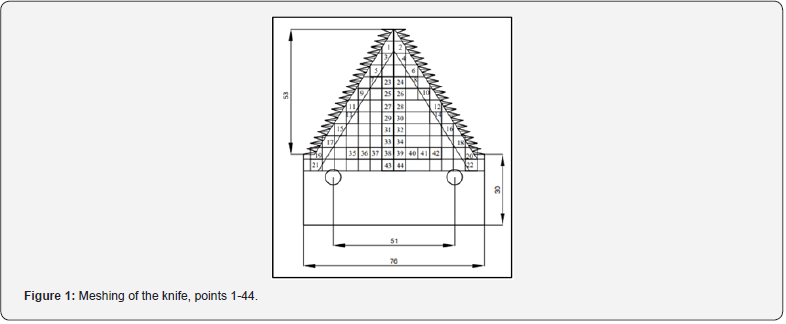
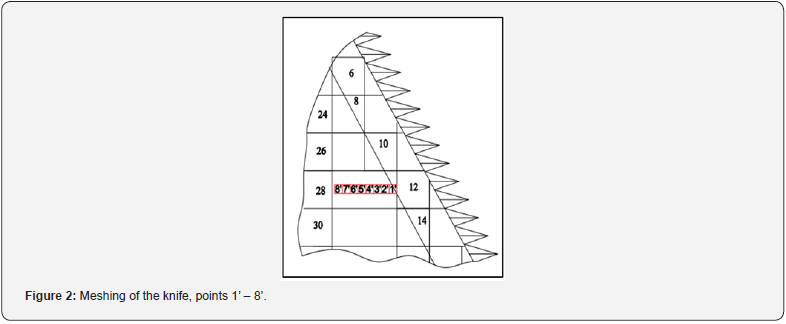
The capacity of a material to withstand the operation of mechanically piercing a heavier body into its mass is expressed by its hardness. The size of the traces generated by a penetrating body called the penetrator, which is characterized by a specific form and size and the force operating on it, is taken into account when assessing the hardness of the materials the Vickers technique by EN ISO 6507-1 was used in this study. The Vickers approach applied in the experiment simplifies the process for evaluating the hardness of knife materials and ensures less risk of damaging test pieces, allowing it to be with a wide range of materials, independent of their probable hardness. The Vickers test was conducted by the Zwick/Roell ZHU hardness test machine. A computer is directly connected to the machine. Only the Text Expert program on your computer may be used to set up measurement parameters. The measurement data is collected by the program. These data may be immediately processed in the program. The measured parameters can also be interpreted in Excel format. According to ISO 6507- 1:2023, in the case of steel, copper, and copper alloys, the distance between the center of any indentation and the edge of the test piece must be at least 2,5 times the indentation’s mean diagonal length and the distance between two neighboring indents must be at least three times the indentation’s mean diagonal length. A hardness map was developed for several points placed in a pattern to reveal hardness distribution over a specimen (Figure 1 & 2). First, the test was conducted for 44 points (points 1 - 44) over a specimen to evaluate hardness in different parts of the knife. Then the test was conducted for 8 adjacent in-line points (points – 1’- 80’) following ISO 6507-1:2018 guidance, to evaluate the hardened zone width for each specimen [16,17].
Three-point bending test of knives
We used a bending test to simulate what happens in practice to a knife part that has been damaged by a foreign body. The static behaviors of all test specimens were evaluated by a computercontrolled Zwick/Roell Z100 universal testing machine. Five specimens from each manufacturer were tested according to the ASTM-290 guided-bend test, under normal atmospheric conditions at room temperature.
The computer is directly linked to the machine. The parameters of the machine are controlled only by the Text Expert software. This software is developed on the Microsoft Windows platform. The measurement data is collected by the program. The measurement parameters can be processed directly or in Excel format.
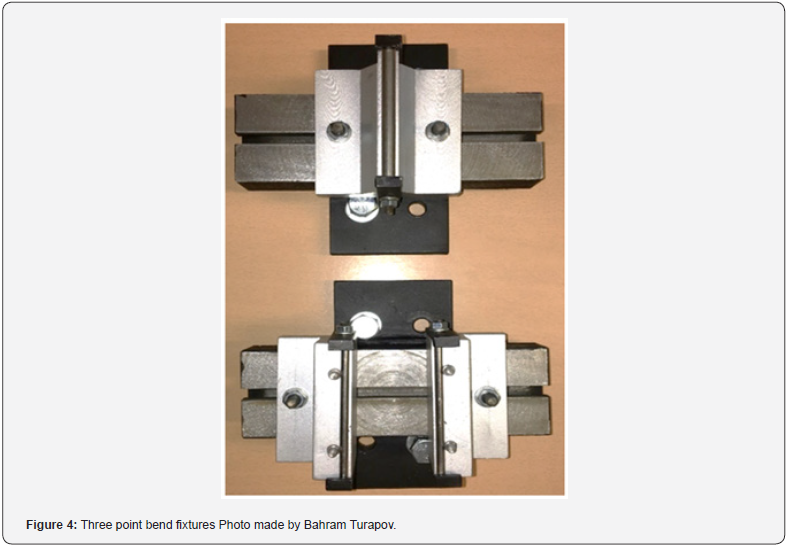
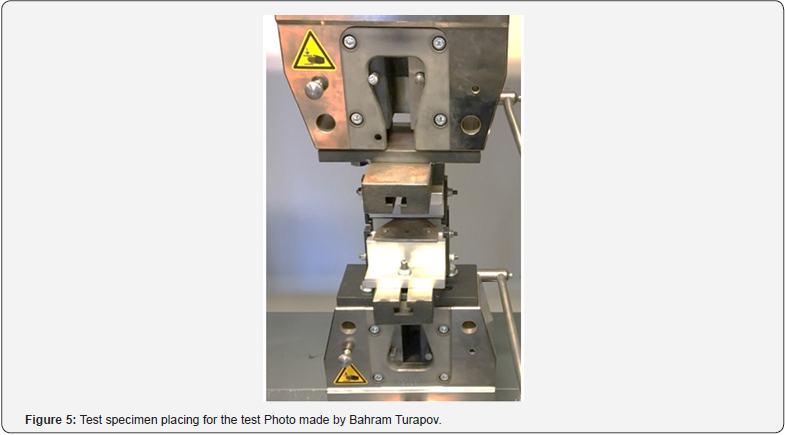
The statical parameters of the knives were evaluated by a 3-point bending test. To perform the 3-point bending test of the knife blade, first we install bend fixtures on the test machine (Figure 4). Then placing specimen over two rounded supports by mounting the hole of the knife according to ASTM 290-14 (Figure 4 & 5).
Finger’s bending test
The tensile characteristics of the fingers were evaluated by free bend testing according to ASTM 290-14 five times for each manufacturer before the operation and after 100 hours of field operation (Figure 6). The specimen was installed on a bend fixture by the mounting hole and fixed by through two bolts. Semi-guided bending load is applied to the guard lip of the finger transversely by 90° near the free edge. The clearance between the fingers and knives should not exceed 0,5 mm. The gap between the guard lip and the ledger plate in the fingers is 5 mm. Considering this fact and the thickness of the knives which is 3mm, for the testing purpose we will bend the finger’s guard lip until 4mm. But in real operation, after reducing the gap between the guard lip and ledger plate up to 2,5mm, the fingers should be repaired or changed.
Results
Mass loss of the specimens
The comparison of the original cutting steel part with two aftermarket parts was conducted to differentiate original parts from aftermarket parts in terms of quality and overall economic aspects. After 100 hours of operation knives and blades have experienced weight loss in all manufacturers. For the calculation of mass loss first, we do the two-sample F-test of mass of new and used knives and fingers (Table 3), to test whether new and used samples are from normal populations with equal variances.
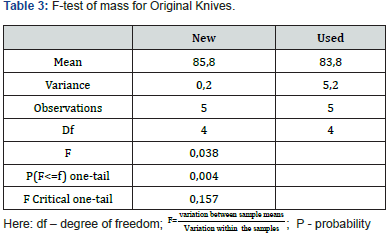
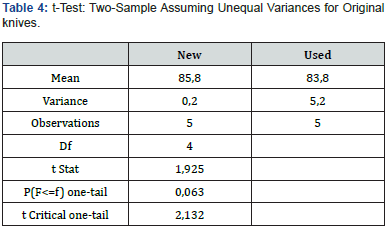
Since according to the F-test p≤0.05, the null hypothesis for the F-test is rejected, meaning that there is a significant difference between population variances. Therefore, we do a two-sample assuming unequal variances t-Test to find the mass change between the mass of new and used specimens for Original knives (Table 4). According to the two-sample assuming unequal variances t-test, we defined that there is no significant change in the mass for the original knives after 100 hours of usage (p > 0.05), which means no mass loss.
Manufacturer 1 knives
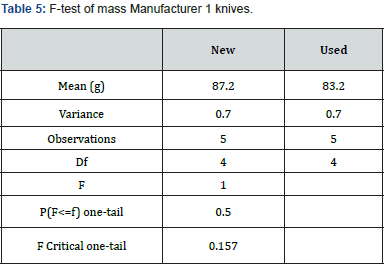
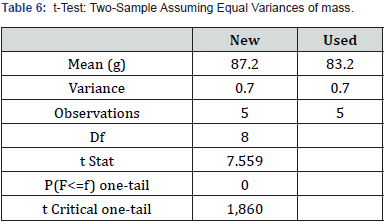
Since according to the F-test p>0.05 (Table 5), the null hypothesis for the F-test is accepted, meaning that there is no significant difference between population variances. Therefore, we do a two-sample assuming equal variances t-test to find the mass change between the mass of new and used specimens for Manufacturer 1 knives (Table 6). According to the two-sample assuming equal variances t-test (Table 6), we defined that there is a significant change in the mass for the Manufacturer 1 knives after 100 hours of usage (p > 0.05), which means there is a mass loss.
Manufacturer 2 knives
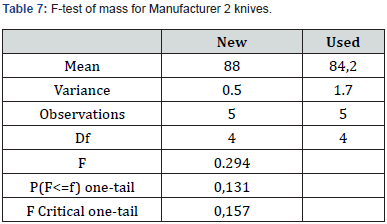
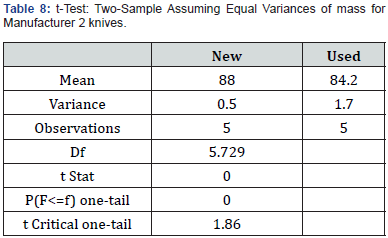
Since according to the F-test p>0.05, the null hypothesis for the F-test is accepted (Table 7), meaning that there is no significant difference between population variances. Therefore, we do a twosample assuming equal variances t-test for Manufacturer 2 (Table 8). According to the two-sample assuming unequal variances t-Test (Table 8), we defined that there is a significant change in the mass for the Manufacturer 2 knives after 100 hours of usage (p ≤ 0.05), which means there is mass loss.
Original fingers
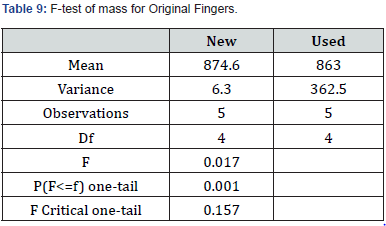
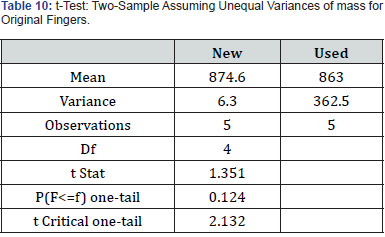
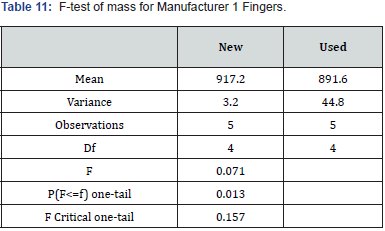
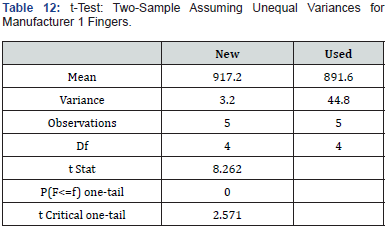
Since p≤0.05, the null hypothesis is rejected for the twosample variances F-test (Table 9), meaning that there is a significant difference between population variances. Therefore, we do a two-sample assuming unequal variances t-Test to find the mass change between the mass of new and used specimens for the Original fingers (Table 10). According to the two-sample assuming unequal variances t-test (Table 10), we defined that there is no significant change in the mass for the Original fingers after 100 hours of usage (p > 0.05), which means that there is no mass loss. Since p≤0.05, the null hypothesis is rejected for the two-sample variances F-test (Table 11), meaning that there is a significant difference between population variances. Therefore, we do a twosample assuming unequal variances t-test for Manufacturer 1 fingers (Table 12). According to the two-sample assuming unequal variances t-test, we defined that there is a significant change in the mass for the manufacturer 1 fingers after 100 hours of usage (p ≤ 0.05), which means the mass loss in Manufacturer 1 fingers.
Manufacturer 2 fingers
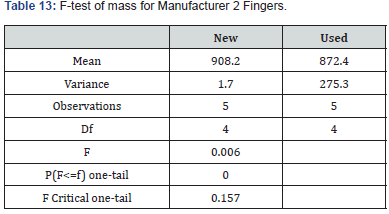
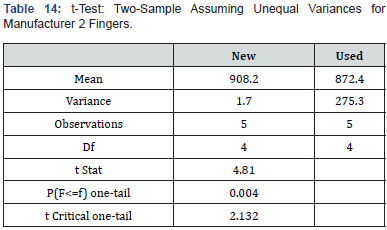
Since p≤0.05, the null hypothesis was accepted for the twosample variances F-test (Table 13), meaning that there is a significant difference between population variances. Therefore, we do a two-sample assuming equal variances t-test for manufacturer 2 fingers (Table 14). According to the two-sample assuming unequal variances t-test (Table 14), we defined that there is a significant change in the mass for the manufacturer 2 fingers after 100 hours of usage (p ≤ 0.05), which means the mass loss in Manufacturer 2 Fingers.
Hardness test of knives
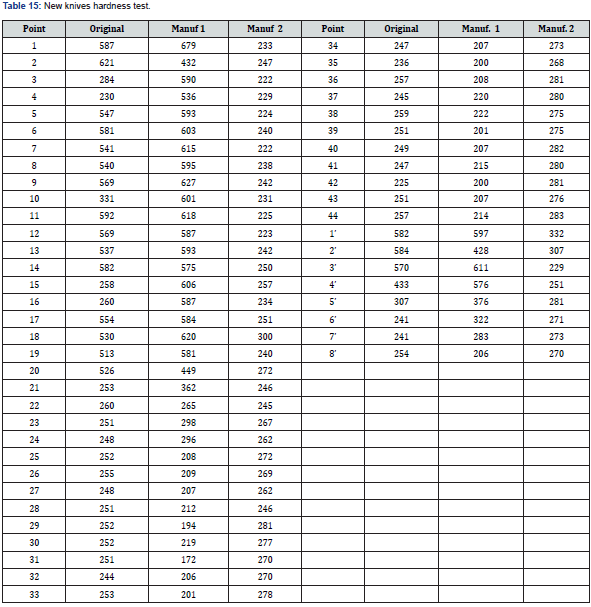
As mentioned above, the Vickers hardness test was conducted to assess the hardness of the cutting knives. The test was performed in accordance with ISO 6507-1:2018. Experimental tests were conducted based on a hardness map for each manufacturer. First hardness tests were performed in 44 points for each test piece, to evaluate the hardness distribution over the knives. Then 8 adjacent points near the edge of the knives were tested to compare the width of hardened - heat treated zone of original and aftermarket knives. The hardness acquired at the center parts of the knife blade, which is the base of the knife blade, has been assessed as a reference hardness. The results of the hardness tests are presented in Table 15. The mean values of the hardness tests are presented in Table 15. Considering that the hardness of the cutting edges of knives is inversely proportional to wear, from the Table 15 & Figure 2 & 3, it is resulted that the original cutting steel parts more wear resistant. To evaluate the comparison of the hardness of original and aftermarket knives, first, we performed a t-Test: Paired Two Sample for Means analysis of original and manufacturer 1 and manufacturer 2 knives separately for points 1-44 to find bulk hardness (Table 15). Then we performed the same analysis of Original and Manufacturer 1 and Manufacturer 2 knives separately for the hardened zone, namely for points 1-22.
According to Table 16, the Original knives’ bulk hardness (points 1-44) is not significantly lower than Manufacturer 1 and is significantly higher than Manufacturer 2. Moreover, the Original knives’ hardness at the hardened zone of knives (points 1-22) is significantly lower than Manufacturer 1 (p≤0.05) and significantly higher than Manufacturer 2 (p≤0.05) (Table 17). Yet the base hardness, which is at points 23-44, of the original knives is sufficiently higher than Manufacturer 1 and sufficiently lower than Manufacturer 2 (Table 18). Apart from bulk and base hardness and hardness of the hardened zone, by a hardness map through points 1’- 8’ we can see the width of the hardened zone in different manufacturers (3). Hardened zone for Original - until a 6’-th point, for Manufacturer 1 – until 8’- th point, for Manufacturer 2 – until 3’- rd. point.
Point bending test of the knives
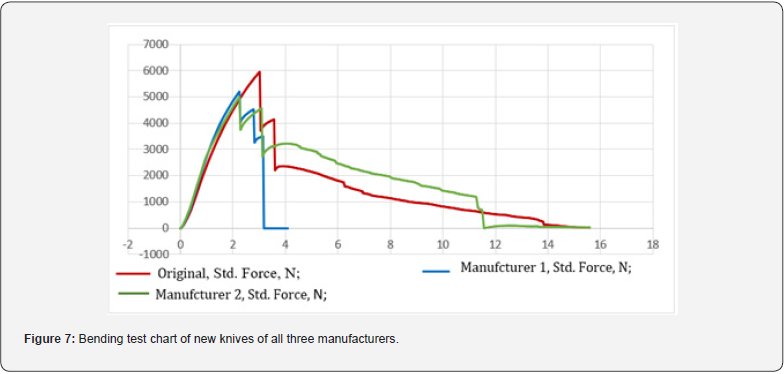
A 3-point bending test of the new and used knives was conducted for 5 specimens for each manufacturer. The test results diagram of new specimens was combined into one graph (Figure 7). As we see from the test charts, original knives have the best bending characteristics compared to two aftermarket knives in new specimens. The ultimate flexural strength of the Original knives is 5950 MPa, while Manufacturer 1 and Manufacturer 2 knives are 5205 MPa and 5000 MPa, respectively (Figure 7). After the bending test of the knives we have the following results (Table 19).
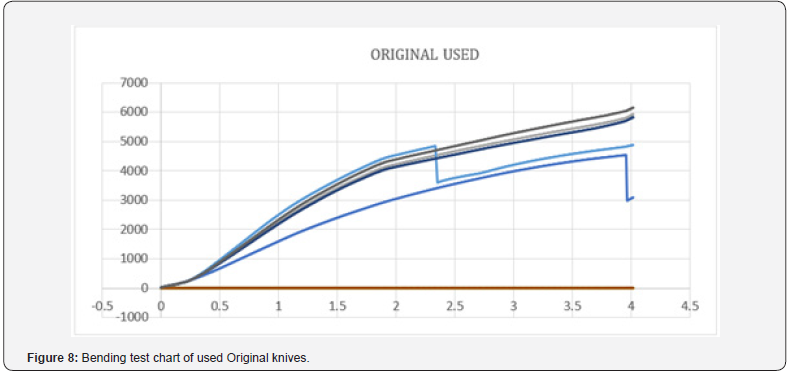
Original (Figure 8)
Specimen 1. In specimen 1 of the Original knife, there is only one crack at 4535 N load with 4mm bending deformation.
Specimen 2. In specimen 2 also only one cracking at 6595 N with 3.9mm bending deformation.


In specimen 3 one cracking point at 5028 N with 4 mm bending deformation.
In specimen 4 one crack at 6118 N with 3.4 mm bending deformation.
In specimen 5 one crack at 6481 N and 3.3 mm
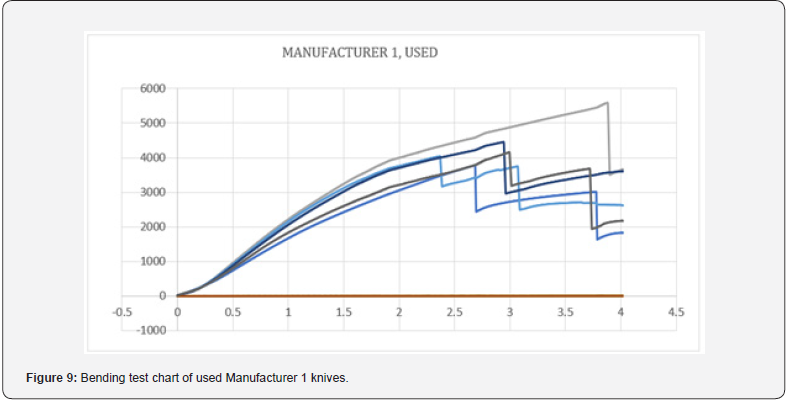
Manufacturer (Figure 9):
i. In specimen 1 there is only one crack at 3782 N workload and 2.7 mm bending deformation.
ii. In specimen 2 also there are two cracks at 5587N workload and 2.98 mm bending deformation.
iii. In specimen 3 there is only one crack at 4042 N workload and 2.1 mm bending deformation.
iv. In specimen 4 there are also 2 cracks at 4452 N load and 2.4 mm bending deformation, and at 3660 N load and 3.6 mm bending deformation.
v. In specimen 5 there are 2 cracks, at 4022 N workload and 2.7 mm bending deformation, and at 3680 N load and 3.4 mm bending deformation.
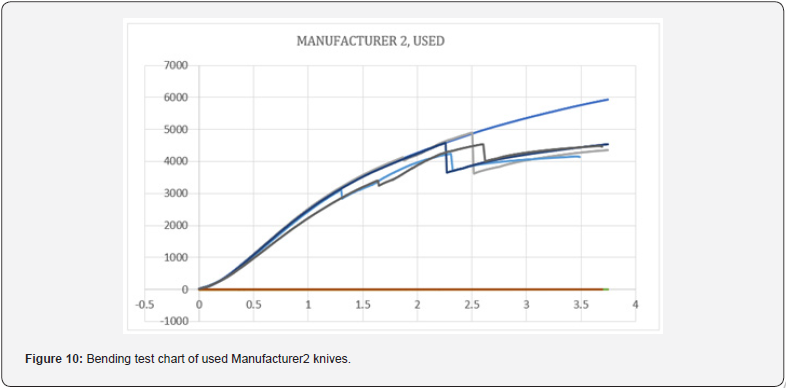
Manufacturer 2 (Figure 10):
i. In specimen 1 only one crack at 5931 N load and 3.7 mm bending deformation.
ii. In specimen 2 there are 2 cracks. At 4129 N load and 1.85 mm bending deformation, it started slowly cracking until 4023 N load almost with the same bending deformation. After that, the load increased until a maximum of 4896 N with 2.64 mm bending deformation where the second crack developed.
iii. In specimen 3 there are also 2 cracks. At 3113 N load and 1.29 mm bending deformation, it started slowly cracking until 2838 N load almost with the same bending deformation. After that, the load increased to a maximum of 4236 N with 2.88 mm bending deformation where the second crack developed (not visible in the picture).
iv. In specimen 4 only one crack at 4639 N load and 4.01 mm bending deformation.
v. In specimen 5 there are also 2 cracks. At 3403 N load and 1.65 mm bending deformation, it started slowly cracking until 3245N load almost with the same bending deformation. After that, the load increased to a maximum of 4536 N with 3 mm bending deformation where the second crack developed.
Summarizing 3-point bending test results, Original knives have an average of 5752 MPa ultimate flexural strength, while Manufacturer 1 and Manufacturer 2 knives have 4404 MPa and 4847 MPa, respectively. After the 100 operation hours, in most specimens of original spare parts, bending quality didn’t reduce, while in aftermarket knives bending characteristics reduced. This means original knives’ bending properties are higher than aftermarket spare parts. It is worth mentioning that in some specimens of both original and aftermarket knives, the cracking point is less than the ultimate flexural strength. It means that even after the crack, knives are not easily broken, which makes the harvesting safer for the other cutting parts.
Fingers’ bending test
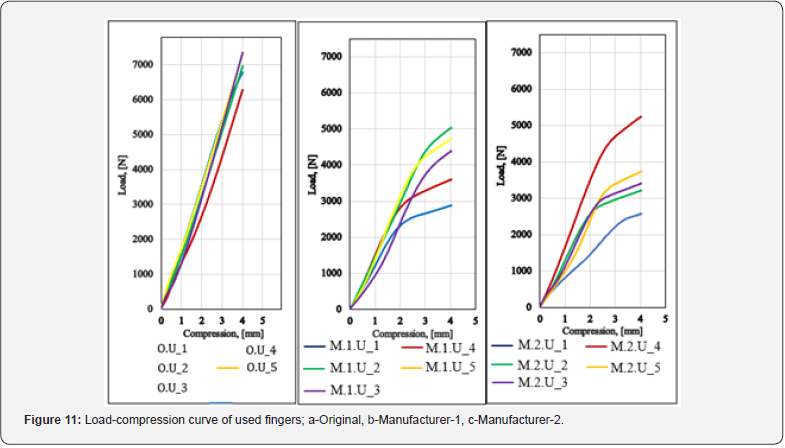
Considering the ASTM E290-14 standards requirements and requirements for the gap of the fingers’ lip, bending force is applied to it until 4 mm bending. The results of the semi-guided bending test of the knife fingers are illustrated in Figure 11.
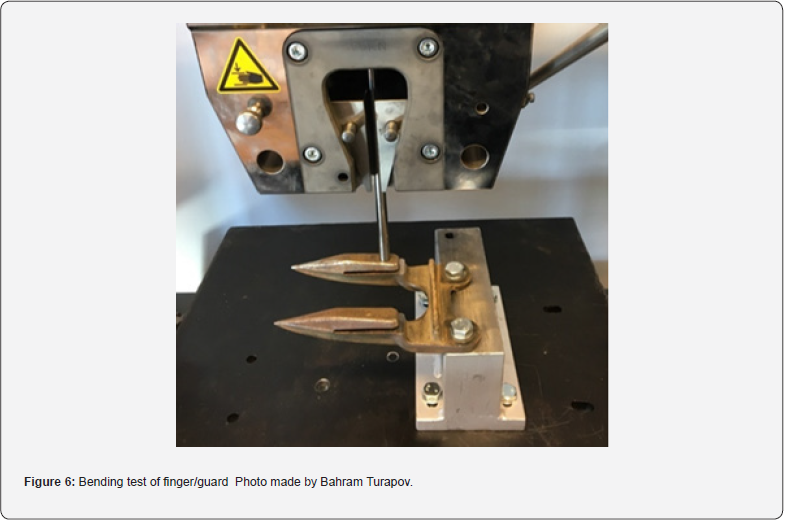
Figure 11 shows compressive load until 4 mm compressive strain in used original and aftermarket fingers under the identical working environment. It can be seen that the original finger has the maximum load in all five specimens followed by aftermarket parts from Manufacturer 1 and Manufacturer 2 respectively. The test results reveal that original fingers have a linear relationship between stress and compressive strain until the 4 mm bending, while in Manufacturer 1 strain hardening starts at 2250 N load and 2 mm bending, and in Manufacturer 2 it starts at 2500 N load and 2,5 mm bending. Ultimately it proves that original fingers have the largest modulus of elasticity. Moreover, the original parts have the largest load until 4 mm bending, as shown in Table 20. According to the bending test results, the mean value of the maximum load of the original fingers is 6935 N, while the mean value of the maximum load of the Manufacturer 1 and Manufacturer 2 aftermarket fingers is 4115 N and 3625 N respectively. For this study, the results revealed that original fingers have 51% and 58% higher bending stress resistance than Manufacturer 1 and Manufacturer 2 aftermarket fingers respectively.
Discussion
The higher the hardness of the cutting knives and fingers, the lower the wear (Jankauskas et al. 2023). In addition to their physical and chemical properties, the wear resistance of the cutting steel parts is also affected by the microstructure of the material [8]. To increase the wear resistance property of the cutting steel parts, different approaches to surface engineering are used by manufacturers (Ramezani et al. 2023; Velichko et al., 2020). But, bulk properties of materials are of secondary importance (Dasgupta et. al. 1998). Increasing the hardness at the cutting edge of the cutting blades improves its wear resistance (Jankauskas et al., 2023). Usually, many manufacturers increase the hardness of the knives only near the serrated teeth, where high friction forces are applied, and keep the base part less hardened, to minimize the brittleness of the knives. The width of the hardened zone, heat treatment technologies, and coating technologies for the steel cutting parts are different in every manufacturer. From the literature and conducted research, it is clear that the wear properties of the cutting parts depend not only on the bulk hardness and base material of the part but also on applied surface treatment processes. Because the number of combines is growing, selecting the finest manufacturer for replacement parts has become critical to maintaining the combine harvesting when it is most needed. One challenge is that many failure mechanisms require the replacement of parts or immediate repair, which means operational downtime must be minimized. Even though the aftermarket spare parts are often less reliable and less efficient than the OEM spare parts, they are more readily available (Kleber et al., 2020).

Conclusion
Due to the human population growth, the requirement for crop production also increased which caused a consecutive increase in combine harvesters’ production, and so did the amount of production losses during harvesting by combine harvesters. The most significant loss is the header loss, which is caused by a combination of crop-cutting factors and the conditions in which this cutting happens. Because the number of combines is growing, selecting the finest manufacturer for replacement parts has become critical to maintaining the combine harvesting when it is most needed. One challenge is that many failure mechanisms require the replacement of parts or immediate repair, which means operational downtime must be minimized. Above mentioned all requirements drove the Aftermarket business growth. As a result, the nature of the Aftermarket sector prioritizes prompt spare part supply and asset restoration. Although aftermarket components are usually less expensive and more readily accessible, pricing isn’t the primary consideration when replacing old cutting elements. This research was conducted to determine the notion that aftermarket cutting steel components namely cutting knives and fingers have mechanical qualities that are similar to or near to those of original parts, and that they are cost-effective. The study compares original and aftermarket steel parts by conducting a literature review, experimental methodology, and statistical analysis of the experiment results.
In the literature part of the study, we studied the relationship between the quality of the spare parts and the tests conducted, as well as the cost-effectiveness of the spare parts with regard to the quality of the parts, grain loss during harvesting, and loss due to standing time. For the experimental part of my research, a comparison of mechanical characteristics of original and aftermarket spare parts was conducted using the 3-point guided bend test of knives and the semi-guided bend test of fingers according to ASTM-290, and the Vickers hardness test of knives according to EN ISO 6507-1. Additionally, weight loss of test specimens after 100 working hours under identical working conditions was determined. Statistical analysis was performed to determine the reliability of the results and to compare them.
Through this research, we have the following conclusion:
Original cutting steel parts:
• Advantages: the lowest mass loss, optimum base and bulk hardness, the best bending resistance and best overall wear resistance.
• Disadvantages: expensive, less available, hardness of critical zone is lower compared with some aftermarket steel parts.
Aftermarket cutting steel parts:
• Advantages: some manufacturers have better hardness in critical zones compared to original parts, are cheaper, and more available.
• Disadvantages: sufficiently higher mass loss, less optimization of base and bulk hardness, lower bending resistance, and overall wear resistance.
In economic aspects, even though original spare parts are expensive, the overall benefit due to less header loss and less standing time makes them more profitable. Nonetheless, it is the company’s decision whether to choose original or aftermarket spare parts. According to the results of the literature and experimental studies, we determined that the assumption that aftermarket cutting steel parts have mechanical properties similar to the original parts and are economically equal to the original steel parts is partly true. The limitations of the current research work are the wear evaluation by hardness and mass loss without the surface analysis and tribological tests like pin-on-disc don’t give the full picture.
This study raises several cautionary points and suggests additional areas for future research: Current research can be continued in the next directions:
i. Comparison of the cutting steel parts of the different types of harvesters.
ii. Comparison of the original and aftermarket chopping units’s steel parts.
iii. Use of additive manufacturing for the aftermarket spare parts for the combine harvester.
References
- Hannah Pagel (2019) AEM: 2018 a solid year for tractor, combine sales. AEM: 2018 a Solid Year for Tractor, Combine Sales.
- Zareei S, Abdollahpour S (2016) Modeling the optimal factors affecting combine harvester header losses 18(2).
- Chaab RK, Karparvarfard SH, Rahmanian-Koushkaki H, Mortezaei A, Mohammadi M (2020) Predicting header wheat loss in a combine harvester, a new approach. Journal of the Saudi Society of Agricultural Sciences 19(2): 179-184.
- Banniy O, Popyk P, Savko D (2022) Failure analysis of the segment finger bar mower and force interaction of the blade segment with the plant stem. The teachings of the journal 13(3).
- Calcante A, Fontanini L, Mazzetto F (2013) Coefficients of repair and maintenance costs of self-propelled combine harvesters in Italy 15(3).
- Ismail MI, Pebrian D (2018) The characteristics of the repair and maintenance costs distribution of rice combine harvester in Malaysian paddy fields 20(4).
- McNeil S, Overhults D, Montross M (2009) A Comprehensive Guide to Wheat Management in Kentucky.
- Van Horenbeek A, Scarf PA, Cavalcante CAV, Pintelon L (2013) The effect of maintenance quality on spare parts inventory for a fleet of assets. IEEE Transactions on Reliability 62(3): 596-607.
- Kennedy WJ, Wayne Patterson J, Fredendall LD (2002) An overview of recent literature on spare parts inventories. International Journal of Production Economics 76(2): 201-215.
- Van Houtum GJ, Kranenburg B (2015) Introduction p: 1-10.
- Zheng M, Ye H, Wang D, Pan E (2021) Joint Optimization of Condition-Based Maintenance and Spare Parts Orders for Multi-Unit Systems with Dual Sourcing. Reliability Engineering & System Safety 210: 107512.
- Kovaříková I, Szewczyková B, Blaškovitš P (2009) Study and Characteristic of Abrasive Wear Mechanisms.
- Strebkov S, Slobodyuk A, Bondarev A (2021) Technology of electro spark hardening of cutting surface of feed mixer knives.
- Nuțu G, Cârlescu PM, Țenu I, Cârlescu V (2017) Experimental Determination of the Wear Resistance of Devices Used for Cutting the Stalks of Agricultural Plants. In Lucrări Ştiinţifice 60(2).
- Xu X (2016) The Effect of Microstructure on the Abrasion Resistance of Low Alloyed Steels. Technische Universiteit Delft.
- ASTM (2014) Standard Test Methods for Bend Testing of Material for Ductility.
- International Standard (2023) ISO, ppp. 6507-6511.


