Monitoring of Positive List System on Residual Pesticides Analysis of Agricultural Products in Southwest of Korea
Hyo Hee Kim1*, Yujin Han1, Hyang Hee Lee1, Yongshik Yang1, Sunju Cho1, Junghee Park1, Dowoo Kim1, AeGyeong Kim2, Duckwoong Park2, Sujin Mun2, So-jin Yang2, Hyejin Kim2, Soyoung Lim2, Bae-Sik Cho3 and Hye-Young Kee1
1Seobu Agro-Fishery Products Inspection Center, Health and Environment Research Institute of Gwangju, Republic of Korea
2Gakhwa Agricultural Products Inspection Center, Health and Environment Research Institute of Gwangju, Republic of Korea
3Health and Environment Research Institute of Gwangju, Republic of Korea
Submission: November 29, 2022; Published: December 15, 2022
*Corresponding author: Hye-Young Kee, Seobu Agro-Fishery Products Inspection Center, Health and Environment Research Institute of Gwangju, Republic of Korea
How to cite this article: Hyo Hee K, Yujin H, Hyang Hee L, Yongshik Y, Sunju C, et al . Monitoring of Positive List System on Residual Pesticides Analysis of Agricultural Products in Southwest of Korea. Agri Res & Tech: Open Access J. 2022; 27 (3): 556368. DOI: 10.19080/ARTOAJ.2022.27.556368
Abstract
Pesticide residues must be managed for food safety and regulations are being strengthened worldwide. In Korea, the Positive List System (PLS) was introduced to prevent the misuse and manage unregistered pesticides. The PLS is a system that applies 0.01 mg/kg to crops for which maximum residue limits is not set. A more stringent regulatory system could lead to an increase in agricultural products that exceed standards. Therefore it is necessary to confirm the change in the determination rate of agricultural products exceeding the previous pesticide residue standards. In terms of climate change, temperature increase and changes in precipitation patterns are the main pest and pathogen infection determinants. Complex interactions and climate variability will lead to more frequent spraying of pesticides and eventually affect consumer exposure at the end of the food chain. Therefore, we confirmed the relationship between temperature and precipitation, which are climate factors and pesticide residues. Agricultural products (n=5,560) distributed at wholesale market (SeoBu, GakHwa) in the southwest Korea were collected and 311 kind of residual pesticides were analyzed using GC-MS/MS and LC-MS/MS. This study could serve as basic data for pesticide residue prevention, management, control and monitoring in countries seeking to tighten pesticide standards.
Keywords: Pesticideresidues/analysis/management; Agricultural products/vegetables; Positive List System; Maximum Residue Limit; Climate change; Consumer product safety
Abbreviations: PLS: Positive list system; MRLs: Maximum residue limits; GC: Gas chromatography; LC: Liquid chromatography; MS: Mass spectrometry; GC-MS/MS: Gas chromatography tandem mass spectrometry; LC-MS/MS: Liquid chromatography tandem mass spectrometry; LOD: Limit of detection; LOQ: Limit of quantitation; RSD: Relative standard deviation
Introduction
Pesticides are historically long-established commodities used in agriculture [1]. They include a wide range of compounds such as insecticides, fungicides, herbicides, and rodenticides [2]. Pesticides play an important role in reducing damage from weeds, diseases, and pests, and improving crop yield worldwide [2], but adversely impact the environment. The pesticides not only contaminate soil, surface water, and groundwater, but also remain in trace amounts in crops, threatening human health [2]. In humans, pesticides can be carcinogenic and cytotoxic and can cause bone marrow and nerve disorders, infertility, and immune and respiratory diseases [3]. The presence of large amounts of pesticide residues in food is a serious risk to consumers. In general, pesticides are applied directly to crops and they can remain on them. Infants, children, and adults can be exposed to these pesticides by consuming pesticide-contaminated food [4]. Residues of chemical pesticides have been detected more in vegetables and fruits than in other food items4. As agricultural product intake is a major pathway by which humans are exposed to pesticides, there is an increasing demand for safe food management from pesticide residues worldwide.
The European Commission, Environmental Protection Agency, Food and Agriculture Organization/World Health Organization have set limits on pesticide residues in food to protect people from the toxic effects of pesticide exposure [4]. Acceptable levels of pesticide residues in food are defined by setting a maximum residue limit (MRL) for each component. An MRL represents the highest concentration of a pesticide residue legally permitted in food when a pesticide is used correctly on an agricultural product. In Korea, the pesticide residue monitoring program was started in 1968 [5] and as a part of strengthening the food safety management, the introduction of a pesticide Positive List System (PLS) was planned in 2011 [6]. The PLS is a system that applies a uniform standard MRL of 0.01 mg/kg of chemical residues to crops that do not have pesticide residue tolerance standards. Priority was given to nuts, seeds, and tropical fruits in December 2016 [6]. Since January 2019, it has been fully expanded to domestic and imported agricultural products6. In other words, the PLS system was introduced to strengthen the pesticides management within the allowable daily intake range by uniformly applying the default MRL of 0.01 mg/kg. This system can ensure food safety for consumers by preventing in advance the use of unregistered pesticides and excessive spraying of pesticides.
However, there are concerns about the introduction of the PLS system in agricultural sites due to the insufficient number of registered pesticides, the problem of unintended pesticide residues, the problem of scattered contamination during pesticide application, residual problem of succeeding crop and soil residues [7]. A more stringent regulatory system, PLS, could lead to an increase in agricultural products that exceed standards. Therefore, after the expansion of the PLS to the assessment of all agricultural products, it is necessary to confirm that the change in the determination rate of agricultural products exceeds the earlier standard for pesticide residues. In some studies, the introduction of the PLS, which was expanded since 2019, did not affect the assessment result (conformity/nonconformity) for agricultural products exceeding the pesticide residue standard [7,8]. However, there may be differences according to the cultivation area of crops, and extensive studies have not been conducted. In terms of improving food safety and agricultural practices and minimizing economic losses, the pesticide residue monitoring program in food is very important, and the expanded application of PLS system has the potential to affect the cultivation and distribution of agricultural products, so comprehensive studies are required.
Several studies have found a correlation between the pesticide use and climate change [9-11]. Pesticide use is directly and indirectly related to climate change11. However, there have only been a few studies on establishing the relationship between pesticide residues and climate change for more than 5,000 agricultural products of various types. Despite tremendous improvements in technology and crop yield potential, food production remains highly dependent on climate, because solar radiation, temperature, and precipitation are the main drivers of crop growth [12]. In terms of climate change, temperature increase and changes in precipitation patterns are the main pest and pathogen infection determinants [12]. Complex interactions and climate variability will lead to more frequent spraying of pesticides and eventually affect consumer exposure at the end of the food chain [11]. As the impact of climate change grows, ensuring food safety while improving agricultural productivity through the use of pesticides is a huge challenge. Accordingly, we attempted to confirm the correlation between pesticide residues and climatic factors. The purpose of this study was to monitor pesticide residues in agricultural products in the southwest region of Korea and to investigate whether the introduction of a PLS system affects decisions of conformity and nonconformity. Furthermore, the relationship with pesticide residues between temperature and precipitation, which are climatic factors, was examined for more than 5,000 agricultural products of various types.
Material and Methods
Sample collection
This study was conducted at the Health and Environment Research Institute (Agro-Fishery Products Inspection Center) in Gwangju metropolitan city under a surveillance program of the Gwangju metropolitan government. A total of 5,560 agricultural products were collected between March 2020 and September 2021 from the largest wholesale market in the southwest of Korea, and all samples were analyzed within 24 h of collection. The types of agricultural products analyzed in this study are listed in Table 1.
Pesticide reference standard and Reagents
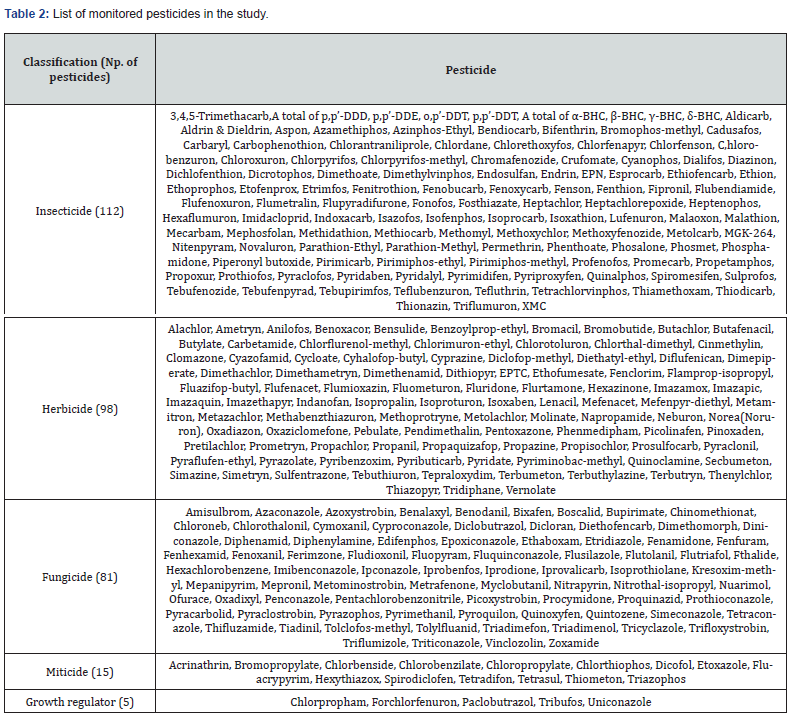
The certified pesticide reference standards were purchased from AccuStandard (New Haven, USA) or Kemidas (Suwon-si, Republic of Korea). A total of 311 pesticides that can be analyzed simultaneously were selected for analysis and are listed in Table 2. The reagents and solvents used for monitoring the pesticide residues, viz., acetonitrile, sodium chloride, acetone, and water containing 0.1% (v/v) formic acid, were procured from Merck (Darmstadt, Germany). Anhydrous sodium sulfate, n-hexane, and dichloromethane were purchased from Wako (Osaka, Japan), and methanol was purchased from Avantor (USA).
Sample preparation
The overall analysis was conducted using multi-class pesticide multi-residue method No. 2 for pesticide residues, in accordance with the Korean Food Code guidelines. The samples (1-2 kg of each agricultural product) were first pulverized using a blender (Robotcoupe, South Perkins, Ridgeland, USA) to obtain a homogeneous mixture. Then, 50 g of each sample was extracted with 100 mL of acetonitrile for 3 min. The sample/acetonitrile mixture was homogenized for 3 min and filtered using a Buchner funnel into a bottle containing 10 g of sodium chloride. Thereafter, the extract and sodium chloride were vortexed and the layers were separated. Then, 10 mL of the acetonitrile layer was transferred to a test tube and evaporated to dryness in a water bath using a stream of air at 40 °C or lower. For the purification of the pesticide extract, gas chromatography (GC) and liquid chromatography (LC) were performed independently.

For GC analysis, Florisil cartridges (Phenomenex, Torrance, CA, USA) were activated and conditioned by flowing 5 mL of hexane and 5 mL of 20% acetone/hexane. The sample extract was dissolved in 4 mL of 20% acetone/hexane and loaded into the Florisil cartridge, and the cartridge was eluted with 5 mL of 20% acetone/hexane. The eluate was collected in a tube and the solvent was evaporated under gentle air flow. The residue was then dissolved in 2 mL of acetone, filtered through a membrane filter (PTFE, 0.45 μm), and used as the test solution for GC analysis. For LC analysis, aminopropyl cartridges (Phenomenex, Torrance, CA, USA) were first activated and conditioned with 5 mL of dichloromethane. Then, the extracted solution was loaded and eluted with 4 mL of 1% methanol/dichloromethane, and the eluate was collected in a tube. The cartridge was eluted again with 7 mL of 1% methanol/dichloromethane. The combined solution of first elution and second elution was evaporated under gentle air flow at 40 °C in a water bath. The dried extract was dissolved in 2 mL of acetonitrile and filtered through a membrane filter (PTFE, 0.2 μm) for use as a test solution for LC analysis.
Pesticide residue analysis conditions
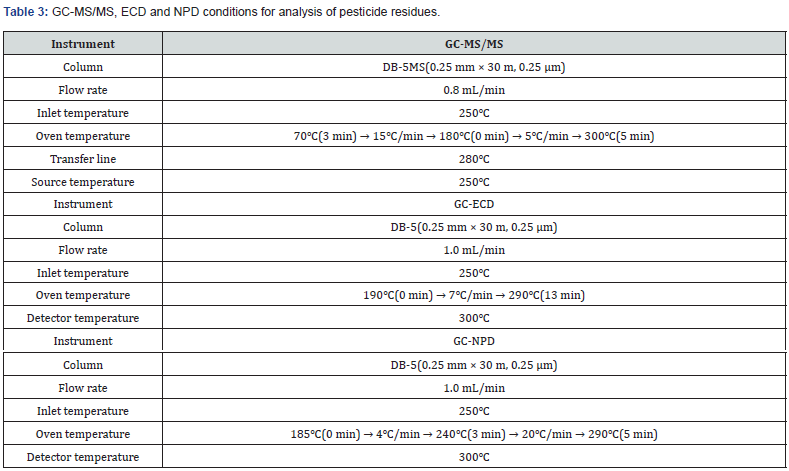
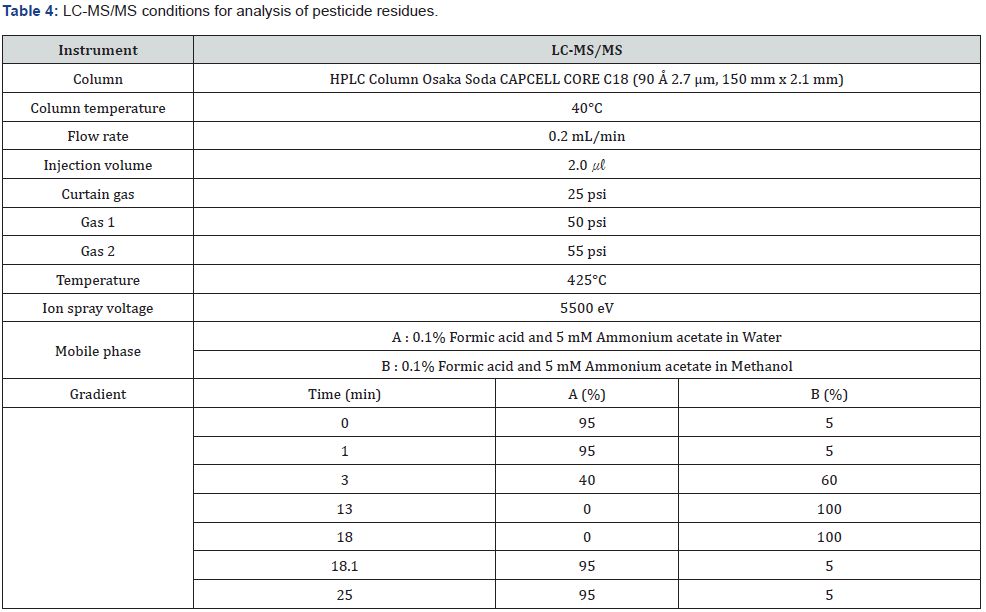
GC- MS (GC-tandem MS (GC-MS/MS), Agilent 7000B, California, USA) and LC-MS (LC- tandem MS (LC-MS/MS), AB SCIEX, TQ 4500, CA, USA) were used for the qualitative analysis of the pesticide residues. The quantitative analysis of each pesticide was carried out using a GC-MS/MS system, LC-MS/MS system, GC system equipped with a 63Ni electron capture detector (ECD), and GC system equipped with a nitrogen phosphorous detector (NPD), according to the Food Code set by the Korea Food and Drug Administration. An Agilent 7890 series GC instrument equipped with an NPD and ECD was used for GC analysis. LC analysis, electrospray ionization was performed in positive and negative modes, and the data were obtained in multiple reaction monitoring mode. The qualitative and quantitative instrument analysis conditions are presented in Table 3 & 4.
Measurement of recovery, LOD and LOQ
Method validation was performed based on SANCO/12571/2013 [13] and ICH/2005/Q2/R1 [14]. To a blank matrix sample of lettuce in which no residual pesticide was detected, each pesticide standard was added so that the sample content was 0.5 mg/kg, and the recovery was measured by repeating it three times. The limit of detection (LOD) and limit of quantitation (LOQ) were calculated as the standard deviation of the slope and residual through the regression line presented by the International Conference on Harmonization. It was repeated five times for each concentration using a standard solution and measured according to the following formula.

σ = standard deviation of the response
S = slope of calibration curve
Investigation of the impact of nonconformity due to the introduction of PLS
The detection and nonconformity assessment of each pesticide/item in the pesticide residues of agricultural products were conducted using Excel 2016 (Microsoft, Redmond, WA, USA). In order to determine the change in the nonconformity of the pesticide residues under the PLS, the data of nonconforming agricultural products were evaluated for suitability by applying the pesticide residue standards used before the introduction of the PLS. This method was applied according to the method specified in the Korean Food Code. The standard application sequence is as follows:
a. Application of Codex standards to agricultural products.
b. Application of the standards in the order of agricultural products, sub-categories, and major categories of the pesticide residue standards of the Food Code.
c. Application of the lowest standard among the pesticide standards for the pesticide compound in the Food Code.
Statistical Analyses
All statistical analyses were performed in SPSS version 22.0 software (IBM Corp., Armonk, NY, USA) and P-values less than 0.05 were considered statistically significant. Log transformation of data was performed where appropriate. Data analysis was calculated as mean ± standard deviation and all tests were twosided. Normal distribution of the variables was confirmed with a Kolmogorov–Smirnov (KS) test. And then we calculated the Pearson linear correlation coefficient in order to seek to determine the strength of association between data sets. The following points are the accepted guidelines for interpreting the correlation coefficient, and the results were interpreted based on this : perfect (|r| = 1), strong (0.7 ≤ |r| < 1.0), moderate (0.3 ≤ |r| < 0.7), weak (0.0 < |r| < 0.3), No correlation (|r| = 0) [15].
Results and Discussion
Validity of analytical methods
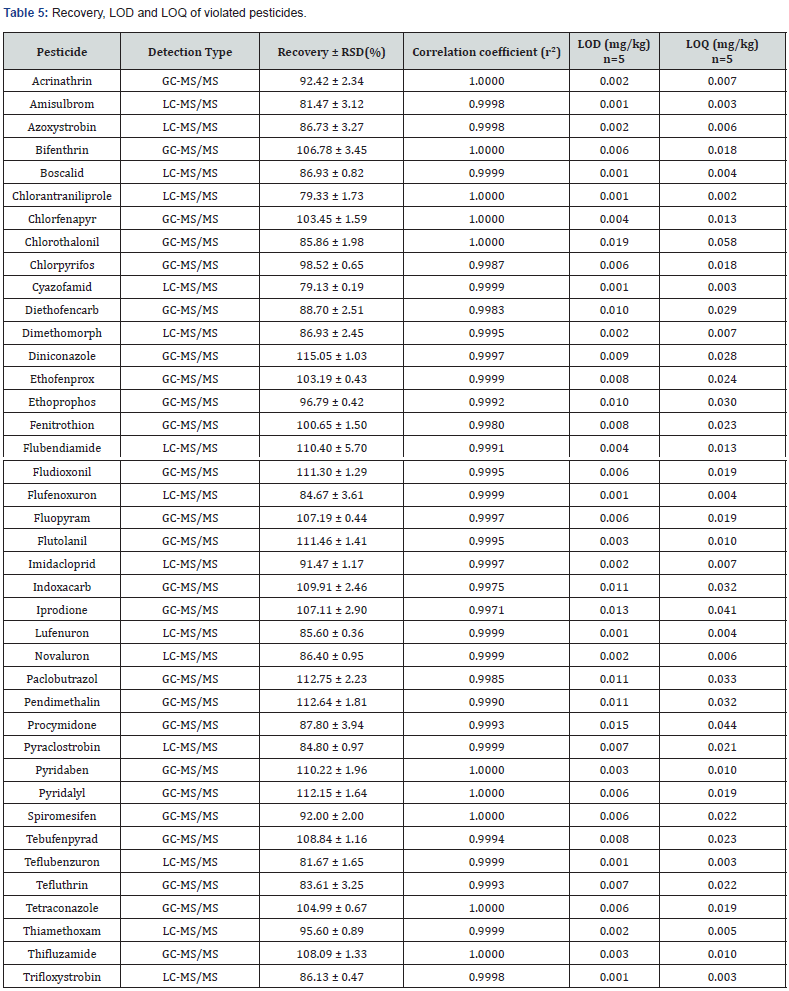
For the validation of the method, forty kinds of pesticides were selected based on the detection of more than twenty times in agricultural products. The method was validated for various parameters such as accuracy, precision, linearity, limit of detection and quantification (Table 5). The adequacy of the sample pretreatment was evaluated based on the recovery, and the analytical method was validated based on ICH guidelines [14]. The recovery was between 79.13 and 115.05% and the relative standard deviation (%RSD) values were less than 6%. A linear correlation between each pesticide concentrations and peak areas was obtained in the range of 0.9971 to 1.000. The limit of detection (LOD) were 0.001 to 0.019 mg/kg for GC-MS/MS and 0.001 to 0.004 mg/kg for LC-MS/MS. The limit of quantification (LOQ) were 0.004 to 0.058 mg/kg for GC-MS/MS and 0.002 to 0.013 mg/kg for LC-MS/MS. The validated parameters were found to be within acceptable ranges, suggesting that this method is suitable for use in the pesticide analysis of agricultural products.
Climate factors and pesticide residues of agricultural products
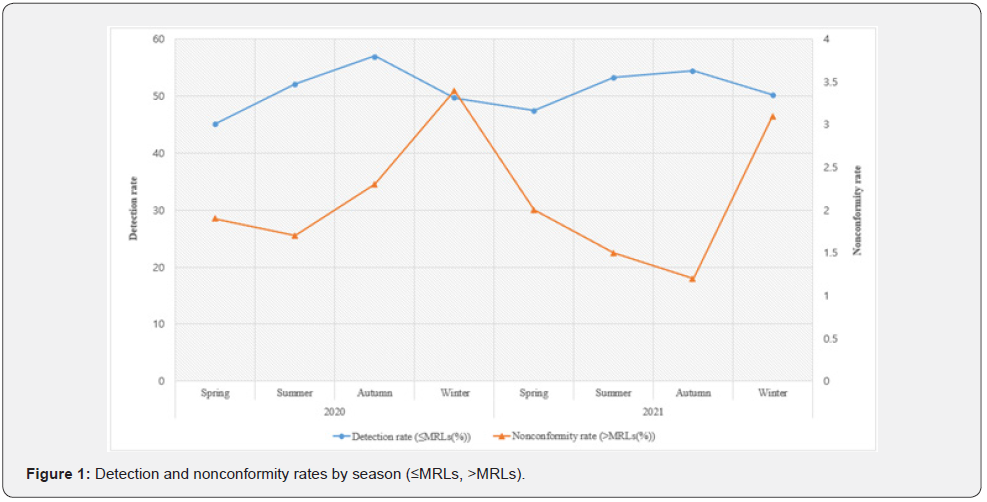
In this study, 5,560 agricultural products were monitored. Pesticide residues were detected in 51.1% of the agricultural products and the pesticide residues in 2.0% of the agricultural products were found to exceed the MRLs. The detection and nonconformity rates were categorized according to the four seasons in Korea, and the detection and nonconformity rates for 2020 and 2021 are shown in Figure 1. On average, the detection rate (nonconformity rate) was as follows: spring 46.4% (1.9%), summer 52.7% (1.6%), autumn 56.8% (2.1%), and winter 50.0% (3.2%). It was thus confirmed that the detection rate was the highest in autumn, while the nonconformity rate was the highest in winter. Different climates occur according to the season, and they have a major impact on the cultivation of agricultural products. Therefore, the relationship between climatic factors and pesticide residues in agricultural products was assessed. The climatic factors (temperature and precipitation) were obtained from the statistical data of the Korea Meteorological Administration [16]. It was analyzed using the average values of climate factors in Gwangju, Jeollabuk-do and Jeollanam-do, which are representative regions of the southwest region and account for most of the wholesale market products. The normality of experimental results is an important premise for the use of parametric statistical tests such as correlation analysis. If the assumption of normality is not confirmed by relevant tests, interpretation and inference from any statistical test may not be reliable or valid [17].
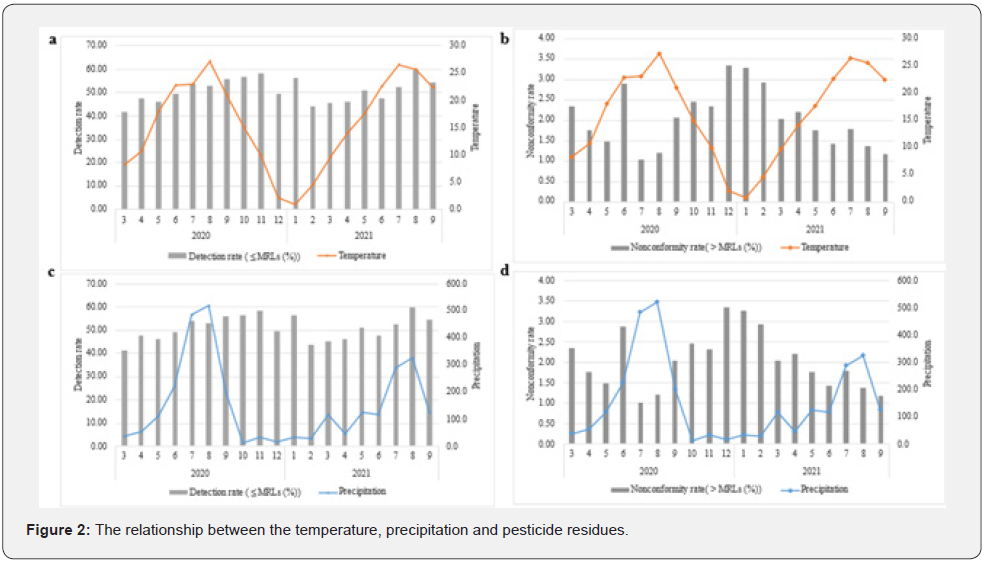
Normal distributions of all variables such as temperature, precipitation, detection rate, and nonconformity rate were confirmed by the Kolmogorov-Smirnov (KS) test, and all variables satisfied the normality with a significance probability p=0.200 Figure 2a & b. shows the relationship between the temperature and pesticide residues. Pearson correlation coefficient (r) between temperature and detection rate was 0.314 (p = 0.190). There was no significant change in the detection rate of the pesticide residues according to the temperature change. However, the nonconformity rate showed an opposite trend with respect to the temperature. Pearson correlation coefficient (r) between temperature and nonconformity rate was -0.765 (p = 0.000). It can be seen that there is a high negative correlation between temperature and nonconformity rate as high as 76.5%. Most winter agricultural products are grown in facility and the density of phytopathogenic fungi increases rapidly due to low temperature and high humidity, insufficient sunlight and poor ventilation. Therefore, it is judged that the frequent use of pesticides increased the nonconformity rate [18]. Moreover, several studies have shown that pesticide residue levels were higher in greenhouse-grown produce than in open field-grown produce Figure 2c & d [19,20]. shows the relationship between the precipitation and pesticide residues. Pearson correlation coefficient (r) between precipitation and detection rate was 0.200 (p = 0.411). Precipitation did not have a significant effect on the detection rate. On the other hand, As the correlation coefficient R= -0.701 (p = 0.001), it can be seen that there is a high negative correlation between precipitation and nonconformity rate as high as 70.1%. When there was a large amount of precipitation in July and August of 2020, the nonconformity rate decreased at first and then increased. Ilse Delcour confirmed that high precipitation causes pesticide dissipation, leading to a general tendency of increased pesticide use to overcome the loss [11]. According to our study results, the increase in the detection of pesticide residues after a large amount of precipitation can be considered as the corresponding effect. Considering the results of the study, it suggests that caution is needed in managing pesticides and consuming agricultural products during autumn (high detection rate), winter (high nonconformity rate), and after periods of consecutive precipitation (high nonconformity rate). In a previous study conducted in the USA, the usage of pesticides in the cultivation of each agricultural product was investigated according to the climate change to discover that the usage pattern of pesticides for each agricultural product differed according to the climate [9]. This suggests that the relationship between climate and pesticide residues may be different for each agricultural product. Therefore, in order to accurately identify the relationship between climate and pesticide residues, additional climate-related studies according to cultivated agricultural products and cultivation methods are needed. Our study was conducted for a short duration, and a longer study duration is necessary to adequately assess the relationship between temperature, precipitation, and residual pesticide detection. But, our research can be considered representative because more than 5,000 agricultural products were monitored.
Monitoring of pesticide residues in agricultural products
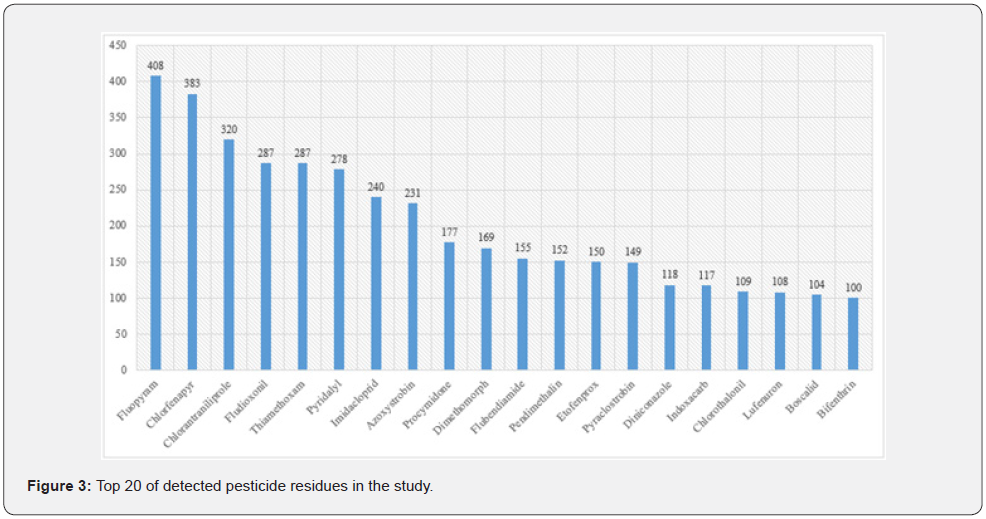
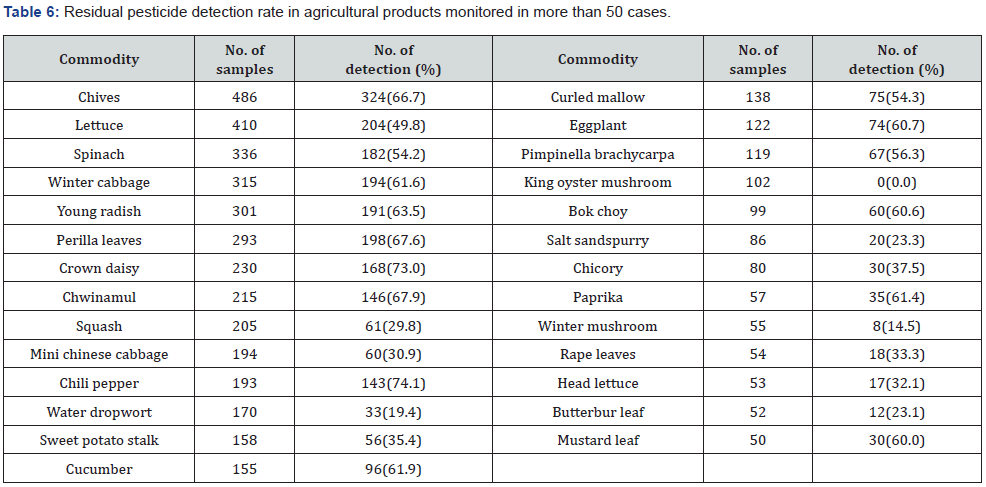
The detection rates of residual pesticides in the agricultural products (51.1% of the total number of products studied) are as follows: chili pepper (74.1%), crown daisy (73.0%), chwinamul (67.9%), perilla leaves (67.6%), and chives (66.7%). On the other hand, none of 102 cases of king oyster mushroom were detected (Table 6). A high detection rate of pesticide residues has been observed for chili pepper cultivated in several regions, including Saudi Arabia [21], Cameroon [22], and Southeast Asia [23]. Of the 311 pesticides monitored, 126 pesticides were detected, and 20 types of frequently detected pesticides are shown in Figure 3. The most frequent pesticides were fluopyram (n = 408), chlorfenapyr (n = 383), chlorantraniliprole (n = 320), fludioxonil (n = 287), and thiamethoxam (n = 287). Five pesticides detected with high frequency corresponded to three compounds in an insecticide and two compounds in a fungicide. In the case of fluopyram, lettuce (n = 81), chives (n = 70), crown daisy (n = 45), and cucumber (n = 33) had the highest frequencies. Chlorfenapyr was detected in chives (n = 66) and chili pepper (n = 51), while chlorantraniliprole was detected in young radish (n = 55) and winter cabbage (n = 43). Fludioxonil was detected at a high frequency in chives (n = 61), pimpinella brachycarpa (n = 41), while thiamethoxam was detected in young radish (n = 49) and crown daisy (n = 43). The MRLs of fluopyram have been set for 74 commodity standards in the Korean Food Code. In Korea, among agricultural products with a high non-conformity rate, a temporary residual limit of fluopyram is enforced for chives and crown daisy. If these standards are eliminated, and agricultural products are regulated according to the PLS, the nonconformity rates may increase. This also applies to other pesticide residues; that is, the introduction of PLS can lead to a stricter management of pesticide residues.
Monitoring of the nonconforming agricultural products
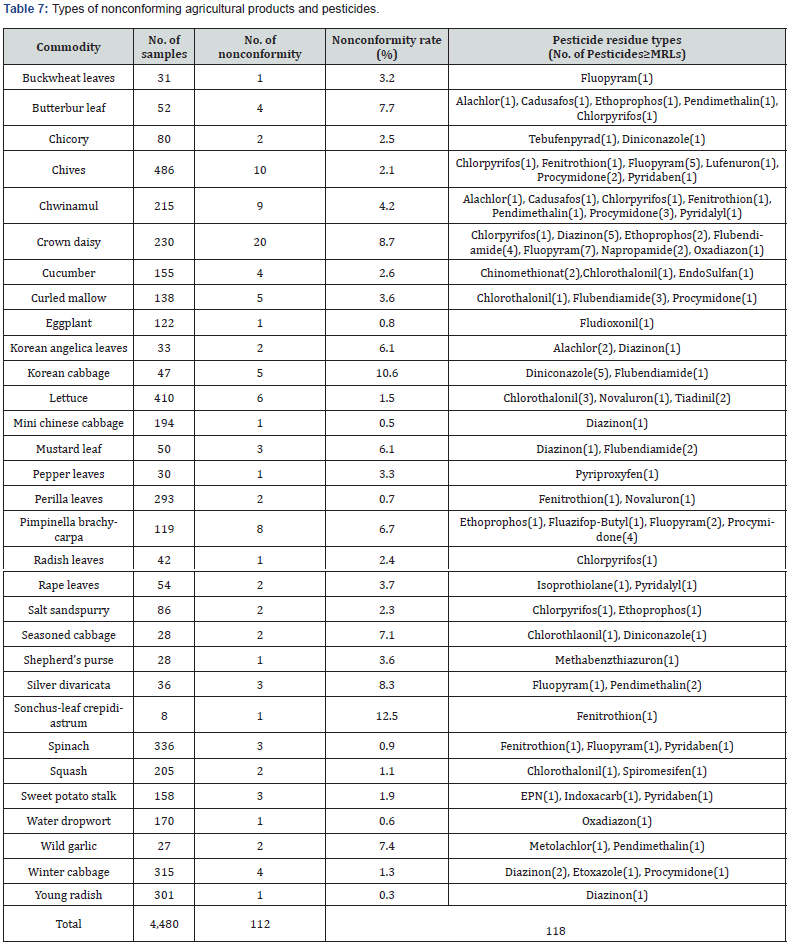
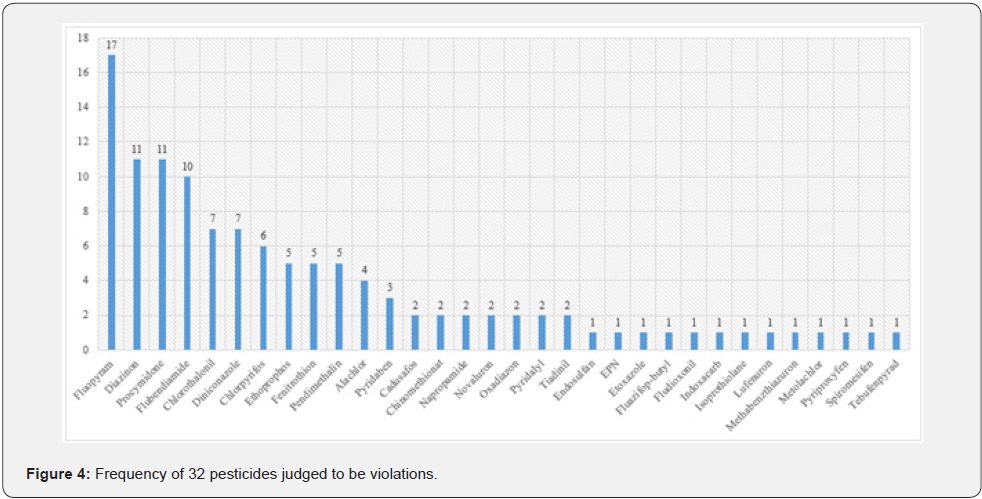
In our study, a total of 112 agricultural products of 31 types were found to exceed the 118 residual pesticide standard, including duplicate detection (Table 7). There were many nonconforming agricultural products in the order of crown daisy (n = 20), chives (n = 10), chwinamul (n = 9), pimpinella brachycarpa (n = 8), and lettuce (n = 6). A comparison of nonconformity rate of each agricultural product revealed that agricultural products exceeding the MRLs were the most frequent in the order of Sonchus-leaf crepidiastrum (12.5%), Korean cabbage (10.6%), crown daisy (8.7%), Silver divaricata (8.3%), and butterbur leaf (7.7%) Figure 4. shows 32 pesticide components that were deemed to be unsuitable in agricultural products. Some agricultural products contained two pesticides at concentrations exceeding the pesticide residue standards. Fluopyram (n = 17), diazinon, procymidone (n = 11), flubendiamide (n = 10), and chlorothalonil, diniconazole (n = 7) are representative pesticides that exceeded the pesticide residue standards. The fluopyram compound with the highest inconsistency was found in crown daisy (n = 7), chives (n = 5), pimpinella brachycarpa (n = 2), and germinated buckwheat/silver divaricata/spinach in one case each. Agricultural products with a high Nonconformity rate largely included many leafy vegetables/ stalks and stem vegetables. This is related to the permeability of the pesticide and the leaching of the pesticide from the surface of leafy products owing to its solubility in water [24].
Investigation of the impact of the introduction of the PLS on the evaluation of nonconforming agricultural products
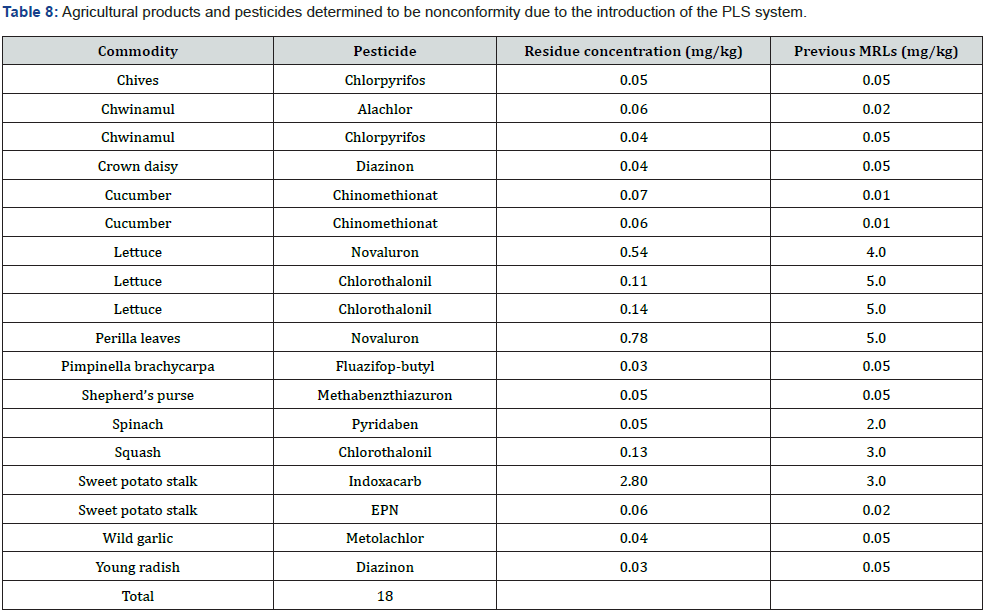
Among the agricultural products determined to contain pesticides at levels exceeding the pesticide residue standard, there were 37 agricultural products to which the PLS standard (0.01 mg/kg) was applied, and a total of 20 pesticides were identified 39 times. Diazinon (n = 8) and chlorothalonil (n = 4) are repive pesticides that were determined to be unsuitable at the 0.01 mg/kg standard. According to Method 2.6, the effects of the introduction of the PLS and nonconformity assessment were investigated. A total of 18 agricultural products would not have been deemed as nonconforming if the PLS was not introduced (Table 8). When the standards before the introduction of the PLS system were applied, It was found that the agricultural products belonged to the suitable category in the order of lettuce (n = 3), chwinamul, cucumber and sweet potato stalk (n = 2). In the case of lettuce, which occupied the most number of times, it was found to be suitable when the standard for leaf vegetables, a similar agricultural product, was applied. Therefore, it can be seen that is being managed more strictly with the introduction of PLS, suggesting that lettuce producer education is necessary. Chwinamul, sweet potato stalk and shepherd’s purse are representative minor crops. For minor crops cultivated over a small area, the registration of available pesticides does not meet the demand [25]. There are many types of minor crops and various pests, and accordingly, the registration of pesticides for small-area crops has not been activated, which is a global issue [26]. This causes difficulties in the production of crops and leads to a trend of high pesticide detection rates and nonconformity rates. The expansion of the PLS application implies that as the risk assessment standard of each agricultural product becomes stricter, the concerned agricultural product can be deemed as a nonconforming product. This suggests that the development of harmless pesticides by related organizations is of urgency, and that it is necessary to develop new pesticides to prevent damage to farmers and consumers. In addition, to improve the conformity based on the PLS standards, it is necessary to educate farmers on contamination owing to unintentional mixing of pesticides and appropriate use of suitable pesticides. The results of this study can be used as fundamental data for pesticide management, system supplementation of agricultural products, and reinforcement of field management.
Conclusion
In this study it was confirmed that temperature and precipitation, which are climatic factors, affect the concentration of pesticide residues. According to correlation analysis results, a high detection rate in autumn, high nonconformity rate in low temperature and low precipitation were confirmed. Therefore, we propose the necessity of pesticide management and caution on agricultural products consumption in consideration of climatic factors (autumn, winter, after heavy rain). Pesticide residues were detected in 51.1% and exceeded the MRL in 2.0% of agricultural products. As a result of monitoring the residual pesticide list of agricultural products, the most frequent pesticides were fluopyram, chlorfenapyr and chlorantraniliprole. The most frequent unsuitable agricultural products were daisy, chives, chwinamul, pimpinella brachycarpa and lettuce.
As a result of investigating the effect of the introduction of the PLS standard on the evaluation of non-conforming agricultural products, 18 agricultural products were found to be in the suitable when the previous criteria were applied. Despite the short research period, it was found that food safety could be secured as the standards were strengthened. Therefore farmers should use only registered crops and spray targets for each pesticide, and must comply with the timing and frequency of use. In addition, it is proposed to conduct education of PLS system for various stakeholders such as local government officials, farmers, and pesticide dealers. This study could serve as basic data for pesticide residue prevention, management, control and monitoring in countries seeking to tighten pesticide standards.
Acknowledgement
This research was supported by a research project at the Health and Environment Research Institute of Gwangju, Republic of Korea.
References
- Tudi M, Daniel RH, Wang L, Lyu J, Ross S, et al. (2021) Agriculture development, pesticide application and its impact on the environment. Int J Environ Res Public Health 18(3): 1112.
- Aktar MW, Sengupta D, Chowdhury A (2009) Impact of pesticides use in agriculture: their benefits and hazards. Interdiscip Toxicol 2(1): 1.
- Chawla P, Kaushik R, Swaraj VJS, Kumar N (2018) Organophosphorus pesticides residues in food and their colorimetric detection. Environ nanotechnology, Monit Manag 10: 292-307.
- Bhandari G, Zomer P, Atreya K, Mol HGJ, Yang X, et al. (2019) Pesticide residues in Nepalese vegetables and potential health risks. Environ Res 172: 511-521.
- Park DW, Yang YS, Lee YU, Kim HJ, Kim SH, et al. (2021) Pesticide residues and risk assessment from monitoring programs in the largest production area of leafy vegetables in South Korea: a 15-year study. Foods 10(2): 425.
- Kang HR, Park YB, Do YS (2018) A safety survey on pesticide residues in tropical fruits depending on implementation of positive list system. J Food Hyg Saf 33(4): 310-315.
- Kim CK, Lee JK, Oh SA (2021) Monitoring of Pesticide Residues in Agricultural Products in Gangseo, Seoul, by Introduction of the Positive List System. J Food Hyg Saf 36(2): 163-171.
- Song SH, Kim KY, Kim YS (2021) Comparative analysis of pesticide residues in agricultural products in circulation in gyeonggi-do before and after positive list system enforcement. J Food Hyg Saf 36(3): 239-247.
- Chen CC, McCarl BA (2001) An investigation of the relationship between pesticide usage and climate change. Clim Change 50(4): 475-487.
- Chen CC, McCarl BA (2001) Pesticide usage as influenced by climate: a statistical investigation. Clim Change 50(1-2): 475-487.
- Delcour I, Spanoghe P, Uyttendaele M (2015) Literature review: Impact of climate change on pesticide use. Food Res Int 68: 7-15.
- Rosenzweig C, Iglesius A, Yang XB, Epstein PR, Chivian E (2001) Climate change and extreme weather events-Implications for food production, plant diseases, and pests. Published online.
- SANCO (2013) European Commission Health & Consumer Protection, Guidance Document on Analytical Quality Control and Validation Procedures for Pesticide Residues Analysis in Food and Feed.
- ICH (1995) International Council for Harmonisation of Technical Requirements for Pharmaceuticals for Human Use (ICH), Validation of Analytical Procedures: Text and Methodology Q2 (R1).
- Ratner B (2009) The correlation coefficient: Its values range between +1/−1, or do they?. J Target Meas Anal Mark 17: 139-142.
- Korea Meteorological Administration.
- Shapiro SS, Wilk M (1965) An analysis of variance test for normality (complete samples). Biometrika 52(3-4): 591-611.
- (2018) Rural Development Administration, Smart Greenhouse Environment Management Guidelines.
- Fujita M, Yajima T, Tomiyama T, Iijima K, Sato K (2014) Comparison of pesticide residue levels in headed lettuce growing in open fields and greenhouses. Journal of Pesticide Science 39(2): 69-75.
- Sharma D, Hebbar SS, Divakara JV, Mohapatra S (2012) Residues of pesticides acephate and methamidophos in capsicum grown in greenhouse and open field. Quality Assurance and Safety of Crops & Foods 4(5): e33-e37.
- Ramadan MFA, Abdel-Hamid MMA, Altorgoman MMF, AlGaramah HHA, Alawi MA, et al. (2020) Evaluation of pesticide residues in vegetables from the Asir Region, Saudi Arabia. Molecules 25(1): 205.
- Galani JHY, Houbraken M, Wumbei A, Djeugap JF, Fotio D, et al. (2018) Evaluation of 99 pesticide residues in major agricultural products from the Western Highlands Zone of Cameroon using QuEChERS method extraction and LC-MS/MS and GC-ECD analyses. Foods 7(11): 184.
- Skretteberg LG, Lyrån B, Holen B, Jansson A, Fohgelberg P, et al. (2015) Pesticide residues in food of plant origin from Southeast Asia–A Nordic project. Food Control 51: 225-235.
- Jaggi S, Sood C, Kumar V, Ravindranath SD, Shanker A (2000) Loss of quinalphos during tea processing. Pestology 24(12): 42-46.
- Lee MG (2013) Management and regulation on the minor use of pesticides in Korea and foreign countries. Korean J Pestic Sci 17(3): 231-236.
- Ahn CH, Kim YH, Eom HS, Lee GH, Ryu GH (2014) A study on crop group for pesticide efficacy and crop safety of minor crops. Korean J Pestic Sci 18(4): 364-375.


