Investigating Consumers’ Preference on Fresh Vegetables in Bangladesh: Best-Worst Scaling Approach
PK Sarma*
BAU Research System (BAURES), Bangladesh Agricultural University, Bangladesh
Submission: March 10, 2020; Published: March 17, 2020
*Corresponding author: PK Sarma, BAU Research System (BAURES), Bangladesh Agricultural University, Bangladesh
How to cite this article: PK Sarma. Investigating Consumers’ Preference on Fresh Vegetables in Bangladesh: Best-Worst Scaling Approach. Agri Res& Tech: Open Access J. 2020; 24(1): 556253. DOI: 10.19080/ARTOAJ.2019.22.556254
Abstract
Safety vegetables are nutritionally essential for our good health, but we are daily fighting against to take “Safe and Fresh Vegetables” for “sake of “Good Health” due to contamination, adulterations and pesticides residues effects. The aim of the study was to examine the consumers’ preference for food quality and safety attributes of fresh vegetables by using quality and safety attributes of fresh vegetables using the best-worst scaling technique. The balanced incomplete block design procedure was employed to obtain a total 180 sample from Dhaka and Mymensingh city of Bangladesh. The data were collected through survey monkey software by using the pre-determined structured questionnaire and analyzed by the MaxDiff scaling and multinomial mixed logit regression model. The results revealed that fresh vegetable attributes were a combination of size, appearance, texture, freshness, and flavor as well as nutritional ingredients and safety aspects that determine their value to the consumer. The fresh vegetables contained vitamins, minerals and dietary fiber that satisfied consumer demand and helped to keep healthy and protect from diseases. The researchers found that nutritional value, purity, freshness, shelf life and safety are the most important attributes of fresh vegetables and variety, size, content, colour are the least important for the consumers. The study concludes that demand for can be significantly stimulated in the study area when these most important attributes have been considered by producers, processors, and marketers.
Keywords: Fresh Vegetables; Consumers ‘preferences; Food safety; Products attributes; BWS
Introduction
Bangladesh is the 3rd position in global vegetable production, but it remained in the lower position in intake. The total vegetables production is 3.73 million but demand annually 13.25 million metric tonnes in Bangladesh (FAO, 2015). According to the World Health Organization (WHO), a healthy individual should take 220 grams of vegetable daily of which Bangladesh is intake only 70 percent of need. Vegetables are the main sources of essential vitamins such as A, C, niacin, riboflavin and thiamin, minerals such as calcium and iron and dietary fiber. They added to eat of crucial nutrients from other foods by making the more taste and dietary fiber necessary for digestion and maintaining health curing nutritional disorders [1]. Vegetables are not only minimizing the malnutrition but also maximize the economic returns.
Farmers are widely using toxic chemicals for vegetables production and pesticides uses to fight against pests. That’s why vegetables are adulterated by various harmful chemicals and pesticides. On the other hand, traders are using toxic artificial ingredient and colors to extend its appearance and shelf life. Using chemical preservatives without concern for the health of the consumer is rampant. Now a day, food adulteration is becoming a “Silent Killer” in Bangladesh. Because, vegetables are contaminated by toxic chemicals and pesticides like carbide, formalin, heavy metal, chemical, textile colors, artificial sweeteners, DDT, urea and so on pose a serious threat to public health especially damaging vital organs like liver, kidney, pancreas etc. It is very difficult to find fresh and adulteration free vegetables in the market. For this reason, the worldwide fresh vegetables market has growing rapidly in recent years to a multi-billion-dollar sector, largely driven by increasing population growth, urbanization and changing consumption pattern as a result increasing consumer demand for healthy, freshly prepared convenient vegetables [2]. The quality of fresh vegetable includes a combination of attributes like appearance, texture and flavor, as well as nutritional and safety aspects that determine their value to the consumer. But challenge for producers, traders and retailers in market is to predict consumer preferences for vegetables, because consumers represent the essential demand for vegetables and this demand is always not stable. Moreover, several studies [3,4] have been undertaken to determine consumer preferences for vegetable attributes and respective willingness to pay for various characteristics, thereby providing vegetables with desirable attributes to consumers and keeping the market fresh and alive. Furthermore, the lack of food safety, food security, nutrition and profitability are a problem no inherent to nature but with unjust societal systems and institutions. Lusk and Briggeman [5] also argued that understanding why consumers prefer a given attribute is important to determine the presence of market failure and therefore the need for public policy intervention. That’s why, researchers set the objective of study is to elicit fresh vegetables attribute preferences among quality conscious consumers in Dhaka city and Mymensingh city of Bangladesh.
Theoretical framework of Best-Worst Scaling (BWS)
Best-Worst Scaling (BWS) is also called Maximum Difference Scaling (MaxDiff.) which is based on random utility theory (Thurstone, 1927; Cohen 2003) [6-8]. It is defined as a choicebased measurement approach that reconciles the need for question parsimony with the advantage of choice tasks that force individuals to make choices. BWS be a way to overcome some key shortcomings of common rating approaches (e.g. ties among items, response style bias, and standardization difficulties [9]. The BWS is superior to other methods, such as rating scales, because it forces respondents to discriminate between items, so results obtained from BWS are easy to interpret [10]. Unlike the rating scale, the BWS can also be used to compare both the intra and inter attributes. It builds on a body of items. The BWS approach effectively permits respondents to evaluate all pairwise combinations of alternatives presented in a particular subset leading to the assumption that their “Best” and “Worst” choices represent the maximum difference in utility between all attributes. A respondent gets presented a series of sets and is asked to choose one best item and one worst item in each set. BWS assumes everyone has a latent scale of “utility” or “importance”, and the scale value of objects will determine a person’s choice over these objects. This scale value consists of two parts: one systematic part which can be understood as “intrinsic”, and one random error component. Therefore, the probability of a certain project chosen as the best given other K options can be expressed as:

in which, and represent the scale value, the systematic component of the scale value and the error term respectively. McFadden further developed the conditional logit model under the independently and identical distribution assumption of the error terms, and the choice probability can be expressed as below [6,8].

Compared with other designs there are several advantages of BWS. It is suggested that choosing the “best” and the “worst” from a set of options can generate relatively consistent results compared to the ranking task and it offers more information than simply choosing the “best”. Besides, when attributes under evaluation have multiple levels, BWS approach enables a comparison of all attribute levels on a single scale by setting only one level as reference [8,11].
BWS Design is to Estimates of Consumers’ Rank of Preferences
The BWS is widely used for collecting data to analyze the consumers’ preferences and becoming popular over time. It forces respondents to discriminate between scaled items and uses an underlying scale ratio of measurement [12]. This BWS method is consistent with consumer utility maximization. Based on this method, respondents are presented a set of items and they are demanded to indicate which one is the best and which is the worst [12]. For instance, the BWS was applied to investigate the relative importance consumers place on food values and to study preferences for sustainable farming practices [13]. Furthermore, efficient estimates can be obtained when repeated choices are made by the same respondent, which is the case in this present study [14]. Finally, the BWS method is gaining more popularity as a better alternative to the rating system and measuring value [15]. Therefore, the BWS method reported above fit well in this present study related to consumers’ preferences for quality and safety attributes of fresh vegetables. This is captured by the difference between the most preferred and least preferred items chosen from the set, when consumers are making a purchase decision. This can be mathematically represented as in this equation:

Where,
Uij is the utility for consumer i choosing vegetables having attribute, Vij and εij are the deterministic component and the error term of utility, respectively.
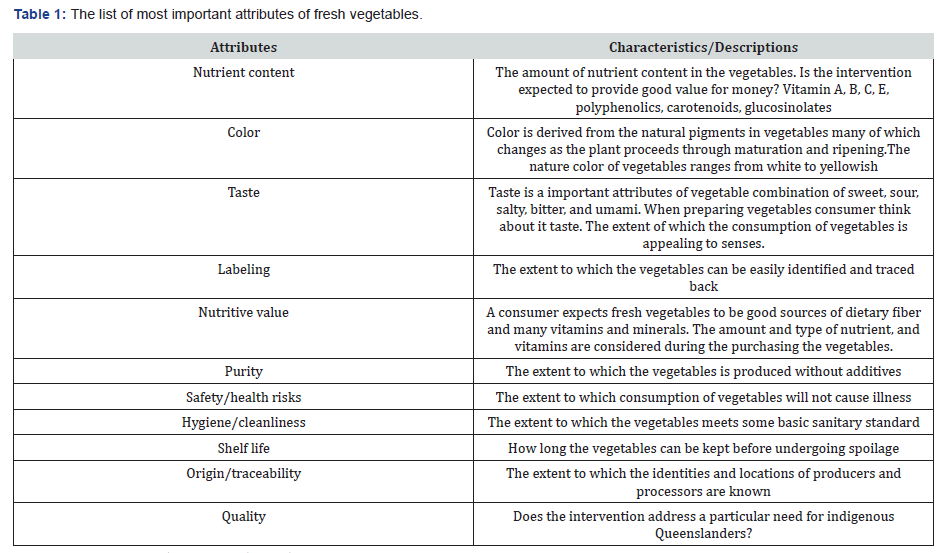
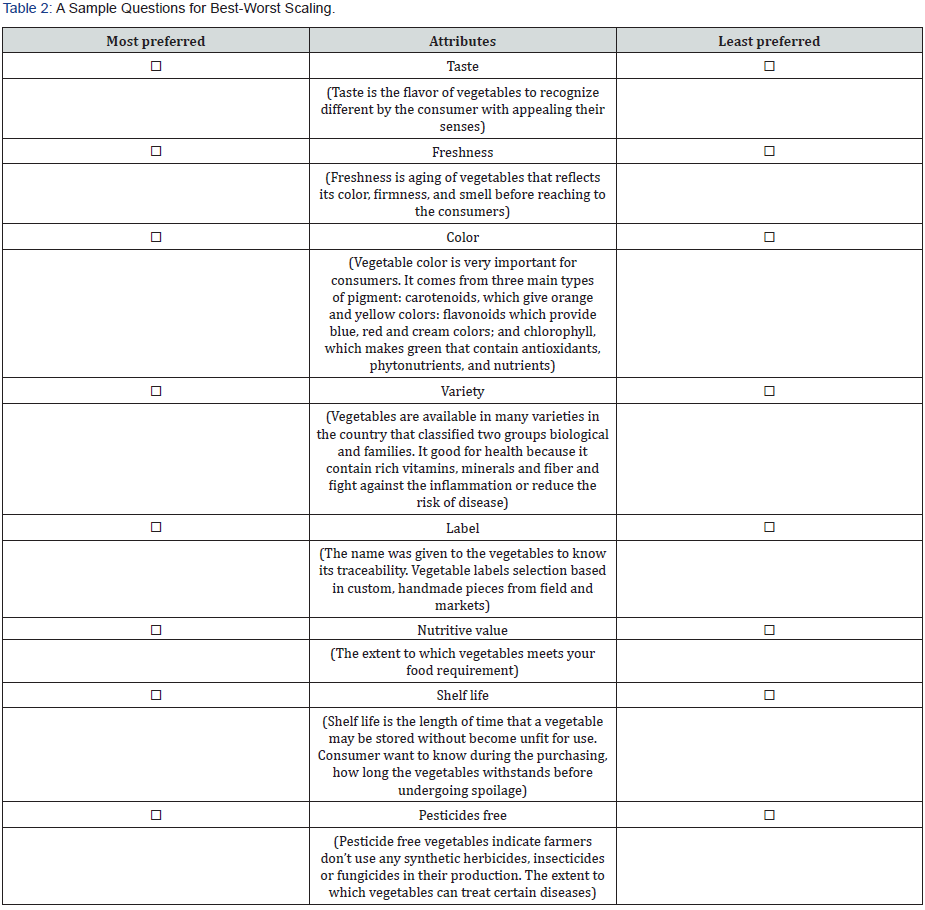
BWS was used to determine values which consumers placed on quality and safety. Thus, the balanced incomplete block design (BIBD) method was used to design the questionnaire administered to respondents. In total 15 (fifteen) attributes of vegetables have been considered in the study (Table 1). Fifteen blocks or questions and eight attributes were randomly assigned to each. This questionnaire was used to collect data from Dhaka and Mymensingh City such as city market, shops, open vendor where vegetables are sold to consumers [16-19]. For each question are asked to choose which option of vegetables attributes they most preferred and which one they least preferred. A sample question for this study based on best-worst scaling method is presented in Table 2.
Materials and Methods
The study was conducted in Dhaka and Mymensingh City of Bangladesh because of large number of urban populations, quality conscious consumers live in the cities that’s why a considerable amount of the fresh vegetables are comes here from all over the country. The balanced incomplete block design technique was used to obtain a total 180 sample (100 Dhaka City consumers and 80 Mymensingh City). Survey Monkey software was used to collect by pre-determine structured questionnaire and interviewed in F2F due to lack of reached respondents by e-mail, phone and internet facilities of Bangladeshi people. Descriptive statistics, BWS/MaxDiff and multinomial mixed logit regression model were used to analyze the collected data.
Results and Discussion
Demographics characteristics of survey consumers
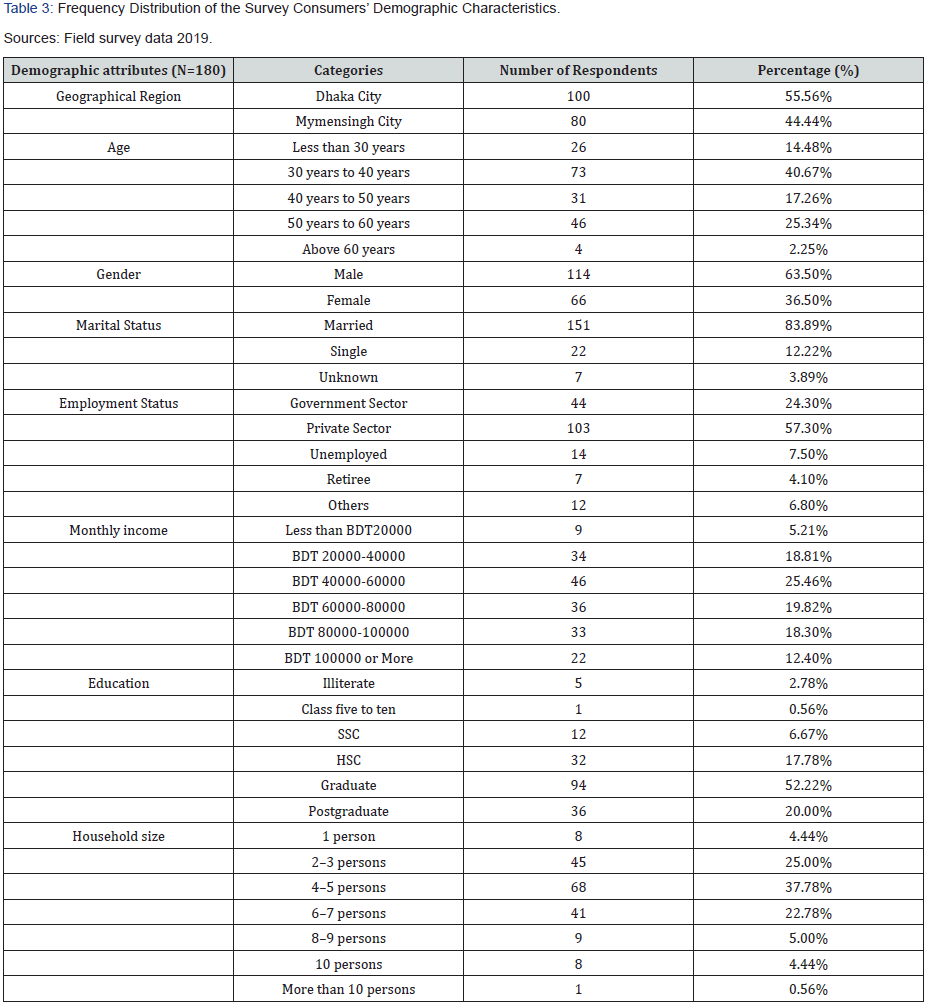
The demographic profiles of respondents are illustrated in the Table 3. Among the total respondents about 63.50% were male and 36.50% were female. The ages were grouped into five categories and found that the highest (40.67%) age group under 30-40 years old and followed by 50-60 years old (25.34%), 40-50 years old (14.48%) and above 60 years old (2.25%) which is indicated most of the young respondents involved in household buying activities. As for matrials status about 83.89% were married, 12.22% were unmarried and 3.89% were unknown about the marital information as per survey questionnaire in the study areas. About 24.30% were employed in Government sectors, 57.30% were in private sectors, 7.50% were unemployed and 4.10% were retired. The result found that 5.21% of respondents’ income was below BDT 20000 per month, 18.81% was in BDT 20000-40000, 25.46% was BDT 40000-60000, 25.46% was BDT 60000-80000, 19.82% was in BDT 80000-100000 and 12.4% was BDT 100000 and above, respectfully. The household size was 1-10 member with a relatively high share of respondent 37.78% were 4-5 persons per family, 25.00% was 2-3 persons per family, 22.78 % was 6-7 persons per family, 5.00% was 8-9 persons per family, 4.44% were about 10 persons and 0.56% were more than 10 persons per family and 4.44% was living alone. The Table 3 also showed that about 52.22% of the respondent had graduate education. This was followed by 20.00% had postgraduate, 17.78 % had higher secondary education, 6.67% had secondary education. This implies that most of the respondents attained certain level of formal education, which would facilitate understanding of improved selection method of fresh vegetable of the respondents more receptive to advisory services [20-25].
Multinomial Mixed Logit (MML) model Estimates of Vegetables Attribute
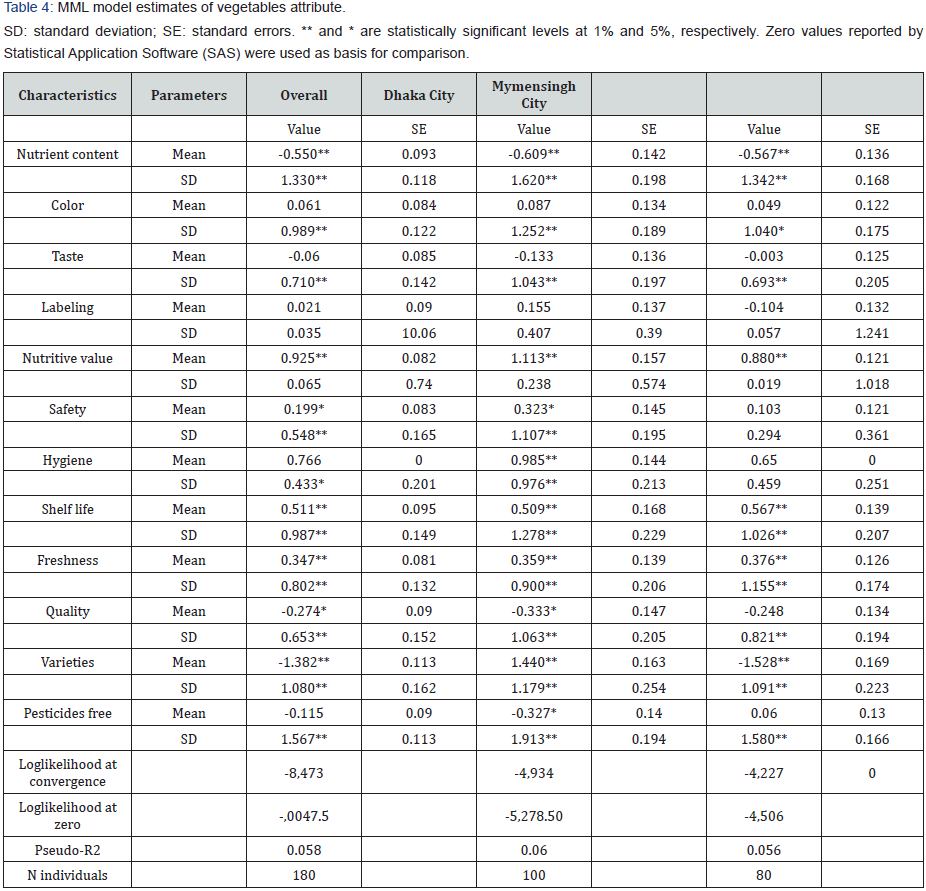
The Table 4 shows that parameter estimates from the MML model. The coefficients with positive sign indicate that attributes are preferred, while coefficients with negative signs indicate that attributes are not preferred by consumers. The results found that nutritive value, shelf life, availability, purity and safety are positive and statistically significant, implying that consumers preferred to have vegetables products with these attributes. It also shows that varieties, nutrient content, packaging and handling convenience were negative and statistically significant, indicating consumers significantly discounted vegetables products having these attributes and standard deviation regardless of location (Dhaka city or Mymensingh city) for nutrient content, color, shelf life, purity, safety, hygiene, availability, handling convenience, type of animals, origin, food miles and therapeutic value were statistically significant, implying that these parameters indeed randomly vary over the population.
Relative Important of Consumers’ Perceptions of on Fresh Vegetables
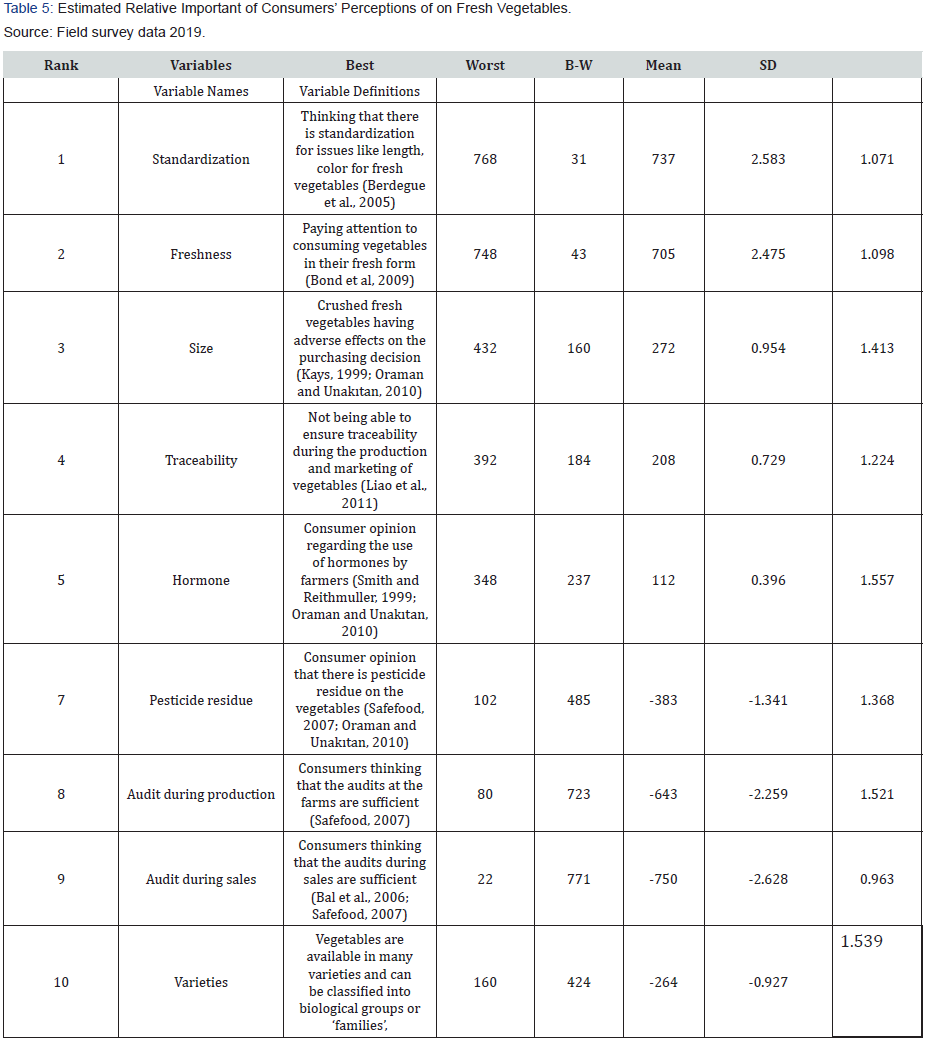
The relative importance of 15 (fifteen) attributes of vegetables is estimated by using MML model (Table 5). Researchers found that nutritive value, on average, is the most important vegetable attributes and significantly more important than hygiene, shelf life, availability, purity and safety are the next most important. Table 5 summarizes the results of simple count analysis. The relative importance of each variable is indicated by its B-W score, and the standard deviation suggests the degree of heterogeneity of consumers’ perceptions on fresh vegetable attributes for food safety. The result shows that “standardization” “freshness” “physical appearance” and “traceability” are substantially more highly valued than the rest of the attributes, while “audit during sales life as long as possible” and “cold chain with pesticide and chemical used when asked by consumers” are underrated by most respondents. Most consumers are inclined to hold more positive attitudes towards “physical appearance to traceability”, “hormone” and “fertilizer residue”, and understate the importance of “fertilizer residue” and “pesticide residue costs with producers”. Nevertheless, consumer’ perceptions on the importance of vegetable attributes, such as “hormone”, “fertilizer residue” and “pesticide residue life as long as possible” tend to diverge as reflected by the large standard deviations of their B-W scores, which also suggests the need to further exp lore respondent heterogeneity [26-30].
BWS for Consumers Preferences
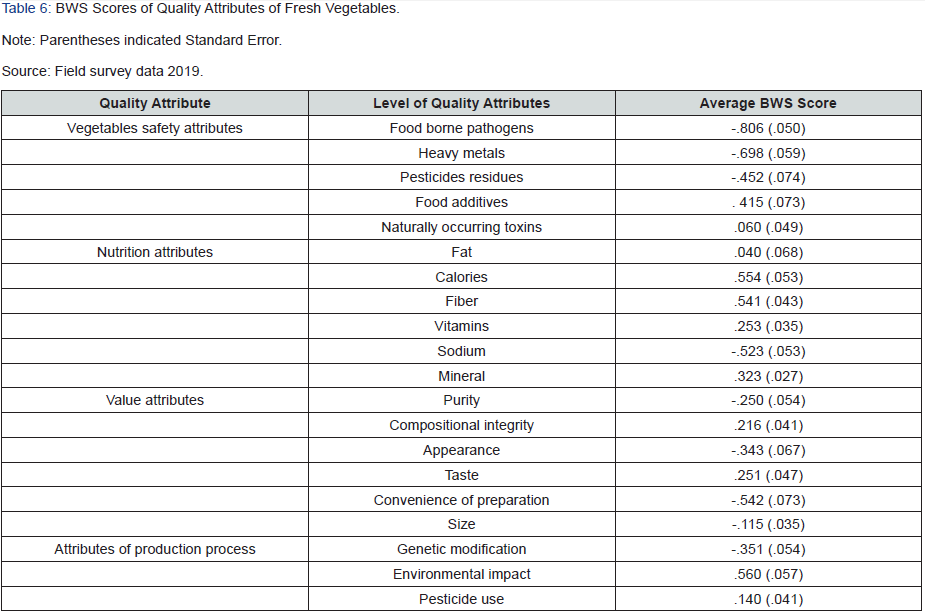
Table 6 showed that the average BWS scores with high scores corresponding to attributes that were like and the low scores corresponding to attributes that were disliked. The scores reflect some expected patterns which provide some evidences that our consumers appropriately read and interpreted the questionnaire. BWS scores also support quantitative comparison between levels within an attribute, and even across attributes something that is not possible with traditional likert-scale ratings. The Table 6 shows that the average best-worst scaling (BWS) score were -0.806 for food borne pathogens, -0.698 for heavy metals, -0.452 for pesticide residues, 0.415 for food additives, .060 for naturally occurring toxins and -0.340 for veterinary residues of food safety attributes. The average best-worst scaling (BWS) score of nutrition attributes were fat (0.040), calories (0.554), fiber (0.541), vitamins (0.253), sodium (-0.523), and mineral (0.323). Under the value attributes of fresh vegetables, the BWS scores were purity (-0.250), compositional integrity (0.216), appearance (-0.343), taste (0.251), convenience of preparation (-0.542) and size (-0.351). The average best-worst scaling (BWS) scores of production process attributes were genetic modification (-0.351), environmental impact (0.560) and pesticide use (0.140).
Conclusion
BWS was used to identify the fresh vegetables attribute preference among the quality conscious consumers in the selected areas of Bangladesh. BIBD method was used to design the questionnaires and 180 consumers were purposively sampled and interviewed. The results found that nutritive value, shelf life, availability, safety and purity are the most important attributes, whereas verity, nutrient content, handling convenience and food miles are the least important attributes. This indicates that consumers place a high preference for nutritive value, shelf life, availability, safety and purity attributes of fresh vegetables. It implies that consumers are more concerned about vegetables with these attributes and this can significantly stimulate demand. The output also helps people along the value chain of vegetables to provide consumers with desirable attributes of vegetables, thereby enhance not only the profitability of their business, but also improve the overall welfare of consumers. The BWS technique, however, appropriate in ranking order of importance, had never been used in ranking choice of fresh vegetable purchase. Finally, the study created future direction for ranking of choice setting of consumer behavior analysis to researchers, academician and policymaker in context of Bangladesh as well as developing countries.
Acknowledgment
The authors gratefully thank the anonymous reviewers of this article for helpful comments for further improvement. The authors also acknowledge the contributions of other study team who are involved in a team. All referees and the journal editor are gratefully appreciated for their valuable comments, consequent recommendation and suggestions on earlier drafts of this manuscript.
References
- Terry, Leon (2011) Health Promoting Properties of Fruits and Vegetables. CABi p. 2-4.
- Francis GAA, Gallone A, Nychas GJ, Sofos JN, Colelli G, et al. (2012) Factors Affecting Quality and Safety of Fresh-Cut Produce. Critical Reviews in Food Science and Nutrition 52: 595-610.
- Lusk LJ (2013) The Food Police: A Well-Fed manifesto about the Politics of Your Plate. New York: Crown Forum, Inc.
- Lister GM, Tonsor G, Brix M, Schroeder T, Yang C (2014) Food Values Applied to Livestock Products. Working paper.
- Lusk LJ, Briggeman B (2009) Food Values. American Journal of Agricultural of Agricultural Economics 91(1): 184-96.
- McFaden D (1974) Conditional Logit Analysis of Qualitative Choice Behaviour in Zarembka. Frontiers in Econometrics, New Yourk, NY: Academic Press pp. 105-142
- Cohen E (2009) Applying Best-Worst Scaling to Wine Marketing. International Journal of Wine Business Research 21(1): 8-23.
- Louviere J, Lings I, Islam T, Gudergan S, Flynn T (2013) An Introduction to the Application of (Case 1) Best-Worst Scaling in Marketing Research. International Journal of Research in Marketing 30(3): 292-303.
- Cohen S, Orme B (2004) What’s Your Preference? Asking Survey Respondents about Their Preferences Creates New Scaling Decisions. Marketing Research 16: 32-37
- Finn A, Louviere JJ (1992) Determining the Appropriate Response to Evidence of Public Concern: The Case of Food Safety. Journal of Public Policy and Marketing 11(2): 12-25.
- Flynn TN, Louviere JJ, Peters TJ, Coast J (2007) Best-Worst Scaling: What It Can Do for Health Care Research and How to Do It? Journal of Health Economics 26(1): 171-89.
- Flynn TN, Marly AAJ (2012) Best-Worst: Theory and Methods. Working Paper Series No. 12-002.
- Sackett HM, Shupp R, Tonsor G (2013) Consumer Perceptions of Sustainable Farming Practices: A Best-Worst Scenario. Agricultural and Resource Economics Review 42(2): 275-290.
- Revelt D, Train K (1998) Mixed Logit with Repeated Choices: Households’ Choices of Appliance Efficiency Level. Review of Economics and Statistics 80(4): 647-657.
- Lee JA, Soutar GN, Louviere J (2007) Measuring Values Using Best-Worst Scaling: The LOV Example. Psychology and Marketing 24(12): 1043-1058.
- Abubakar MI, Amadou Z, Daniel K (2014) Best-Worst Scaling Approach in Predicting Seed Attribute Preferences among Resource Poor Farmers in Northern Nigeria. International Journal of Humanities and Social Science 2(9): 304-310.
- Bal HS, Göktolga ZG, Karkacier O (2006) Consumer Awareness on Food safety: The Case of Tokat. Journal of Agricultural Economics 12 (1): 9-18.
- Berdegue JA, Balsevich F, Flores L Reradon T (2005) Central American Supermarkets’ Private Standards of Quality and Safety in Procurement of Fresh Fruits and Vegetables. Journal of Food Policy 30(3): 254-269.
- Bond JK, Thilmany D, Bond C (2009) What Influences Consumer Choice of Fresh Produce Purchase Location? Journal of Agricultural and Applied Economics 41(1): 61-74.
- Cannon GC (1992) Food and Health: The Exports Agree. An Analysis of 100 Authoritative Scientific Reports on Food. Nutrition and Public Health Published throughout the World in Thirty Years, between 1961 and 1991, Consumers Association, London, UK.
- FAO (2005) Statistical Yearbook 2013/2014 2, FAO Rome.
- Ijabadeniyi OA (2010) Effect of Irrigation Water Quality on the Microbiological Safety of Fresh Vegetables. PhD thesis, Pretoria University of Agricultural and Food Science, Johannesburg, South Africa.
- Kays SJ (1999) Pre-harvest Factors Affecting Appearance. Proharvest Biology and Technology 15(3): 233-247.
- Lerici CR, Nicoli MC, Anese M (2000) The Weight Given to Food Processing at the Food and Cancer Prevention III, Symposium. Italian Journal of Food Science 12(1): 3-7.
- Liao PA, Chang HH, Chang CY (2011) Why is the Food Traceability System Unsuccessful in Taiwan? Empirical Evidence from a National Survey of Fruits and Vegetable Farmers. Journal of Food Policy 36(5): 686-693.
- Oraman Y, Unakitan G (2010) Analysis of Food Influencing Organic Fruits and Vegetable Purchasing in Istanbul, Turkey. Journal of the Ecology of Food and Nutrition 49(6): 452-466.
- Safefood (2007) A Review of the Fruit and Vegetable Food Chain: Consumer Focused Review of the Fruit and Vegetable Food Chain.
- Sawtooth (2013) The MaxDiff System Technical Paper.
- Smith D, Reitmuller P (1999) Consumer Concerns about Food Safety in Australia and Japan. International Journal of Consumer Economics 26(6): 724-743.
- Tabbo AM, Amadiou Z, Danbaky AB (2016) Evaluating Farmers Adaptions Strategies to Climate Change: A Case study of Kaou Local Government Area, Tahoua State, Niger Republic. Jamba, Journal of Disaster Risk Studies 8(3).


