


Modeling Diameter Distributions of Nauclea diderrichii Stands in Omo Forest Reserve, Nigeria with Johnsons SB
Ogundipe OC*, Osho JSA and Olukunle OD
Department of Social and Environmental Forestry, University of Ibadan, Nigeria
Submission: October 08, 2018; Published: October 25, 2018
*Corresponding author: Ogundipe OC, Department of Social and Environmental Forestry, University of Ibadan, Oyo state, Nigeria;
How to cite this article: Ogundipe O, Osho J, Olukunle O. Modeling Diameter Distributions of Nauclea diderrichii Stands in Omo Forest Reserve, Nigeria with Johnsons SB. Agri Res& Tech: Open Access J. 2018; 18(3): 556061. DOI: 10.19080/ARTOAJ.2018.18.556061
Abstract
Modeling the diameter distribution of a stand is an effective way for obtaining reliable information on the growth, yield and structure of forests. However, this aspect of modeling has not been adequately utilized in many forest plantations, especially in Nigeria. Therefore, this study presents the usefulness of the Johnson SB function for characterizing the diameter of Nauclea diderrichii plantation in Omo Forest Reserve, Nigeria. Thirty six plots of size 0.062ha each were randomly selected across three age series (43, 42 and 41). Tree size variables measured from each plot include diameter at breast height, total and merchantable height, crown diameter and length. Three fitting methods of the SB distribution was used and compared, namely: conditional maximum likelihood, moments (MOM), and Knoebel and Burkhart methods. The three methods were assessed based on Kolmogorov-Smirnov value, mean square error, mean absolute error, and bias. The results showed that the underlying diameter distribution of the Nauclea diderrichii stands in Omo followed the Johnsons SB distribution fitted with MOM best because it had the least values of Kolmogorov Smirnov, bias, mean absolute error and mean square error across the three ages investigated.
The results obtained after recovering the parameters of the SB distribution were comparable with the real distributions of the Nauclea diderrichii stand. The adopted and developed models were assessed using coefficient of determination, root mean square error. Model validation was done using percentage bias and this ranges from 0.001 to 2.2%. Therefore, all categories of models generated in this study with good fit are recommended for use in Nauclea diderrichii plantation in Omo forest reserve, Nigeria.
Keywords: Johnson SB; Models; Moments; Maximum likelihood; Nauclea diderrichii
Abbrevations: Dbh: Diameter at Breast; KB: Knoebel and Burkhart Method; MOM: Methods of Moment; CML: Conditional Maximum Likelihood Method; MSE: Mean Square Error; MAE: Mean Absolute Error; RMSE: Root Mean Square Error; THT: Total Height; GOF: Goodness of Fit
Introduction
Sustainable forest management requires information about both current and future conditions of a growing stock, this information is essential for valuation and decision making. Diameter at breast height (Dbh) is an important tree growth variable, it is easily measured with simple instruments and widely used in forest inventories. Earlier studies on tree diameter have shown that information about Dbh can be used in estimation of various tree and stand variables such as; volume [1], height [2], crown dimensions [3].
The idea of diameter distribution dated back to 1898 when DeLiocourt observed that plotting the number of trees against diameter classes as a frequency histogram results in an inverse J-shaped [4]. Many models of probability density functions have been used to describe the structure of a forest stand in recent forest practices. In forestry, quite a number of probability density functions (pdf) have been used to characterize and describe tree stock in mathematical form all over the world [5], some of these functions include: beta distribution [6], Johnson’s SB [5,7], gamma [8], and Weibull distribution [6,7,9]. Some of the criteria for selecting a distribution function include: ease of parameter estimation, flexibility to describe a broad spectrum of shapes, simplicity of integration methods for estimating proportions indifferent size classes, and accuracy in fitting the observed data [10].
Johnson’s SB pdf has been reported to be more flexible in the skewness and kurtosis space when compared to other pdf by various authors [6,7], but in Nigeria focus is usually placed on the use of Weibull and Beta functions. Although, a recent work using Johnson SB pdf was carried out in Nigeria by Ogana et al. [5], who carried out a study on the diameter characterization of Gmelina arborea using Johnsons SB PDF but like other studies on diameter distribution using other probability density function, emphasis was placed on exotic species with little considerations for indigenous species like N. diderrichii. Hence, this is counterproductive to learning, documentation and management of Nauclea diderrichii stands in Omo Forest reserve.
A number of methods have been used to estimate the parameters of Johnson’s SB distribution, these include: method of moments, mode, percentile, conditional maximum likelihood, linear regression method, and Knoebel and Burkhart method. Various studies have shown that these estimation methods differ noticeably in their level of performance. In recent times, Gorgoso-Varela & Rojo-Alboreca [7], evaluated the performance of conditional maximum likelihood, mode, moments, and the Knoebel and Burkhart method revealed that moments performed better than the other methods. Zhous & McTague [11], also evaluated the performance of conditional maximum likelihood, mode, linear regression, percentile, and the Knoebel and Burkhart method for the estimation of the Johnson system parameters. They reported that the linear regression methods gave the best performance. Evidently, the method of conditional maximum likelihood, moments, and linear regression method remain the best methods for estimating the Johnsons SB distribution. However, the linear regression method is time consuming compared to other methods [11], even though it is easily computable. Some studies have utilized the parameter recovery method to recover the parameters of the SB distribution. For example, Parresol [12], recovered the parameters of the SB distribution from the median and non-central moments of the diameter distribution however this method has not been fully applied to most distribution studies in Nigeria and the few studies available on it has always been on exotic species such as teak.
Nauclea diderrichii (Sarcocephalus diderrichii De Wild) is a tropical African hardwood species belonging to the family Rubiaceae. The species is widely distributed across tropical Africa. It is a sun loving and moderately fast-growing species, with fairly high-density timber and durable wood. The desirable properties of any timber species, such as Nauclea diderrichii commonly known as opepe are: good vigour, straight stem with slight branches that leave minimal knot formation following pruning. The excellent properties and versatile nature of opepe timber and its eminent suitability for an array of uses such as medicine and food is well documented. Unfortunately, the plantations of these species in Nigeria are not sustainably managed despite these arrays of uses. More asserted that silvicultural treatments have been limited for the plantations leaving them untended. Knowledge of the distribution of the trees in these plantations would help in prescribing appropriate silvicultural treatments and harvesting regime.
Therefore, the main aim of this study was to evaluate the performance of conditional maximum likelihood, moments, and Knoebel and Burkhart methods for fitting the Johnsons SB distribution to the Nauclea diderrichii stands in Omo Forest Reserve; and to develop models for the SB distribution for efficient and effective monitoring of the stand growth and reduction in cost of data acquisition so as to serve as a basis for improved management and sustainable timber yield of these stands.
Methodology
Study area
This study was carried out in Omo Forest Reserve located between Latitudes 6° 35´ and 7° 05´ N and Longitudes 4° 19´G and 4° 10´ E of Ijebu-East, and North Local Government Areas of Ogun State, Nigeria [13]. It covers an area of about 130,500ha forming common boundaries with Osun, Ago-Owu, Shasha Forest Reserves in Osun State, Oluwa Forest Reserve in Ondo State, and Oni River to east of the Reserve. Annual temperature ranges from 23 °C in July to 32 °C in February and mean annual rainfall ranges from about 1,600 to 2,000mm. The reserve lies within the lowland rainforest with predominant soils of ferruginous tropical.
Data collection
This study was carried out in temporary sample plots of N. diderrichii stands. Thirty-six temporary sample plots of size 25m by 25m (0.0625ha) were laid using simple random sampling technique. The trees in each of the randomly selected plots within the stands were measured and recorded and these includes: diameter at breast (Dbh) (cm) which is the diameter of a tree taken at 1.3m above the ground, diameter at the base (is measured 30cm from the ground with meter tape., middle and top of all the trees (cm), total height (m), merchantable height (m), crown diameter (m) and crown length (m).
Johnsons SB distribution: The four-parameter SB probability density function [14], is expressed as:
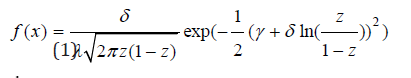
 = the Laplace Integral,
  = continuous location parameter, λ= continuous scale parameter (λ>0), γ= continuous shape parameter,
δ= continuous shape parameter (δ>0),
= continuous location parameter, λ= continuous scale parameter (λ>0), γ= continuous shape parameter,
δ= continuous shape parameter (δ>0),  = tree diameter class.
Fitting methods
Knoebel and burkhart method (KB): This method was developed by Knoebel & Burkhart [15], and recently used by Gorgoso Varela & Rojo Alboreca [6,7]:
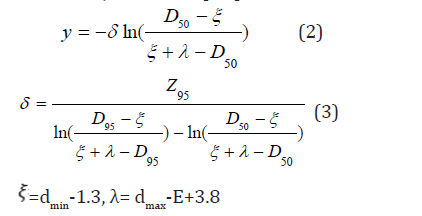
Where: D50 and D95 are estimates of the 50th and 95th data percentiles of the observed diameter distribution; dmin (cm) and dmax (cm) are the minimum and maximum diameters of the plot to be observed, respectively.
Methods of Moment (MOM): This method was recently used by Gorgoso & Rojo-Alboreca [7]. It is based on the relationship between the parameters of Johnson’s SB distribution and the first and second moments of the marginal distribution of diameter (i.e. the mean and variance, respectively)
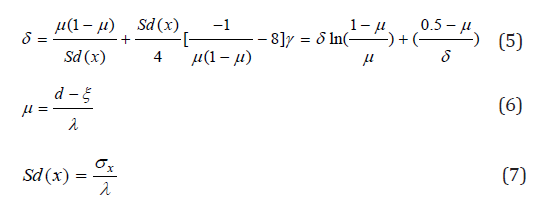
Where x is the arithmetic mean of plot diameters Sd (x) is the
modified standard deviation, and σx is the plot diameter standard
deviations. The values of the location parameter () and the scale
parameter (λ) was computed using the KB techniques.
Conditional maximum likelihood method (CML): Gorgoso-
Varela & Rojo-Alboreca [7], recently used the CML estimation
method for the shape parameters λ and E of Johnson SB pdf with
predetermined values of location and scale parameters. The values
of parameters will be obtained with these equations.
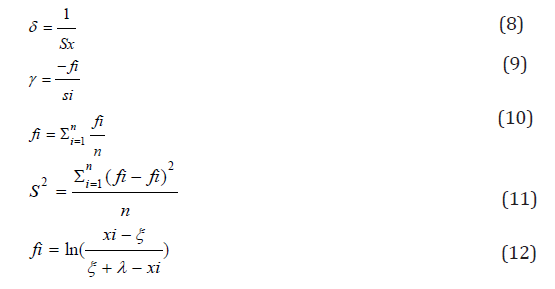
Where xi (i=1,2...n) are the tree diameters, parameter and λ
will be predetermined.
Criteria for comparing method of estimation: The following goodness of fit measures was used in this study:
a. Kolmogorov smirnov (K-S) test: The goodness of fit (GOF) was evaluated using the Kolmogorov-Smirnov (K-S) test 5% significance level. This test was used to compare the estimated cumulative frequency and the observed frequency. The most striking difference between the two distributions was the Dn value of K-S test. Also, the bias, mean absolute error (MAE) and mean square error (MSE) were computed for each fit in mean relative frequency of trees per one for all diameter classes per plot:

Where: Supx = The supremum value
F(xi) = The cumulative frequency distribution observed for the sample xi (i = 1, 2…n)
F0(xi) = The probability of the theoretical cumulative frequency distribution.
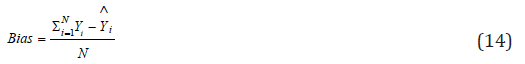
b. Bias
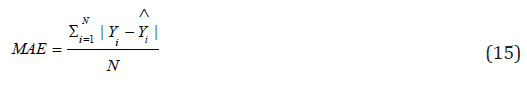
c. Mean absolute error (MAE)
d. Mean square error (MSE)
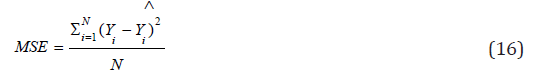
Where: Yi=The observed value, Yi
 = the theoretical value
predicted by the model and, N = the number of data points.
= the theoretical value
predicted by the model and, N = the number of data points.
Modeling the diameter distribution: The parameters of the
SB distribution fitted with the method of moments (MOM) were
recovered using the parameter recovery method. In this method,
the parameters of the distribution were derived from the diameter
moments that is, the mean and variance of the diameter distribution
which were predicted from the stand-level characteristics.
Since the mean diameter and variance can be more gotten precisely
than the distribution parameters themselves. This approach
was used by Parresol [12], Ogana et al. [5]. The variance of the
distribution was calculated using: 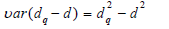
Both linear and nonlinear regression procedures were applied to model the location, shapes and scale of parameters of the SB distribution with quadratic and variance. Coefficient of determination (R2adj) and root mean square error (RMSE) were used to access the adequacy of the models.
Results and Discussion
Descriptive statistics of tree growth variables
The dataset obtained from the field inventory were carefully organized and analyzed so as to show and represent underlying growth patterns. A total of 964 trees were measured and summary statistics of the dataset used in this study are presented in Table 1A above. The average diameter at breast height (Dbh) and average total height (THT) gotten from the observed study area were found to be 33.8cm and 22.7m respectively.

Stand growth characteristics (Table 1B)

Parameter estimation for diameter distribution functions
Table 2 shows the summary statistics of the estimated parameters with the three fitting methods (CML, MOM and KB). The parameter estimates for the three fitting methods used in this study ranges from 6.97 28.94 for the location ( ) and 24.20- 52.23 for scale (λ), -0.47–1.56 for shape (δ) and -0.61-1.06 for the shape (γ). The mean values of the two shape parameters that is, delta (δ) and gamma (γ) estimated with MOM and CML were more or less similar. This is an indication of the similarity of these two methods.

Functions fitting and assessment
The Dbh data from each measurement period were grouped into diameter class intervals of 10cm. A total number of five to seven Dbh classes were formed (Figure 1-3). The estimated parameters with the CML, MOM and KB were used in fitting the distribution functions to the dataset. This was used to calculate the class probability from which stem count was estimated for each diameter class. The predicted stem counts produced by the three fitting methods show little variation with the observed stem counts for each class.


The goodness of fit test
The K-S value, bias, MSE and MAE were used to assess the performance of the three estimation methods. The results of the goodness of fit are presented in Table 3. The goodness of fit result showed that method of moments had the least values of K-S, MAE, MSE and Bias ranked best in the three ages as shown in the table above.

Parameter recovery
In this study, models were developed for parameter recovery. Least square methods were used in fitting regression models for estimating the parameter of Johnson SB function for the study area. The models are presented in Table 4, with their corresponding values of R2 and RMSE. The models were validated using percentage bias from five independent sample plots. The low %bias (0.001- 2.12) in the table above showed that there are no significant differences between the parameters of the SB distribution gotten from the model and the real distributions of the N. diderrichii stand in Omo Forest Reserve, this

Discussion
In this study, information on tree growth variables were collected and processed. The pooled summary of the tree growth characteristics for the three different stand ages of N. diderrichii grown in Omo Forest Reserves showed comparatively small variations. This could be attributed to closeness in the stand ages used. The mean Dbh encountered (33.75cm) is an indication that most of the trees encountered in the study area are less than minimum merchantable size of 48cm fixed by logging policy of south western Nigeria. The mean stem volume and basal area values per hectare obtained in this study also indicated that the area was not adequately stocked. The mean basal area per hectare was less than 24m2/ha (Table 1b) opposed to what was prescribed by Alder & Abayomi [16], for a well-stocked forest or planted stand. This may have resulted from illegal felling or improper forest management technique. During the study, several stumps were noticed and the existing spacing within and between each stand was so irregular, this is due to precedent extractive uses and natural disasters.
Diameter distribution of Nauclea diderrichii stands into classes using three different estimation methods of Johnson SB distribution was the focus of this study. In this study, maximum likelihood method, method of moment and percentile method were used in estimating the parameters of Johnson SB distributions. The data used for the study did not completely reflect the true nature of a forest plantation as shown in Figure 2 & 3; that is, the Gauss distribution, as illegal felling and other factors leading to tree removal of the trees has distorted the shape (asymmetry) of the stand. This is also obvious in the smaller tree sizes found in the plantation. Nonetheless, the effectiveness of the MOM, CML and KB was compared in a bid to finding the best fitting method for the SB distribution that would sufficiently show the distribution of the diameter into size classes in stands. Evaluation was based on K-S, MSE, MAE, and bias. The low mean values of these criteria as shown in Table 3 for the three fitting methods (MOM, CML, and KB) show that the three methods are appropriate for the stand. However, the superior nature of MOM over CML and KB was noticeable in all the three ages studied based on the evaluation criteria as shown in Table 3, although, the bias, MSE, and MAE were not significantly different from the other method however was the lowest. This result agreed with Gorgoso-Varela & Rojo- Alboreca [7], who compared CML, MOM, mode, and KB methods. Their results showed that MOM and CML provided the best result for the SB distribution. Similar result was observed by Ogana et al. [5], who reported that the MOM was best in estimating the parameters of Johnson SB of Gmelina arborea in Omo forest reserve. Furthermore, the parameter recovery result (Table 4) showed that the scale parameter can be adequately estimated using inverse of basal area and variance as its predictor, the first shape parameter can be adequately estimated using variance and basal area as predictors, the second shape parameter can be adequately estimated using mean height and basal area predictor while the location parameter can be estimated by using basal area as predictor variable.
Furthermore, these models were applied to independent plot data (i.e., plot not used in model calibration), a reasonable result was achieved. The percentage bias was small, this shows the efficiency of these models in recovering the parameters of the SB function for describing the diameter distribution of the Nauclea diderrichii stand. A similar result was reported by Ogana et al. [5], who also recovered the parameters of SB distribution for predicting Gmelina arborea plantation. However, He used the square quadratic mean, variance, and dominant height to model the location parameter [17,18].
Conclusion
This study examined the existing diameter distribution of Nauclea diderrichii stands in Omo Forest Reserve; and it was observed that the distribution follows the Johnson’s SB function. Among the three fitting methods tested, the method of moments was seen to be the best estimation method for the SB distribution for the stand. More so, the parameter recovery model for the SB distribution performed very well when compared with observed distribution of the stands. Hence, these models can be used for recovering the parameters of the distribution in the stand. Furthermore, the use of these models will ensure that only trees of merchantable size are harvested while smaller trees are allowing to grow thereby ensuring the sustainability of the Nauclea diderrichii plantation in Omo Forest Reserve.
References
- Akindele SO (2005) Volume Functions for Common Timber Species of Nigerias Tropical Rain Forests. International Tropical Timber Organization (ITTO) Technical Document. Japan.
- Oyebade BA, Onyambo E (2011) Height - Diameter Predictive Equations for Rubber (Hevea brasilliensis-A. Juss- Muell) Plantation in Choba, Port-Harcourt, Nigeria. Journal of Agriculture and Social Research (JASR) 11(1): 1-11.
- Turan S (2009) Diameter at Breast Height Crown Diameter Prediction Models for Picea orientalis. African Journal of Agricultural Research 4(3): 215- 219.
- DeLiocourt F (1898) De lamenagement des Sapiniers. Bul Social Forest Franche-Comptéet Belfort, pp. 396-409.
- Ogana FN, Ekaette SI, Osho SA (2017) Modeling diameter distributions of Gmelina arborea plantation in Omo Forest Reserve, Nigeria with Johnsons SB. Journal of Sustainable Forestry 36(2): 121-133.
- Gorgoso JJ, Rojo A, Camara-Obregon A, Dieguez-Aranda U (2012) A comparison of estimation methods for fitting Weibull, Johnsons SB and beta functions to Pinus pinaster, Pinus radiate and Pinus sylvestris stands in northwest Spain. Forest Systems 21(3): 446-459.
- Gorgoso-Varela JJ, Rojo-Alboreca A (2014) Short communication: A comparison of estimation methods for fitting Weibull and Johnsons SB functions to pedunculate oak (Quercusrobur) and birch (Betulapubescens) stands in northwest Spain. Forest Systems 23(3): 500-505.
- Eslami A, Sabokroo H, Ranjbar-Bahadori SH (2011) Infection of Anisakids Larvae in Long Tail Tuna (Thunnus tonggol) In North Persian Gulf. Iran J Parasitol 6(3): 96-100.
- Palahi M, Pukkala T, Blasco E, Trasobares A (2007) Comparison of beta, Johnsons SB, Weibull and truncated Weibull functions for modeling the diameter distribution of forest stands in Catalonia (north-east of Spain). European Journal of Forest Research 126(4): 563-571.
- Burkhart HE, Tomé M (2012) Modelling forest trees and stands (2nd edn), Dordrecht, The Netherlands: Springer.
- Zhous B, McTague JP (1996) Comparison and evaluation of five methods of estimation of the Johnson system parameters. Canadian Journal of Forest Research. Canadian Journal of Forest Research 26(6): 928-935.
- Parresol BR (2003) Recovering parameters of Johnsons SB distribution. p. 9.
- Chima UD, Ola-Adams BA, Adedire MO, Oyelowo OJ (2009) Impact of land use changes on soil quality of a biosphere reserve in south-western Nigeria. Journal of Research in Forestry, Wildlife and Environment 1(1): 111-122.
- Johnson (1949) Pre‐history of the Earth’s magnetic field. AGU 30(2): 169-170.
- Knoebel BR, Burkhart HE (1991) A bivariate distribution approach to modelling forest diameter distributions at two points of time. Biometrics 47(1): 241-253.
- Alder D, Abayomi JO (1994) Assessment of data requirement for sustained yield calculations. FORMECU, Federal Department of Forestry, Consultancy report, Ibadan, Nigeria, p. 35.
- Husch B, Beers TW, Kershaw JA (2003) Forest Mensuration. (4th edn), John Wiley and Sons Inc., New Jersey, USA, p. 456.
- Wang M, Ramesh NI, Keith Rennolls (2007) The Richit-Richards family of distributions and its use in forestry. Canadian Journal of Forestry Research 37(10): 2052-2062.


