


Genetic Variation, Heritability, and Advances from Selection in Elite Breeding Materials of Field Pea (Pisum sativum L.) Genotypes
Tamene T Tolessa*
Ethiopian Institute of Agril Research, Kulumsa Agricultural Research Center, Ethiopia
Submission: June 23, 2017; Published: July 21, 2017
*Corresponding author: Tamene T Tolessa, Ethiopian Institute of Agricultural Research, Kulumsa Agricultural Research Center, P.O.Box, 489, Asella, Ethiopia, Email: tt.tolassa@gmail.com
How to cite this article: Tamene T T. Genetic Variation, Heritability, and Advances from Selection in Elite Breeding Materials of Field Pea (Pisum sativum L.) Genotypes. Agri Res & Tech: Open Access J. 2017; 8(4): 555744. DOI: 10.19080/ARTOAJ.2017.08.555744
Abstract
Twenty-five field pea genotypes were evaluated in four environments in Ethiopia during 2014 main cropping season. The objectives of the study were to evaluate the genetic variation and heritability of important morpho-agronomic traits, and examine their association with grain yield for efficient design of field pea breeding schemes. The study was conducted using a randomized complete block design with two replications. Mean sum of squares due to genotypes and environments were significantly varied for most of the traits studied. The phenotypic and genotypic coefficient of variability were ranged from 1.0 to 15.7% and 0.8 to 13.3%, and that of heritability and genetic advance in percent of mean were ranged from 28.2 to 92.7% and 1.4 to 26.3%, respectively. Grain yield showed positive and significant genotypic association with number of seeds pod-1 but negative and significant genotypic association with 1000-seed weight. The first four principal components accounted for 88.7% of the entire genotypic variation. Days to maturity, number of seeds pod-1, 1000-seed weight, ascochyta blight and grain yield with their relatively greater weight in the first two principal components were believed to be responsible for differentiation of the current field pea genotypes into different clusters. Generally, the present study showed an adequate level of genetic variability among the field pea genotypes for most of the traits under study. Genotypes to be used for future parental lines to generate desirable genetic recombination were identified and this implies that there is a great opportunity for genetic improvement through either direct selection or intra-specific hybridization between parental lines with desirable traits.
Keywords: Genetic advance; Heritability; Pisum sativum; Traits; Variability
Abbreviations: GCV: Genotypic Coefficient of Variation; PCV: Phenotypic Coefficient of Variation; GAM: Genetic Advance in Percent of Mean; DAP: Diamonium Phosphate; PC: Principal Component
Introduction
Field pea (Pisum sativum L.) is known to grow in Ethiopia since ancient times [1]. It is the third most important pulse crop in the country, preceded only by faba bean and haricot bean in terms of both area coverage and total annual production [2]. Ethiopia is considered as one of the centers of diversity [3] for field pea. Though wild and primitive forms are also known to exist in the high elevations of the country [4], the species P. sativum is known to dominate the production system [5]. Despite the fact that the progenitors of P. sativum so far are unknown, Ethiopia, Western and Central Asia and the Mediterranean region are proposed as possible centers of origin because of the high pea genetic diversity sampled in these regions [6,7].
Field pea plays a significant role in the socio-economic lives of the farming communities of Ethiopia. It serves as a source of food and feed with a valuable and cheap source of protein [8], and as a good source of cash to farmers and foreign currency to the country [7,9]. As suitable rotation crop that fixes atmospheric nitrogen, it also contributes a substantial role in soil fertility restoration [10]. Despite its huge importance in the economy and livelihood of the farming community, like all other cool season food legumes, the productivity of field pea in Ethiopia is very low (1.6 t ha-1) [2] compared to many other countries of the world [11]. This was far below the potential of the crop, which among many other factors can be attributed to the inherent low yielding potential of the indigenous cultivars [12]. Moreover, foliar diseases such as ascochyta blight (Mycosphaerella pinodes) and powdery mildew (Erysiphe polygoni) [13], and poor soil fertility, unimproved cultural practices such as poor seedbed preparation, and inapt fertilizer use.
Genetic variability has been considered as an important factor, which is also an essential prerequisite for crop improvementprogram for obtaining high yielding progenies [14]. Evaluation of genetic variability is important to know the source of genes for a particular trait within the available germplasm [15]. In evaluating accessions from various geographical regions of Ethiopia, the existence of high genetic diversity among Ethiopian field pea landraces was reported [16]. An adequate level of genetic diversity among field pea botanical species of (Pisum sativum var. Abyssinicum) germplasms for biological nitrogen fixation has been reported in [17], with different component characters contributing differently towards the total diversity. Similar to many other crops, P sativum populations has been studied using biochemical and DNA markers [18,19].
Molecular markers have also been utilized to assess the genetic variability among Ethiopian field pea accessions against pea weevil infestation [20,21]. In morphological diversity studies, traits like days to emergence, days to 50% flowering, plant height, number of pods plant-1, green pod length, grain filling period, number of podding nodes plant-1, number of pods podding nodes-1, number of seeds pod-1, 1000-seed weight, and grain yield ha-1 have been studied [16,22-24].
Highest genetic variation for field pea traits such as biological and grain yields, number of seeds per pod-1 and harvest index, number of primary branches, and seed size; intermediate genetic variation for number of pods plant-1 and plant height, while the lowest genetic variation for phenological traits were reported in [25,26]. However, crop genetic diversity is being lost because of natural calamities such as recurrent drought and increasing population pressure. On the other hand, there is an increasing demand of producers for improved field pea varieties that are adapted to wide agroecology and this must be met by plant breeding efforts. For the optimum choice of the breeding scheme as well as for multi-trait selection gain, knowledge on the genetic variation, heritability, and correlations among traits is crucial [27,28]. Herewith, therefore, 25 field pea advanced breeding materials developed through hybridization including two standard checks were evaluated to study the genetic variability and heritability of important morpho-agronomic traits and examine their correlation with grain yield for efficient design of field pea breeding schemes.
Materials and Methods
Experimental sites and materials
Field experiments were carried out during the main cropping season (June to November) of the year 2014 at Kulumsa, Bekoji, Asassa, and Koffale, which are situated in south-eastern highlands of Ethiopia. Weather related descriptions of the four study locations are shown in Table 1. Twenty-five field pea advanced breeding materials developed through hybridization including two released varieties as standard checks were considered for the study (Table 2).

THMH: Tepid Humid Mid Highland; Tsmmh: Tepid Sub-Moist Mid Highland; CHMH: Cool Humid Mid Highland Table 2: List of field pea genotypes used in the study.

The advanced lines were generated from three released adaptive cultivars for their high yielding potential, and four introduced materials for their seed size, seed color and disease resistance potential. The twenty-five genotypes were arranged in a randomized complete block design with two replications. The plot size was 3.2m2 with four rows of 4m long and spacing of 20cm between rows. Fertilizer at the rate of 18kg N and 46kg P2O5 ha-1 in the form of diammonium phosphate (DAP) and 150kg ha-1 seed rate was used at each test sites. Other crop management and protection practices were applied following the recommendation at each location. For statistical analysis, yield from net plot area of 3.2m2 was harvested and converted into kg ha-1 base at 10% standard grain moisture content was used.
Data collection
Data on days to 50% flowering, days to 95% physiological maturity, 1000 seed weight (g), grain yield (kg ha-1), ascochyta blight (1-9), and powdery mildew (1-9) were assessed on plot bases, while plant height (cm), number of pods plant-1, and number of seeds pod-1 were recorded on five random samples of plants selected from the central rows of each plot. Mean values of the five random samples of plants plot-1 were then used for the analysis of data collected on an individual plant basis.
Data analysis
Data for all traits were subjected to analysis of variance using General Linear Model (PROC GLM) of the SAS Procedure using version 9.0 of the software [29]. The significance of variance effects was considered at P≤0.05, P≤0.01, and P≤0.001, respectively. Error mean squares from each environment were tested for homogeneity of variance to ensure that the combined analysis of variance across environments was appropriate. Separation of the additive main effect was done using Duncan's Multiple Range Test (DMRT). Based on the variance components obtained from the combined analysis across the four test environments, the total phenotypic variance of each trait was partitioned into genetic and non-genetic factors.
The phenotypic (PCV) and genotypic (GCV) coefficient of variation were obtained as the ratio of the respective root square of phenotypic and genotypic standard deviations to the trait means. Broad sense heritability (Hb2) was estimated for each trait from the variance component analysis as suggested in [30] as:

Where VG and VP are the genotypic and phenotypic variances, respectively. Values near Zero indicate strong environmental variation, whereas values near unity indicate that variation has a strong genetic influence [31].
The predicted response to selection or the expected genetic advance (GA) was calculated, following [32] assuming the selection intensity of 5% as:
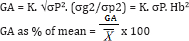
Where, GA = expected genetic advance from selection and K = the selection differential (K = 2.06 at 5% selection intensity), σg2 and σp2 are genotypic and phenotypic variances, σP = phenotypic standard deviation, Hb2 = broad-sense heritability, and is the grand mean.
Phenotypic and genotypic correlation coefficients of grain yield with other traits were estimated from the components of variance and covariance based on the standard procedure suggested by [33] using the PROC CANDISC of SAS system [29] as follows:
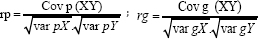
Where rp is phenotypic correlation coefficient between characters x and y; rg is genotypic correlation coefficient between characters x and y; Cov p (XY) is phenotypic covariance between characters x and y; var pX is variance of character x; var pY is variance of character y; Cov g(XY) is genotypic covariance between characters x and y; var gX is genotypic variance of character x; and var gY is genotypic variance of character y.
The following formula [34] was adopted to test the significance of correlation coefficients.
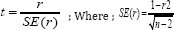
Where, r and n are correlation coefficient and number of genotypes, respectively. Then calculated t-value was compared with the standard t-table value at n-2 degrees of freedom and a levels of probability (where a is 0.05 and/or 0.01).
Principal component (PC) analysis was made based on the mean values for the nine traits of 25 field pea genotypes across the four test locations using the PROC PRINCOMP of the SAS version 9.0 [29] in order to identify the traits that most contributed to the total variation among the genotypes.
Clustering of the genotypes was performed by the PROC CLUSTER of the SAS version 9.0 [29] following the options of Euclidean distance measure using nine traits that were found to be significantly different among the genotypes across locations. The determination of the number of clusters was made based on the Pseudo-F and Pseudo-T2 statistics. Genetic distances between clusters as standardized Mahalanobis's D2 statistics were calculated as:
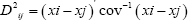
Where D2ij is the distance between cases i and j; xi and xj is the vectors of the values of the variables for cases i and j; and cov-1 is the pooled within groups variance-covariance matrix. The D2 values obtained for pairs of clusters were considered as calculated values of Chi-square (χ2) and were tested for The significance levels against the tabulated values of χ2 for 'P' degree of freedom, where P is the number of traits considered [32].
Results
Performance of the genotypes
Significant variations among genotypes observed for all traits except for number of pods plant-1 and powdery mildew (Table 3). Highly significant (P≤0.01) to significant(P≤0.05)main effect differences for genotypes observed for the traits under study except for number of pods plant-1 and powdery mildew (Table 3). Likewise, test locations exerted significant (P≤0.05) effects on all traits except ascochyta blight. The interaction effects of locations and genotypes were significant (P≤0.05) for all traits except plant height, number of seeds pod-1, 1000 seed weight, and ascochyta blight (Table 3).

*, **, and *** were significant at P<0.05, P<0.01, and P<0.001, respectively.

FLD: Days to 50% Flowering; MTD: Days to 90% Maturity; PLH: Plant Height (Cm); PPPL: Number of Pods Plant-1; SPP: Number of Seeds Pod-1 TSW: 1000 Seed Weight (G); GY: Grain Yield (Kg Ha-1); AB: Ascochyta Blight (1-9); PM: Powdery Mildew (1-9)
Mean values of all traits of the genotypes varied across the four test locations (Table 4). The result of the range of parameters in Table 5 suggested that there were considerable differences observed in all of the traits under investigation. The genotypes required 60 to 88 days for vegetative growth and 123 to 163 days to mature physiologically. Yield component traits including number of pods plant-1, number of seeds pod-1, and 1000 seed weight, were significantly varied ranging from 7 to 29 pods plant-1, 2.8 to 6 seeds pod-1, and 120 to 320g 1000 seeds-1; the overall mean being 12.5, 4.6, and 206g for number of pods plant-1, number of seeds pod-1 and 1000 seed weight, respectively (Table 4). Plant height was ranged from 140 to 280cm, with the mean across four locations of 182.1cm plant-1

*Means in the same row and followed by different letters are significantly different as adjusted by Duncan's multiple range test at P<0.05.


Grain yield performances of most of the genotypes were varied across all locations except for EK08023-1, which was ranked in the top third in 100% of the test locations. Genotypes EK08017-3, EK08024-3, EK08021-5, and the standard check Burkitu were ranked in the top third in 75% of the test locations (Figure 1). Genotypes EK08017-3 and EK08024-3 were the only genotypes surpassing the two standard checks in their performance of grain yield and other yield and disease-related traits across locations (Table 4). Genotype EK08024-3 yielded the best of 6499kg ha-1 at the highest-yielding location Bekoji, whereas EK08017-4 yielded the best of 3730kg ha-1 at the lowest- yielding location Kulumsa (Figure 2). The mean location grain yield across genotypes ranged from 2459kg ha-1 in Kulumsa to 4957kg ha-1 in Bekoji (Table 5). The mean grain yield of field pea genotypes across locations varied from 2649kg ha-1 for genotype EK08005-2-1 to 5140kg ha-1 for EK08017-3, with an overall location mean of 4155kg ha-1 (Table 4).
Estimates of coefficient of variation, heritability, and genetic advance
Estimates of phenotypic (PCV) and genotypic (GCV) coefficients of variation, broad sense heritability [Hb2) and genetic advance expected from a selection of the best 5% of the genotypes as expressed in percent of the mean (GAM) are presented in Table 5. The PCV was lowest [1.0%) for days to maturity and highest [15.7%) for grain yield. In addition to the latter, relatively high PCV values were noted for seed weight [13.8%), powdery mildew [13.8%) and number of pods plant-1 [11.3%). Estimates of GCV ranged from less than 1.0% for days to maturity to 13.3% and 11.3% for 1000-seed weight and grain yield, respectively. Powdery mildew, ascochyta blight, and number of pods plant-1 showed relatively moderate GCV values.
Hb2 values varied from moderate to high depending on the traits under study. It was ranged from 28.2% for powdery mildew disease to 92.7% for seed weight followed by 91.9% for days to flowering. In addition to the former, low Hb2 estimate of 34.5% was noted for number of pods plant-1, whereas relatively intermediate Hb2 estimates of 42.2 to 52.3% were noted for plant height, number of seeds pod-1, and grain yield. The genetic gain expected from selection of the superior 5% of the genotypes was varied from a low of 1.4% to a high of 26.3% (Table 5). The lowest and highest GAM estimates were obtained for days to maturity and seed weight, respectively. The relatively higher value of GAM in seed size indicates its responsiveness for improvement through direct selection.
Association of morpho-agronomic traits with grain yield
The phenotypic and genotypic correlation among all morpho-agronomic traits and grain yield were indicated in Figure 3. Grain yield showed highly significant (P≤0.01) positive genotypic correlation (r= 0.51) with number of seeds pod-1, and negative and significant (P≤0.01) genotypic correlation with 1000-seed weight [r= -0.53) and powdery -0.44), while it has no significant genotypic association with the remaining traits (Figure 3). The significant positive genotypic correlation between grain yield and number of seeds pod-1, and negative genotypic correlations with powdery mildew disease indicates the possibility of improving grain yield by improving any one or both of the two traits. Grain yield showed positive and highly significant phenotypic correlation with 1000-seed weight, days to flowering and days to maturity, while it showed negative and significant phenotypic association with number of seeds pod-1. On the other hand, plant height, number of pods plant-1, ascochyta blight, and powdery mildew showed non-significant phenotypic association with grain yield (Figure 3)

Principal component analysis

The first four PCs were accounted for 88.7% of the total phenotypic variation, of which 63.6% was contributed by the first two PCs [Figure 4). PC1 accounted for 34.9% of the total variation among the test genotypes. This is mainly due to the positive effect of days to maturity, and the negative effect of ascochyta blight incidence (Figure 5). The second PC, on the other hand, also accounted for 28.7% of the total variation among the test genotypes, whereby the positive effect of number of seeds pod-1 and grain yield kg ha-1, and the negative effect exerted by 1000- seed weight contributing the most. The proportion of the total phenotypic variance of the field pea genotypes accounted for by PC3 and PC4 were 13.5% and 11.6%, and these were due mainly to variation in days to flowering and plant height, respectively (Figure 4 & 5).

Cluster analysis
Cluster analysis grouped the 25 field pea genotypes into five distinct classes (Figure 6). Cluster C was the largest constituting 28% of the total genotypes. This cluster constituted high yielding genotypes with relatively shorter plant height, an intermediate number of pods plant-1, large number of seed size but relatively susceptible to powdery mildew disease. Clusters C2 and C3, and C4 constituted 24% and 20% of the total genotypes, respectively and established from intermediate genotypes for yielding potential and seed size. Clusters C2 and C3 were characterized by genotypes with intermediate number of pods plant-1 and number of seeds pod-1. Genotypes with a low number of pods plant-1 and high number of seeds pod-1 were grouped in C4. Whereas, the fifth cluster had only one genotype which is characterized by tall plant height, a higher number of pods ,largerseed size and but alower no ofseed's pod-1and inforier yieldding potential(Table 6).


The pairwise generalized squared distance among the five clusters is presented in Table 7. The genetic divergence between all possible pairs of clusters were highly significant (P<0.01), while it was non-significant between C2 and C3 indicating close relationship among the genotypes in these clusters. The maximum distance was found between C and C5 (D2 = 473). The second most divergent clusters whereas the minimum distance (D2 = 11.8) was between C2 andC3.
Discussion
The mean sum of squares due to field pea genotypes showed significant variation for all traits except for number of pods plant-1 and powdery mildew suggested that the experimental materials were genetically divergent (Table 3) and could provide more opportunities for effective selection in the future breeding program. This indicated that there is ample scope for selection of promising lines from the present gene pool for yield and its components. Similarly, high genetic diversity in Ethiopian field pea landraces was reported in [16] and significant variations among field pea breeding lines for most of the traits were reported in [14,25,26,35,36]. The significant effects due to a location in most of the traits (Table 3) showed that test locations were diverse to show substantial variations in the performances of field pea genotypes. The highly significant (P≤ 0.01) genotype by location interaction effect observed for grain yield coincides with [37,38]. This shows the sensitivity of yield of field pea genotypes to different environmental conditions.
The range of parameters in Table 4 suggested that there were substantial differences observed in all of the traits under consideration. For instance, the number of days required for grain filling took more than 11 weeks at Koffale and Bekoji as compared to less than nine weeks at Kulumsa and Asassa [data not shown). Contrast to this, significantly shorter days for vegetative growth and shorter grain-filling period was reported in a study conducted in Eastern Ethiopia [26]. This is mainly attributed to differences in the genotypes, and the test locations in their climatic and agro-ecological parameters including rainfall, temperature, and edaphic conditions (Table 1). Particularly, the high grain yield observed at Bekoji resulted from the anticipated long grain-filling period as the more the crop stayed green, the better photosynthetic [source-sink) advantage in terms of grain filling. The significant difference in mean values and ranges of traits in the current study (Table 4) shows the increased phenotypic plasticity exhibited in morphology, phenology and agronomic performance of field pea genotypes. This could happen because of the frost damage in Koffale, high incidence of powdery mildew diseases in Kulumsa, and the favorable environmental condition in Bekoji and Asassa during the growing season. Based on the mean performance of grain yield and other yield and disease-related traits across locations, genotypes EK08017-3 and EK08024-3 were surpassed the two standard checks, Burkitu and Bilallo. The result of [39] stratified ranking (Figure 1) also revealed that these two genotypes were yielded in the top third in 75% of the test locations and found promising for release.
Effective cultivar development is mainly based on the existence of sufficient genetic variability in germplasms [40]. Therefore, in order to improve yield and any other desirable agronomic traits, knowledge of the extent of genetic variability that is measured by GCV and PCV [41] is crucial for any breeding program. The PCV and GCV values of traits observed in the current study are within the range of the previous report by [42], but lower as compared to the values reported in [14,26,36]. Significantly higher PCV than GCV values observed for number of pods plant-1, grain yield, and powdery mildew disease incidence suggests the significant contribution of environment and genotype by environment effect to the expression of these traits. This was in agreement with results reported in [14,26,36]. Because the magnitude of genetic variation is better assessed from GCV than PCV, breeders commonly focus on traits with high GCV estimates [43].
A relatively higher GCV was obtained in 1000-seed weight and grain yield indicating the existence of wide genetic variation for these traits among the genotypes, and there could be much potential for improving these traits through hybridization and/ or direct selection. Insignificant differences between PCV and GCV values were observed for days to flowering, days to maturity, plant height, 1000 seed weight, and ascochyta blight incidence indicating that the observed variations were owing to genetic factors; hence, the environmental effect played a little role in the expression of these traits. Similarly, small differences between PCV and GCV values in most of the traits studied were reported in pole-type French bean in [44].
As a guiding factor to breeders for developing a successful breeding program, understanding heritability of economically important traits [41] and the genetic advance as percent mean [45] are very crucial. In the current study, values for Hb2 and GAM were ranged from 28.2 to 92.7%, and 1.4 to 26.3%, respectively (Table 5). These values are higher compared to the values reported in [45], where only as high as 50.8% Hb2 values has been reported for similar traits. This is because both variation in additive and non-additive genetic factors and the environmental variance are population specific [46], heritability in one population does not necessarily predict the heritability of the same traits in another population. On the other hand, this large difference in Hb2 values of similar traits of field pea genotypes could be explained by the difference in data used from four locations in the current study compared to only one location used in [26]. Differences in Hb2 of traits in this study may have resulted either due to some traits may be inherently less variable than the others, or there are differences in the magnitude of environmental influence on phenotypic performances of the genotypes. High Hb2 [92.7%) coupled with high GAM [26.3%) was found for the trait 1000-seed weight (Table 5) indicating that the phenotype of an individual in the current population is a good indicator of the genotypes or it mean that most of the variation in seed weight that is observed in the present population is caused by variation in genotypes. This suggests the predominance of additive gene action in the expression of seed weight [45,46], making it to easily transferred from parent to offspring. High Hb2 and GAM of sees size, on the other hand, is an indication that selection in the early generation can easily fix seed size in field pea.
High estimates of Hb2 and moderate estimates of GAM or vice versa were observed for days to flowering [91.9%, 8.4%), grain yield [52.3%, 16.9%), and ascochyta blight resistance [60.7%, 11.2%). In such cases, the coexistence of additive and nonadditive gene action would be responsible for the expression of these traits [45,47]. Therefore, mass selection and/or other breeding methods based progeny testing could result in a high possibility of improvement in these traits. However, days to flowering and days to maturity possessed high Hb2 with low GAM, and this coincides with the value reported in [36] for the same trait, suggesting the predominance of non-additive gene action that could be exploited through heterosis breeding. On the other hand, the high Hb2 of these earliness characters could be as a result of the favorable environmental condition rather than genotypic effect, hence direct selection for such trait may not be rewarding. Therefore, in order to obtain increased genetic gain in days to flowering and days to maturity of field pea, there must be sufficient genetic variability existed either through reintroduction from landraces and elite germplasms from other breeding programs, or introgression of novel alleles from wild relatives. The low Hb2 values as coupled with low GAM for powdery mildew, number of pods plant-1, number of seeds pod-1 and plant height indicated that only a small proportion is caused by variation in genotypes but it does not necessary mean that the additive genetic variance is small [46]. In this case, one could expect slow progress of improvement in these traits through direct selection due to a quantitative mode of inheritance. Similarly, low Hb2 and GAM values for powdery mildew, number of pods plant-1, and number of seeds pod-1 were reported in [26], but contrast to this result, high Hb2 values for plant height and number of pods plant-1 was reported in [48].
Grain yield is associated with several yield contributing characters that make it a complex trait. Therefore, improvement in yield can only be effective when other components characters influencing it directly or indirectly are taken into consideration in the selection process. A selection pressure exerted for improvement of any characters highly associated with grain yield, simultaneously affects a number of other correlated traits [14]. Hence, knowledge of association of grain yield with its component traits is believed to provide a guideline to the plant breeders for making improvement through selection. Results from analysis of correlation coefficients reveal that phenotypic correlation coefficients are greater than their corresponding genotypic coefficients. This indicates that selection based on phenotypic performance perse may not improve the genotypic performance because the effect of growing environments on the expression of most of the traits is relatively higher.
The highly significant positive genotypic correlation of grain yield with number of seeds pod-1 and its significant negative genotypic association with 1000-seed weight is consistent with earlier reports of [25,26] indicating that they could be affected by the same gene and the possibility of improving grain yield by selection for increased number of seeds pod-1, but this could result in negative compensatory growth in seed size. Therefore, in order to improve grain yield through simultaneous selection for seed size, number of seeds pod-1 and pods plant-1, a compromise between selections for these traits must be made. The negative and non-significant genotypic correlation of days to flowering and days to maturity with grain yield is an indication of desirable earliness character that could be exploited in future breeding programs for stressed environments, Asassa and Kulumsa, where frequent terminal drought and high disease pressure are expected, respectively.
Results from principal component analysis reveals the first four principal components accounted for 88.7% of the total variation in the field pea genotypes, of which about 63.6% was contributed by the first two principal components (Figure 5). This was larger compared to earlier reports which ranged between 77.0 to 80.0% [15,26] in field pea, and 86.0% value reported in [16] in Abyssinian field pea species. Clustering of genotypes are more influenced by traits with larger absolute eigenvector values closer to unity within the first principal components than those with lower values closer to zero [15,16,49]. Accordingly, most of the traits individually contributed from -0.549 to +0.633 (Figure 4) with days to maturity, number of seeds pod- 1, 1000-seed weight, grain yield and ascochyta blight showed relatively greater weight in the first two principal components of eigenvalues greater than one (Figure 5). Therefore, the contributions of those aforementioned traits were believed to be significant for differentiation of the current field pea genotypes into different clusters.
Cluster analysis grouped the field pea genotypes to five different classes (Figure 6). Studies indicated that genotypes within the same cluster are more closely related in terms of the traits under consideration [15,16]. Hence, crosses that involve parents selected from clusters characterized by maximum genetic distance are believed to provide maximum genetic recombination and variation in the subsequent generation [49]. Therefore, the maximum genetic distances between C1 and C5, and C4 and C5 in the current study (Table 7) reveals crosses between genotypes selected from these clusters are expected to provide relatively better genetic recombination and segregation in their progenies. Selection of parents, however, should consider the special advantage of each cluster and each genotype within a cluster depending on the specific objectives of hybridization as suggested by [15,16].
Conclusion
Better understanding of crop genetic diversity is required to maximize crop yield under changing climate and minimize crop failure under unfavorable condition for sustainable agriculture. The present study showed an adequate level of genetic variability among the field pea genotypes for most of the traits under study with the first four PCs accounted for 88.7% of the total variation in the genotypes and different component characters contributed differently towards the total diversity. This implies that there is a great opportunity for genetic improvement through either direct selection or intra-specific hybridization between parental lines with desirable traits.
The high Hb2 and high GAM showed in 1000-seed weight coupled with its wide range (120 to 320g 1000-1 seeds) of genotypic variation shows the high possibility of improving seed size through direct selection. In order to bring a reasonable improvement on traits including grain yield and genotypic ascochyta blight resistance, which are governed by both additive and non-additive gene action, the future breeding program should focus on mass selection, and other breeding methods based progeny testing.
The positive genotypic association between grain yield and number of seeds pod-1 shows a good opportunity to improve these traits simultaneously but the negative significant genotypic association between 1000-seed weight and grain yield shows the need to implement a compromise between selection progresses for simultaneous improvement of the two traits. Widening the genetic base either through reintroduction from landraces and elite germplasms from other breeding programs, or introgression of novel alleles from wild relatives must be sought in future breeding program to make an improvement in earliness characters, days to flowering and days to maturity, which have high Hb2 with low GAM but negative genotypic association with grain yield.
Generally, as the current study used limited elite field pea genotypes, it should be noted that plant geneticists and breeders needs to continue their efforts to explore genetic diversity in different traits of agronomic importance through an in-depth study of morphological, physiological, agronomic, and molecular basis of genotypic differences using more number of field pea accessions.
Acknowledgement
The author would like to thank breeding and genetics research division staffs of Kulumsa Agricultural Research Center who managed the field experiments. The financial support provided by Ethiopian Institute of Agricultural Research (EIAR) is also duly acknowledged.
References
- Dawit T, Asfaw T, Geletu B (1994) Genetic resources in Ethiopia. In: Asfaw T (Ed.), Cool-season Food Legumes of Ethiopia. Ethiopia, pp. 7996.
- Central Statistical Agency (2014) Agricultural sample survey. Report on area and production, CSA, Addis Ababa, Ethiopia, p. 125.
- Hailu M, Abebe D, Abebe T (1991) Pulse crops of Ethiopia. In: Engels JMM, Hawkes JG, Melaku W (Eds.), Plant genetic resources of Ethiopia. Cambridge University Press, Hyderabad, India, pp. 328-343.
- Hagedorn DJ (1984) Compendium of pea diseases. The American Psychopathological Society, Minnesota, USA.
- Mussa J, Tezera W, Gemechu K (2006) Review of field pea (Pisum sativum L.) Genetics and breeding research in Ethiopia: A review. In: Kemal A, Gemechu K, Seid A, Malhotra R, Beniwal S, et al. (Eds.), Food and Forage Legumes of Ethiopia: Progress and Prospects. Addis Ababa, Ethiopia, pp. 67-79.
- Messiaen CM, Seif AA, Jarso M, Keneni GA (2006) Pisum sativum L. Internet Record from PROTA4U. In: Brink M, Belay G (Eds.), PROTA: Plant Resources of Tropical Africa. Wageningen, Netherlands.
- Muehlbauer FJ, Tullu A (1997) P. sativum L. New crop Factsheet West Lafayette, Indiana, USA.
- Cousin R, Massager A, Vingere A (1985) Breeding for Yield in combining peas. In: Hebblethwait PH, Heath MC, Dawkirs TCK (Eds.), The Pea Crop: A Basis for Improvement. Butterworths, London, UK, pp. 115-129.
- Girma B (2003) The state of grain marketing in Ethiopia. In: Proceedings of the EDRI/IFPRI 2020 Network Policy Forum on Toward Sustainable Food Security in Ethiopia: Integrating the Agri-Food Chain, Addis Ababa, Ethiopia.
- Angaw TS, Asnakew W (1994) Fertilizer Response Trials on Highland Food Legumes. In: Asfaw T, Geletu B, Saxena MC, Solh MB (Eds.), Cool- Season Food Legumes of Ethiopia. Proceeding of the first national cool- season food legumes review conference, Addis Ababa, Ethiopia, pp. 279-292.
- Kelley TG, Rao PP, Grisko-Kelley H (2000) The Pulse Economy in the Mid-1990s: A Review of Global and Regional Development. In: Knight R (Ed.), Linking Research and marketing opportunities for pulses in the 21st Century. Proceeding of the third international Food Legumes Research Conference, Kluwer academic Publishers, Dordrecht, pp. 1-29.
- Asfaw T, Beyene D, Tesfaye G (1994) Genetics and Breeding of Field pea. In: Asfaw T, Geletu B, Saxena MC, Solh MB (Eds.), Cool-Season Food Legumes of Ethiopia. Proceeding of the first national cool-season food legumes review conference, Addis Ababa, Ethiopia, p. 440.
- Dereje G, Tesfaye B (1994) Field pea Disease in Ethiopia. In: Asfaw T, Geletu B, Saxena MC, Solh MB (Eds.), Cool-Season Food Legumes of Ethiopia. Proceeding of the first national cool-season food legumes review conference, Addis Ababa, Ethiopia, pp. 317-327.
- Tiwari G, Lavanya GR (2012) Genetic variability. In: character association and component analysis in F4 generation of field pea (Pisum sativum var. arvense L.). Karnataka Journal of Agricultural Science 25(2): 173-175.
- Saddika A, Aminul Islam AKM, Rasul MG, Mian MAK, Ahmed JU, et al. (2013) Genetic variability in advanced generations of vegetable pea (Pisum sativum L.). International Journal of Plant Breeding 7(2): 124128.
- Gemechu K, Mussa J, Tezera W, Getnet D (2005) Extent and pattern of genetic diversity of morpho-agronomic traits in Ethiopian highland pulse landraces In: Field pea (Pisum sativum L.). Genet Resource and Crop Evolution 52: 539-549.
- Gemechu K, Fassil A, Imtiaz M, Endashaw B (2013) Genetic diversity for attributes of biological nitrogen fixation in Abyssinian field pea (Pisum sativum var. Abyssinicum) germplasm accessions. Ethiop Journal of Applied Science and Technology 4(2): 1-21.
- Burstin J, Salloignon P, Chabert-Martinello M, Magnin-Robert JB, Siol M, et al. (2015) Genetic diversity and trait genomic prediction in a pea diversity panel. MBC Genomics 16: 105-121.
- Jing R, Vershinin A, Grzebyta J, Shaw P, Smykal P, et al. (2010) The genetic diversity and evolution of field pea (Pisum) studied by high throughput retrotransposon based insertion polymorphism (RBIP) marker analysis. BMC Evolutionary Biology 10: 44-63.
- Abel T, Tomas B, Kifle D, Mulatu G. Assessment of genetic diversity in Ethiopian field pea (Pisum sativum L.) accessions with newly developed EST-SSR markers. BMC Genetics 16: 102-123.
- Abel T, Esayas M, Mulatu G, Derege A, Anderson P, et al. (2015) Screening the primary gene pool of field pea (Pisum sativum L. subsp. sativum). In: Ethiopia for resistance against pea weevil (Bruchus pisorum L.). Genet Resource Crop Evol 62: 525-538.
- Gemechu K, Mussa J, Tezera W (2007) Eco-geographic distribution and microcenters of genetic diversity in Faba Bean (Vucua faba L.) germplasm collection from Ethiopia. East African Journal of Science 1(1): 10-24.
- Azmat MA, Nawab NN, Khan AA, Ashraf M, Niaz S, et al. (2011) Characterization of pea germplasm. International Journal of Vegetable Science 17(3): 246-258.
- Smykal P, Kenicer G, Flavell AJ, Corander J, Kosterin O, et at. (2011) phylogeography and genetic diversity of the Pisum genus. Plant Genetic Resources 9(1): 4-18.
- Tezera W (2000) Genotypexenvironment interaction in field pea (Pisum sativum L.) for yield and other traits across central and southern Ethiopia. Haramaya University of Agriculture, Ethiopia.L.) Genotypes. Agri Res & Tech: Open Access J. 2017; 8(4): 555740. DOI: 10.19080/ARTOAJ.2017.08.555744.Agricultural Research & Technology: Open Access Journal
- Million F (2012) Variability, Heritabiity and Associations of Some Morpho-agronomic Traits in Field pea (Pisum sativum L.) Genotypes. Pakistan Journal of Biological Science 15(8): 358-366.
- Carl F, Horst L, Tobias W (2014) Genetic variability, heritability and correlation among agronomic and disease resistance traits in a diversity panel and elite breeding materials of spelt wheat. Plant breeding 133(4): 459-464.
- Singh BD (1990) Plant breeding. Principles and methods. Kalyani Publishers, New Delhi, India.
- SAS (2002) System Analysis Software. Version 9.0. SAS Institute Inc., Cary, North Carolina, USA.
- Allard RW (1960) Principles of Plant Breeding. John Wiley & Son, New York, USA.
- Lynch M, Walsh B (1997) Genetics and Analysis of Quantitative Traits. Sinauer Associates Inc., Sunderland, USA.
- Singh RK, Chaudhary BD (1985) Biometrical methods in quantitative genetic analysis. Kalyani Publishers, New Delhi, India.
- Robinson HF, Comstock RE, Harvey VH (1951) Genotypic and phenotypic correlation in corn and their implications in selection. Agronomy Journal 43: 280-281.
- Gomez KA, Gomez AA (1984) Statistical procedures for agricultural research. (2nd edn), John Wiley & Sons, Inc. Singapore, p. 680.
- Naveen KJ, Ajeet KG, Hiralal D, Roopa GL (2013) Genetic variability analysis in field pea (Pisum sativum L.). International Journal of Scientific Research 4(1): 2006-2007.
- Saxesena RR, Vidyakar V, Sishwakarma MK, Yadav PS, Meena ML, et al. (2014) Genetic variability and heritability analysis for some quantitative traits in field pea (Pisum sativum L.). Supplement on Genetics and Plant Breeding 9(2): 895-898.
- Ceyhan E, Kahraman A, Ates MK, Karadas S (2012) Stability analysis on seed yield and its components in peas. Bulgarian Journal of Agricultural Science 18: 905-911.
- Tamene TT, Gemechu K, Tadese S, Mussa J, Yeneneh B (2013) Genotype x environment interaction and performance stability for grain yield in field pea (Pisum sativum L.) Genotypes. International Journal of Plant Breeding 7(2): 116-123.
- Fox PN, Skovm B, Thompson BK, Braun HJ, Cormier R (1990) Yield and adaptation of hexaploid spring triticale. Euphytica 47(1): 57-64.
- Makanda I, Tongoona P, Derera J (2009) Quantification of genotypic variability for stem sugar accumulation and associated traits in new sweet sorghum varieties. African Crop Science Conference Proceedings 9: 391-398.
- Jiang Q, Webb SL, Yesudas ChR, Bhandari HS, Narasimhamoorthy B, et al. (2014) Variance components and heritability of biomass yield in switch grass grown in the Southern Great Plains. Field Crops Research 168: 148-155.
- Georgieva N, Nikolova I, Kosev V (2016) Evaluation of genetic divergence and heritability in pea (Pisum sativum L.). Journal of Biological Science and Biotechnology 5(1): 61-67.
- Kebebew A, Gina C, Dejene G, Rizqah K, Solomon Ch, et al. (2015) Genetic diversity in tef (Eragrostis tef (Zucc.) Trotter). Frontiers of Plant Science 6(177): 1-13.
- Singh BK, Deka BC, Ramakrishna Y (2014) Genetic variability, heritability and interrelationships in pole-type French bean (Phaseolus vulgaris L.). Proceedings of National Academic Science. Proceedings of the National Academy of Science India 84(3): 587-592.
- Elangovan M, Kiran babu P, Seetharama N (2014) Genetic diversity and heritability characters associated in sweet sorghum (Sorghum bicolor (L.) Moench). Journal of Sugar Technology 16(2): 200-210.
- Peter MV, William GH, Naomi RW (2008) Heritability in the genomics era- concepts and misconceptions. Nature Review Genetics 9: 255-266.
- Ranjan S, Kumar M, Pandey SS (2006) Genetic variability in pea (Pisum sativum L.). Legume Research 29(4): 311-312.
- Kumar D, Malik S, Singh SK, Kumar M (2013) Genetic variability heritability and genetic advance for seed yield and yield components in garden pea (Pisum sativum L.). Vegetos 26(1): 182-184.
- Chahal GS, Gosal SS (2002) Principles and procedures of plant breeding: biotechnological and conventional approaches. India Narosa Publishing House, New Delhi, India.


