


Characterization of Temporal Attribute of Common rust Epidemics of Maize in Ethiopia
Alemayehu Hailu*, Tajudin Aliyi, Belay Habtegebriel, Messeret Negash and Demissew Abakemal
Ethiopian Institute of Agricultural Research, Ethiopia
Submission: May 15, 2017; Published: July 19, 2017
*Corresponding author: Alemayehu Hailu, Ethiopian Institute of Agricultural Research, Ambo Plant Protection Research Center, P.O. Box 37, Ambo, Ethiopia, Email: alemayehuhailu65@yahoo.com
How to cite this article: Alemayehu H, Tajudin A, Belay H, Messeret N, Demissew A.Characterization of Temporal Attribute of Common rust Epidemics of Maize in Ethiopia. Agri Res & Tech: Open Access J. 2017; 8(3): 555739. DOI: 10.19080/ARTOAJ.2017.08.555739
Abstract
Common leaf rust (CLR) of maize which is caused by Puccinia sorghi Schw is a major foliar disease in Ethiopia causing yield loss in the range of 12 to 61%dependinguponthegenotype. Field Experiments were conducted for two consecutive years in Ambo Plant Protection Research center (APPRC) to study the temporal attributes of the disease. Six parental lines which constituted moderately resistant (line 1, line 2, line 3 & line 6) and resistant (line 4 & line 5) selected from highland maize screening tests were used for the experiments. A randomized complete block design with three replications was used. There was significant difference among the six lines in infection rates (P= 0.015) while AUDPC and Severity did not differ in 2014, at Ambo.AUDPC (P= 0.0008) and Severity (P= 0.001) showed significant differences among six lines where as infection rates did not differ in 2015, at Ambo. Maize lines 1, 2, 3, and 5 were explained by the monomolecular model. Line4 was fitted to gompertz model. Whereas, line 6 did not fit to any models in 2014. Maize lines 3, 4 and 6 were explained by monomolecular model while Lines 1, 2 and 5 were not fitted to any models in 215. None of the models was able to effectively explain the disease progress at Ambo in 2015. Additional studies involving more maize lines and locations are recommended to adequately explain the epiphytotics of the disease and to recommend resistant lines for breeding programs.
Keywords: Common leaf rust; Puccinia sorghi; Temporal attributes; Disease progress models
Introduction
Maize (Zea mays L.) is one of the popular crops grown in the world, ranking second to wheat and followed by rice [1]. It occupies an important position in the world economy as food, feed, and industrial grain crop. It is a staple food for several million people in the developing world where they derive their protein and calorie requirements from it.
Maize is among the leading cereal crops selected to achieve food self-sufficiency in Ethiopia [2]. Although, improved cultivars have been largely included in the national extension package, the national average yield of maize is only 3.45tons/ha [3], which is far below the world average of 5.5tons/ha.
The low yield is attributed to a number of factors such as Biotic (Diseases, insect pests, and weeds), abiotic (moisture, soil fertility, etc). Among biotic factors, foliar diseases such as turcicum leaf blight (Exserohilumtrurcicum) and common rust (Puccinia sorghiSchw) are generally among the important constraints in tropical maize production [4]. Especially common rust caused by Puccinia sorghiSchw is a destructive disease in the major maize growing highland areas and causes from 12-61% yield loss in disease epidemic years [5].
Plant disease epidemics can be studied by analyzing disease spread over time and space [6]. Analysis of disease epidemics over time often referred to as temporal studies. Several disease progress model shave been proposed for characterizing increase in disease overtime for polycyclic diseases with the logistic and Gompertz models being most frequently used. These models define disease progress in terms of rate of disease increase and estimated disease level at the observed start of the epidemic. Such study provide basic information to device rust management tactics, thus in Ethiopia where maize is the back bone of the country generation of such basic information is very crucial. Therefore, the objective of this paper was to carry out epidemiological studies on the temporal attributes of ruston Maize high land area.
Materials and Methods
The experiment was conducted in Ambo plant protection research center for two consecutive years (2014- 2015 main cropping seasons). Six germ plasms/lines/that constitute Resistant [2] and moderately resistant [4] were used. The treatment was arranged following a randomized complete block design (RCBD) with three replications. The plots were tract or ploughed and disc harrowed twice before planting. The experimental unit measured 4.5x4.5m with 6 maize rows planted at a spacing of 75X30cm. All plots were planted by hand with two seeds per hole. Inorganic fertilizer (Dap & Urea) and all agronomic practices were applied based on the area recommendations.
Inoculation and disease assessment
Rust inoculum was collected from naturally infected leaves showing large number of pustules. Collection of rust uredospore was done by lightly tapping the leaves in to a cup or a suitable container. The spores were dried and kept in tightly sealed glass jars and stored at minus 20 °C. Maize plants under field conditions were inoculated first time at around 6-8 leaf stage and it repeated within 2 weeks. Rust spore suspension @60,000spores/ml was prepared and applied in the whorl using hand atomizer. To avoid spores clump together on the upper surface of the water, the spore suspension was agitated (stirred) continuously and tween 20 was added in the solutions. One week after inoculation, plots were assessed for disease severity using a 1 to 5 scale [7]. Disease assessment commenced 7 days after inoculation. Six assessments were made at 7 day intervals from four central tag maize plants with visual observations.
Modeling temporal disease spread and data analysis
Rust symptoms were observed on each test plant by visual assessment on the leaves. Plants will be assessed for six weeks. Disease data was subjected to ANOVA. Severity data was used to compute areas under disease progress curves (AUDPC), as well as tested to check Logistic, Monomolecular and Gompertz models. Areas under disease progress curves (AUDPC) were computed according to Campbell & Madden [6]. The formulae for computing AUDPC is given as
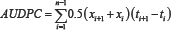
Where, Xi is the cumulative disease severity expressed as aproportion at the h observation, ti is the time (days after planting) at the it h observation and n is total number of observation.
Apparent infection rate is an estimate of the rate of progress of a disease, based on proportional measures of the extent of infection at different times.
Firstly, a proportional measure of the extent of infection is chosen as the disease extent. For example, this might be the proportion of leaf area affected by mildew, or the proportion of plants in a population showing dieback lesions. Measures of disease extent are then taken over time, and a mathematical model is fit. The model was based upon two assumptions:
- The progress of the infection is constrained by the amount of tissue that remains to be infected; and if it were not so constrained, the extent of infection would exhibit exponential growth.
- There is a single model parameter r, which is the apparent infection rate. It can be calculated analytically using the formula

Where:
r is the apparent infection rate, t1 is the time of the first measurement, t2 is the time of the second measurement, x1 is the proportion of infection measured at time t1, x2 is the proportion of infection measured at time t2
Fitting of the data to growth curve models of Logistic and Gompertz are performed to characterize the polycyclic nature of epidemics. The slope of the curve, (r) depicts rate of disease increase over time, and y, the theoretical estimates of initial amount of epidemic y0 (y-axis intercept). The Logistic model was given by
Ln (y/(1-y) )= ln (y0/(1-y0))+ rt
Computation of y and r (apparent rate of infection) was performed over time. Data was also fitted to the Gompertz model (Berger 1981) as described for the logistic models expect that the linearized formula for the Gompertz model may be different, i.e. it is given by
-ln {-ln(y)} = -ln {(-lny0)} + rt
These models are selected because of their common usage and suitability for different fungal diseases. In these models y is proportion of disease severity at time (t) due to inoculums application and background infection and r is the slope. The appropriateness of each model was evaluated on the basis of coefficient of determination (R2) and plot of residuals. As appropriate, data was subjected to ANOVA and if significant differences were found, means were compared using Fisher's Protected Least Significant Differences(LSD)at P<0.05.
Result and Discussion
There was statically variation among six maize lines in mean infection rates of rust disease at Ambo, in 2014. Relatively higher mean infection rate of rust disease was recorded on maize line 3, 2 and 5 even though line 2 and 5 was statically at par with line 1 and 4 (Table 1). The least infection rate of rust was recorded on maize line 6 though statically the same with line 4 and 1. There were no significant differences among six maize lines in AUDPC and severity of rust disease at Ambo, in 2014 (Table 1).

There was statically variation among maize lines in mean area under disease progress curve (AUDPC) and mean severity of common leaf rust at Ambo, in 2015 as shown below Table 2.

The highest mean AUDPC and severity of rust disease was recorded on maize line 4, but these parameters did not varied on maize line 1, 2, 3, and 5 (Table 2). The list mean AUDPC and severity of rust disease was recorded on maize line 6 (Table 2). However, there was no significant variation among six maize lines in infection rate of rust disease at Ambo in 2015 (Table 2). Rust disease was fitted to monomolecular (M) model on [KIT/SNSYN [N3/TUX]] c1F1. ##(GLS=2)-32-2-2-1-1-#-# (maize line 1),N-19-2011-P#2(maize line 2) , [KlT/SNSYN[N3/TUX]]c1F1-##(GLS=1)-21-2-3-1-1-1-#(maize line 3) and[POOL9Ac7-SR (BC2)] FS67-1-2-3-1-#-#-#-#-# (Maize line 5) at Ambo, in 2014 (Table 3).

Rust disease also described by Gompertz model on [KIT/ SNSYN [N3/TUX]] c1F1-## (GLS=2)-23-3-3-1-1-# (maize line 4) at Ambo in the same growing season. Whereas, rust disease was not fitted to any models on [POOL9Ac7-SR (BC2)] FS59-4-1-2-1-1-1-#-#-#-# (maize line 6) and this is due to R-square was below 0. 5 (50%) on the mentioned maize line as shown Table 3.

Rust disease was fitted to monomolecular model on [KIT/ SNSYN[N3/TUX]]c1F1-##(GLS=1)-21-2-3-1-1-1-# (maize line 3) , [KIT/SNSYN[N3/TUX]]c1F1-##(GLS=2)-23-3-3-1-1-# (maize line 4) and [POOL9Ac7-SR(BC2)] FS59-4-1-2-1-1-1-#-#-#-# (maize line 6) at Ambo, in 2015 (Table 4). However, rust disease was not described by any model types on [KIT/SNSYN[N3/TUX]] c1F1 ##(GLS=2)-32-2-2-1-1-#-# (maize line 1), N-19-2011-P#2 (maize line 2) and [POOL9Ac7-SR (BC2)] FS67-1-2-3-1-#-#-#-#- # (Maize line 5) at Ambo, in 2015 (Table 4).
Conclusion and Recommendation
Rust disease is among devastating foliar fungal diseases of maize in Ethiopia. Temporal epidemiology was studied at Ambo using six maize lines. There was significant difference among the six lines in rust disease apparent infection rates while AUDPC and severity did not differ in 2014 at Ambo. There were significant variations among maize lines in rust AUDPC and severity while apparent infection rates did not varied in 2015 at Ambo.
Rust disease was fitted to Gompertz on maize and Monomolecular on maize line 1, 2, 3 and 5 at Ambo in 2014 growing season. Rust disease was not described by any models on maize line 6 at Ambo in the same growing seasons. Rust disease was fitted to Monomolecular model on maize line 3, 4 and 6 whereas it was not described by any models on maize line 1, 2 and 5 in 2015 at Ambo.
Except on maize line 3, rust disease was not described by the same models on the same maize lines in 2014 and 2015 growing seasons at Ambo. Therefore, additional studies involving more maize lines and locations are recommended to adequately explain epiphytotic of rust disease and to recommend resistant lines for breeding programs. Race analysis should be done in order to check race variability. Moreover, disease intensities should be correlated with environmental factors.
Acknowledgment
I would like to thank Ethiopian Institute of Agricultural research and Ambo Plant Protection Research Center for providing support in different aspects during the research time.I also owe my deepest gratitude to Dr. Belay Habitegebriel for his unreserved support in stastical analysis guidance and data management system.
References
- Vasal SK (2000) Quality maize story. In: Improving Human Nutrition through Agriculture. The Roll of International Agricultural Research. A workshop hosted by IRRI, Philippines, Organized by International Food Policy Institute, Los Banos, USA.
- Bello OB, Abdulmalig SY, Afolabi MS, Lge SA (2010) Correlation and path coefficient hybrids analysis of yield and agronomic characters among open pollinated maize varieties and their F1in a diallel cross. Afr JBiotech 9(18): 2633-2639.
- Central Sastical Authority (2015) Agriculture sample survey report on area and production for major crops for 2014/015. The FDRE Sastical Buletin, CSA, Addis Ababa, Ethiopia.
- Renfro BL, Ullstrup AJ (1996) Comparison of maize disease in temperate and tropical environments. PANS 22: 491-498.
- Dey U, Harlapur SI, Dhutraj DN, Suryawanshi AP, Badgujar SL, et al. (2012) Spatiotemporal yield loss assessment in corn due to common caused by ;Puccinia sorghi Schw. Afr J Agric Res 7(37): 5265-5269.
- Campbell CL, Madden LM (1990) Introduction to Plant Disease Epidemiology. John Wileyand Sons, New York, USA.
- Payak MM, Sharma RC (1982) Maize diseases and approaches to their management in India. Trop Pest Management 31(4): 302-310.


