- Research Article
- Abstract
- Introduction
- Materials and Methods
- Analyses of Total Elements in Polyhalite
- Salt Index (SI)
- Water Solubility of Polyhalite
- Leaching as a Measure of Nutrient Release from Polyhalite
- Results and Discussion
- Leaching as a Measure of Nutrient Release from Polyhalite
- Conclusion
- Acknowledgement
- References
Characterizing Polyhalite Plant Nutritional Properties
Marcel Barbier1*, Yuncong C Li2, Guodong Liu1, Zhenli He1, Rao Mylavarapu3 and Shouan Zhang3
1Department of Soil and Water Science Department, University of Florida, USA
2Department of Horticultural Sciences, University of Florida, USA
3Department of Plant Pathology, University of Florida, USA
Submission: February 06, 2017; Published: May 02, 2017
*Corresponding author: Marcel Barbier, Department of Soil and Water Science, University of Florida, Homestead, Florida, USA, Tel: +17862526442; Fax: +13052467003; Email: marcelbarbier@ufl.edu
How to cite this article: Marcel B, Yuncong C L, Guodong L, Zhenli H, et al. Characterizing Polyhalite Plant Nutritional Properties. Agri Res & Tech: Open Access J. 2017; 6(3): 555690. DOI: 10.19080/ARTOAJ.2017.06.555690.
- Research Article
- Abstract
- Introduction
- Materials and Methods
- Analyses of Total Elements in Polyhalite
- Salt Index (SI)
- Water Solubility of Polyhalite
- Leaching as a Measure of Nutrient Release from Polyhalite
- Results and Discussion
- Leaching as a Measure of Nutrient Release from Polyhalite
- Conclusion
- Acknowledgement
- References
Abstract
Polyhalite (POLY) has the potential, not only to be an alternative for traditional potassium (K) fertilizers, but also to provide other nutrients including calcium (Ca), magnesium (Mg), and sulfur (S). The objective of this study was to characterize POLY in terms of total elemental contents, solubility in water, salt index and mobility in three different soils (sandy, loamy and calcareous). The results showed that naturally occurring POLY contains 11.3±0.2, 11.0±2.4, 3.8±0.2 and 18.5±3.2 % of the K, Ca, Mg, and S, respectively, with additional nutrients of Fe, Zn, Ni, Cu, and Mn. The salt index determined for POLY was lower than these for muriate of potash (MOP) and sulfate of potash (SOP), and higher than sulfate of potash magnesia (SOPM). POLY had lower solubility than MOP, SOPM and SOP. However, the solubility of POLY should not affect availability of nutrients to plants because the normal rate of field application of POLY as a fertilizer is within the range of the solubility.
Keywords: Potassium; Calcium; Magnesium; Sulfur; Solubility; Mobility; Salt index
- Research Article
- Abstract
- Introduction
- Materials and Methods
- Analyses of Total Elements in Polyhalite
- Salt Index (SI)
- Water Solubility of Polyhalite
- Leaching as a Measure of Nutrient Release from Polyhalite
- Results and Discussion
- Leaching as a Measure of Nutrient Release from Polyhalite
- Conclusion
- Acknowledgement
- References
Introduction
In the United States during the early 1930's, there was strong interest for polyhalite (POLY) because it was the chief and most abundant mineral present in a large salt deposit under approximately 103,600 square kilometers in western Texas and New Mexico [1,2]. The interest vanished after the discovery of muriate of potash (MOP) in vast quantities in Saskatchewan, Canada making the industry moves completely to that mining area [3,4]. Since then, POLY has not been fully commercially available as a fertilizer, and consequently there is little recent published information about the performance of POLY as a fertilizer for crop production. Potassium fertilizer industry is changing again and POLY is emerging as a potential fertilizer source. First, because of favorable economics resulting from the dramatic price increase in potash fertilizers (a 5.4% Compound Annual Growth Rate) for MOP since 1974 [5]. Second, due to the emerging need for sulfur (S) fertilization to optimize crop yield and quality, and third due to the development of significant minable deposits of high quality POLY in the United Kingdom (UK) that occur in the Zech stein deposits of Upper Permian age in the southern North Sea basin [6]. Israel Chemical Ltd (ICL) Fertilizers Europe currently mines POLY from a portion of the Zech stein deposits in the UK and is marketing POLY fertilizer under the product name polysulphate™ with a published analysis of 14% K2O, 48% SO3, 6% MgO, and 17% CaO [7]. Sirius Minerals Plc. is developing a large POLY mine from another portion of the extensive Zech stein deposits over the next few years to produce POLY fertilizers under the brand name Poly4 [8]. Polyhalite fertilizers produced from the Zech stein deposit have not been independently characterized and desired data on nutrient content, solubility, nutrient release and salt index (SI) of POLY are not available and not reported in research fertilizer publications.
Salt index (SI) is an important property of fertilizers because all fertilizers are salts that may affect seeds or plants by increasing the osmotic potential of a soil solution affecting seed germination and/or plant growth [9]. The proportion of the increase in osmotic pressure of the salt solution produced by a particular fertilizer to the osmotic pressure of the same weight of sodium nitrate (NaNO3) defines "salt index” [10,11]. Sodium nitrate was selected as the standard to measure salt index because it is 100 percent water-soluble. Solubility is another important property of fertilizers because solubility varies considerably among fertilizers affecting nutrient release rates and therefore nutrient availability to plants, potential for losses due to leaching, runoff, and volatilization, and their use in liquid fertilizers. The solubility of MOP 344gL-1 is approximately three times greater than for sulfate of potash (SOP) 120gL-1 [12,13]. Barbarick [14] stated that POLY was less water soluble than more conventional fertilizer sources. However, in that study, dry matter yield and K uptake in sorghum-sudan grass were higher and Ca and K more readily leached with POLY than with a soluble blend made with SOP, gypsum, Kieserite, and ammonium sulfate. That study suggests that the behavior of nutrients after POLY was applied into a soil may be different from in water although nutrient release rates from POLY in soil are relatively unknown. The objective of this study was to characterize fertilizer POLY in terms of total elemental content, solubility in water, salt index, and mobility in soil compared with other potassium based fertilizers.
- Research Article
- Abstract
- Introduction
- Materials and Methods
- Analyses of Total Elements in Polyhalite
- Salt Index (SI)
- Water Solubility of Polyhalite
- Leaching as a Measure of Nutrient Release from Polyhalite
- Results and Discussion
- Leaching as a Measure of Nutrient Release from Polyhalite
- Conclusion
- Acknowledgement
- References
Materials and Methods
Sirius Minerals Plc, York, UK, provided both, natural and calcined POLY samples. POLY samples were obtained from exploration drill cores in the Zech stein deposits near Whit by, UK, and the calcined POLY was obtained by heating at 480 °C (to dehydration) a homogenized sample from the three cores (fertilizer grade). Both the natural and calcined POLY samples were milled to <200μm in diameter. Commercial grade MOP, SOP, and SOPM fertilizers were obtained from a commercial fertilizer distributor in Homestead, Florida. For those fertilizers, all had a normal range particle size of 1-4mm in diameter.
- Research Article
- Abstract
- Introduction
- Materials and Methods
- Analyses of Total Elements in Polyhalite
- Salt Index (SI)
- Water Solubility of Polyhalite
- Leaching as a Measure of Nutrient Release from Polyhalite
- Results and Discussion
- Leaching as a Measure of Nutrient Release from Polyhalite
- Conclusion
- Acknowledgement
- References
Analyses of Total Elements in Polyhalite
Total concentrations of elements in calcined and natural POLY were analyzed following procedures modified after the USEPA method 6020A [15]. Briefly, each sample (about 0.5g) was digested with 5ml of concentrated nitric acid at 145±5 °C on a hot block for one hour, cooled off, and after drop wise adding 1 ml of 30% H2O2 the samples were placed back on the hot block digested for 20 additional minutes. After the second heating, the samples were cooled to room temperature and diluted to a 50mL volume with distilled water. After filtered, the sample was further diluted, if necessary, and analyzed using an inductively coupled plasma-mass spectrometry (ICP-MS, Perkin Elmer Elan DRCe, Perkin-Elmer, Wellesley, MA). The method detection limits (MDLs) are presented in Table 1.
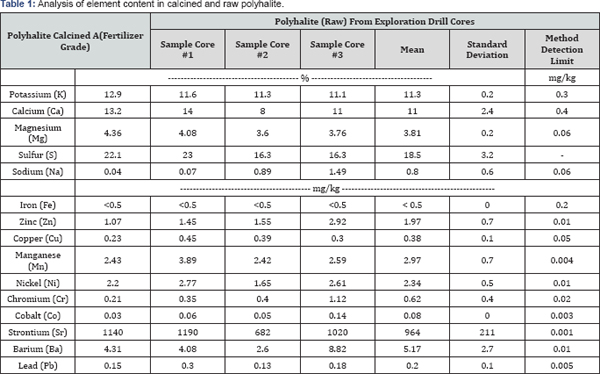
aRaw polyhalite was heated at 450 °C.
- Research Article
- Abstract
- Introduction
- Materials and Methods
- Analyses of Total Elements in Polyhalite
- Salt Index (SI)
- Water Solubility of Polyhalite
- Leaching as a Measure of Nutrient Release from Polyhalite
- Results and Discussion
- Leaching as a Measure of Nutrient Release from Polyhalite
- Conclusion
- Acknowledgement
- References
Salt Index (SI)
Salt index (SI) was determined for POLY, MOP, SOP and SOPM using the Jackson [16] method. One gram of each material including the reagent-grade sodium nitrate (the standard) was dissolved in 400ml de ionized water at 20 °C contained in a 500ml volumetric flask by stirring vigorously for 10 minutes until fertilizer was completely dissolved. The electrical conductivity (EC) of the solution was measured using an Accumet AR60 multiparameter meter (Thermo Fisher Scientific, Waltham, MA) and the salt index (SI) was calculated using equation 1:
SI=(EC of fertilizer solution/EC of NaNO3) x 100..................[1]
Three replications of EC assessments and SI calculations were performed for each fertilizer Additional data on salt index for POLY and other potassium fertilizers wereobtained from other sources including measurements from other researchers and private laboratories. In all cases, the Jackson [16] method was used to determine salt index although there was likely some variation in the method among laboratories.
- Research Article
- Abstract
- Introduction
- Materials and Methods
- Analyses of Total Elements in Polyhalite
- Salt Index (SI)
- Water Solubility of Polyhalite
- Leaching as a Measure of Nutrient Release from Polyhalite
- Results and Discussion
- Leaching as a Measure of Nutrient Release from Polyhalite
- Conclusion
- Acknowledgement
- References
Water Solubility of Polyhalite
Two non-standard methods for determining polyhalite solubility were used. Both methods were conducted at room temperature maintained at 25±0.5 °C during the procedure. For the first method, called "simple solubility”, 40ml of deionized water and 2g of POLY were adding to a weighed, pre-dried 50ml- beaker containing a what man No. 42 filter paper The rate of 2g to 40ml of water was determined in preliminary tests to exceed the solubility of polyhalite by 4 to 5 times as normally done for solubility tests. After the mixture was stirred for 15min on a stirring plate at 300rpm, the solution was filtered. After the beaker and filter paper were dried at 105 °C for 4 hours and cooled in a desiccator to room temperature, the weight was recorded. Solubility was determined as the difference in weight of the beaker and filter paper before and after the dissolution (equals the amount of fertilizer that did not dissolve) divided by 40ml with solubility reported as gL-1. Solubility measurements using this method were repeated three times.
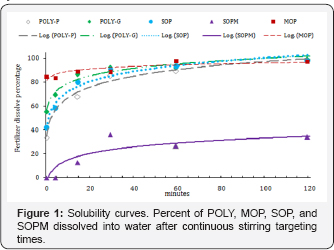
For the second method, solubility, also called "solubility curves” of POLY powdered and granulated (1-4 mm diameter) were determined and compared to granular MOP, SOP, and SOPM over a range of continuous stirring of 1,5,15,30,60and 120min. Approximately 0.2g of fertilizer was added to a 50-ml centrifuge tube. The rate of 0.2g to 40ml of water was well below the solubility of polyhalite in water at 25 °C as determined in the simple solubility test. After addition of 40ml of deionized water, the solution in the tubes was stirred for the target stirring time. After that, the solutions were filtered through a filter paper (Whatman No. 1) in the tube and the tubes and filter paper were oven dried at 105 °C for two hours and then weighed. Solubility was determined as the difference in weight of the tube and filter paper before and after the dissolution by continuous stirring (equals the amount of fertilizer that did not dissolve) and reported as percentage of fertilizer dissolved into water after continuous stirring times.
- Research Article
- Abstract
- Introduction
- Materials and Methods
- Analyses of Total Elements in Polyhalite
- Salt Index (SI)
- Water Solubility of Polyhalite
- Leaching as a Measure of Nutrient Release from Polyhalite
- Results and Discussion
- Leaching as a Measure of Nutrient Release from Polyhalite
- Conclusion
- Acknowledgement
- References
Leaching as a Measure of Nutrient Release from Polyhalite
To study nutrient leaching from POLY in comparison with MOP, SOP, and SOPM, three soils (Norfolk loamy fine sand soil was collected at the North Florida Research and Education Center, Quincy, FL; a mixture of Ankona and Farmton sands collected at the Indian River Research and Education Center, Fort Pierce, FL; and Krome very gravelly loam collected at the Tropical Research and Education Center, Homestead, FL). The Norfolk series consists of well-drained, nearly level and gently sloping soils on uplands formed in Coastal Plain sediment [17]. The Ankona and Farmton series consists of very deep, poorly drained, slowly permeable soils on broad-flats and flat woods and in depressional areas of central and southern Florida. They formed in sandy and loamy marine sediments. The Krome series consists of very shallow, moderately well drained, moderately permeable soils over limestone. They formed by scarification of outcrops of oolitic limestone, and the loamy residuum that partially covers the limestone and fills the many cavities or solution holes.
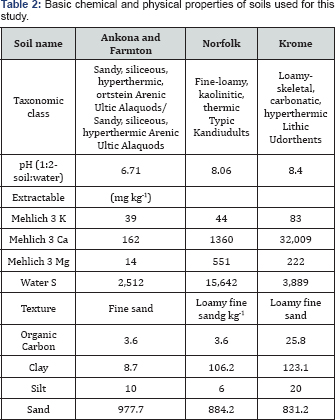
Soil properties for each soil were determined as follows: a) soil pH was measured with 1:2 soil-water extraction using a pH/EC meter; b) soil organic carbon was determined by the Walkley-Black method [18], soil cation exchange capacity (CEC) was determined by NaOAc-NaCl method [19], soil K, Ca, and Mg were extract with and analyzed using an inductively coupled plasma-mass spectrometry (ICP-MS, Perkin Elmer Elan DRCe, Perkin-Elmer, Wellesley, MA); e) water extractable sulfate was determined using the turbidimetric method [20] and analyzed with a spectrophotometer (Beckman DU-640, Brea, CA, USA); and f) soil textural classification was determined by using the Bouyoucos hydrometer method and the online soil texture calculator of the Natural Resources Conservation Service Soils, USDA [21]. The soil properties for each soil are summarized in Table 2.
Leaching columns were designed to facilitate continuous application of water at the top of the column, a soil column of adequate length, and a leach ate collection system at the bottom. The columns were made ofPVC pipes (50.8mm internal diameter) and couplings. The top section contains the water holding compartment which includes a 100mm long pipe mounted on PVC coupling with a bottom base made of acrylic plastic which had five 3mm diameter holes to accommodate standard 21Gauge needles. A soil-holding compartment (mid-section) was 400mm long and placed between the water-holding compartment and a column base. The column base was acrylic plastic with nine 5mm diameter holes incrusted on a PVC coupling. A 1mm plastic screen was place over the acrylic base and covered with two Whatman 42 filter papers. Forty-five columns were built to accommodate three replications of each three soils with four fertilizers plus a control.
Each column was carefully packed with air dried and screened (< 2mm) soil to a height of 30 cm and bulk densities of 1.7gcm- 3 for the Ankona/Farmton sand, 1.5gcm-3 for the Norfolk loamy fine sand, and1.2gcm-3 for the Krome very gravely loam. The corresponding soil porosities of 35, 44 and 56%, respectively, were used to calculate soil volume per column. For Each soil column except the control, one of fertilizer treatments at the rate of 61 K2O mg per column (equivalent to 300 K2Okgha-1) was applied to the soil surface and mixed into the top 1cm of soil.
To initiate leaching, soils in columns were saturated with water by placing them in 20-liter plastic buckets containing deionized water for 24h. Water was applied to each column via a drip application at the rate of 0.22mls"1 with 117ml of deionized water applied every three days corresponding to a single leaching event. This process was repeated over a period of 72 days, for twenty-four events in total. The total volumes of water applied is approximately 2800ml to emulate two years of the average rainfall that occurred in average in the State of Florida for the last five years [22]. Leach ates were collected and measured for volume and stored for chemical analyses using same methods described above.
- Research Article
- Abstract
- Introduction
- Materials and Methods
- Analyses of Total Elements in Polyhalite
- Salt Index (SI)
- Water Solubility of Polyhalite
- Leaching as a Measure of Nutrient Release from Polyhalite
- Results and Discussion
- Leaching as a Measure of Nutrient Release from Polyhalite
- Conclusion
- Acknowledgement
- References
Results and Discussion
Analyses of elements in Polyhalite
The elemental content of K, Ca, Mg, and S in calcined POLY were 12.9, 13.2, 4.36, and 22.1%, respectively, compared to 11.3±0.2, 11.0±2.4, 3.8±0.2 and 18.5±3.2% for natural POLY (Table 1). The coefficient of variation for Ca and S in POLY were high, 22 and 17%, respectively, compared to 2 and 5% for K and Mg, indicating either considerable variation either in the samples and/or in the analytical determination. The elemental content of calcined POLY had higher values than natural POLY as would be expected given it was heated to remove the water molecules which constitute 6% of pure polyhalite. ICL guarantees a minimum content of 11.6, 12.2, 3.6, and 19.2% for K, Ca, Mg and S in their product polysulfate™ [23]. The Societe Generale de Surveillance (SGS) analyzed 154 samples of POLY obtained from drill cores of the Zechstein deposits and report average K, Ca, Mg and S of 11.9±0.36, 14.1±1.77, 3.8±0.29 and 20.3±0.74 %, respectively [24]. The elemental content of K, Ca, and S in natural POLY presented in Table 1 are -1.7, -1.8 and -2.4 standard deviations from the means of 154 samples reported by SGS (2014) but the same mean for Mg. Therefore, compared to ICL minimum values and SGS means, the elemental contents of POLY measured here are slightly lower but may be representative of variation in POLY from the Zechstein deposit or reflect differences in methods of analysis used by SGS [24]. The SGS followed standard methods of the European Union [25] in which much higher amounts of fertilizer were use in various procedures compared to our acid digestion procedure.
Potential contaminates (Al, Se, Cd, As, Ti, Be, and Ag) in POLY were below the method detection limits (MDLs) and are far below Florida Soil Cleanup Target Levels (CTLs) [26]. Therefore, the application of POLY as fertilizers will not lead to soil contamination. Actually, additional agronomic value may be provided by micronutrient levels of Zn (1.97mgkg-1), Cu (0.38mgkg_1), and Mn (2.97mgkg_1). Small levels of Ni may be of value as Ni is now considered a plant essential element [27].
Salt index (SI) of polyhalite
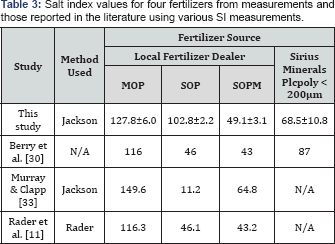
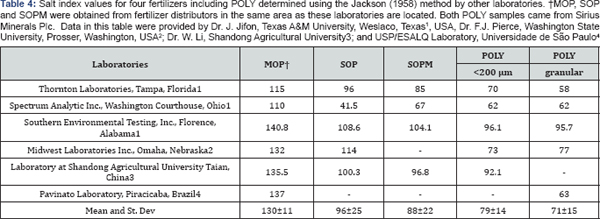
The SI value for POLY was 68.5±10.8; lower than 100 for sodium nitrate, 128±6.0 for MOP and 103±2.2 for SOP (Table 3). The SI mean values for MOP, SOP and POLY obtained in this study are like those reported in Table 4 from other sources for POLY and other potassium fertilizers. However, a SI for SOPM of 49.1±3.1 was determined, which is like other values reported in literature (Table 3) but much lower than the average value of 88 reported for SOPM in Table 4. In general, the SI ranking of fertilizer was MOP>SOP>SOPM>POLY with average and standard deviations of 130±11, 96±25 and 88±22 for MOP, SOP and SOPM respectively, and 79±14 and 71±15 for milled and granular POLY, respectively The variation in SI in Table 3 and the variation reported for the three replicate measurements at Sao Paulo University is much lower than the variation reported in Table 4. The major source of variation in SI values appears to be variation in laboratories. Notice the summary statistics for the three laboratories, which had fertilizers from the exact same source. The standard deviations for SI values for the three laboratories are larger than the standard deviation for all data with similar ranges. Therefore,it appears that variation in SI within laboratory is considerably fertilizer sources were used.
Solubility of polyhalite
Solubility of natural POLY determined from the "simple solubility” method showed a range solubility at 25 °C of 11.917.3g L-1 and a slightly higher solubility for calcined polyhalite with a range of 18.3-21.8gL-1 (Table 5). These values are lower than solubility values obtained in water at 0, 25 and 100 °C for 13 samples of polyhalite from the Zechstein deposit of 17.7±1.80, 26.2±1.94 and 30.6±1.27, respectively [24]. The differences may be due to the possibility that the solution did not come to equilibrium in the15-minute duration of our procedure while the SGS procedure continued until equilibrium was reached, i.e. the procedure continued until no more polyhalite could be solubilized. Both measurements show that the solubility of POLY is much lower than reported values for other K source fertilizers MOP (344gL-1) and SOP (120gL‘1) [12-13].

Solubility curves showed a non-linear response to stirring time for all fertilizers, with 85% of the MOP solubilized by a minute with the dissolution of other fertilizers ranging from 0% for SOPM to 55% for granular POLY (Figure 1). By 15 minutes of stirring, dissolution of granular POLY was like MOP, 87 and 89%, respectively, with both higher than SOP and powdered POLY, 80 and 68 %, respectively, with SOPM only 13% dissolved. By 120 minutes of stirring, the dissolution of MOP, granular and powdered POLY, and SOP were complete but only 34% of the SOPM was dissolve with very little additional dissolution of SOPM after 15 minutes of stirring. Of interest is that granular POLY dissolved more quickly than powdered POLY and slightly faster than SOP. While the standard fertilizer solubility tests in Table 4 show polyhalite to be much less soluble than the other K source fertilizers, the dissolution rate of POLY in water is like MOP and SOP when added in quantities below its solubility limit. While the solubility of SOPM is 240gL_1 [28], it dissolved very slowly and incompletely over the 120 minutes shaking time used here indicating that SOPM may have a much slower release than the other K source fertilizers tested in this study.
Although POLY has a lower solubility limit in water than other K source fertilizers, when applied at rates below its solubility limit it should provide more than enough Ca, Mg, K and S for plant growth. For example, in a field, the surface 15 cm of a soil with a bulk density of 1.2gcm-3 and an available water content of 0.1gkg-1, the amount of POLY that could be applied at a solubility of 20gL-1 would be 3600 kg ha-1 which contains about 500kgha-1 K2O. Therefore, the solubility of POLY should not affect availability of nutrients to plants because the rate of field application of POLY as a fertilizer (300-1450kgha-1 POLY) is within soluble range as reported in the solubility curves (Figure 1).
- Research Article
- Abstract
- Introduction
- Materials and Methods
- Analyses of Total Elements in Polyhalite
- Salt Index (SI)
- Water Solubility of Polyhalite
- Leaching as a Measure of Nutrient Release from Polyhalite
- Results and Discussion
- Leaching as a Measure of Nutrient Release from Polyhalite
- Conclusion
- Acknowledgement
- References
Leaching as a Measure of Nutrient Release from Polyhalite
Potassium leaching
Concentration of potassium (K) in leach ate from columns containing the Ankona/Farmton sand peaked between 240 to 840ml added for all fertilizers (Figure 2). This amount of leach ate corresponds to 1 and 3 pore volumes of water through the column. About 100% of the K in POLY applied to this soil was recovered in the first 600ml of leach ate while 56, 54, and 92% of K applied were recovered in the same amount of leach ate from columns treated with MOP, SOP and SOPM, respectively. The cumulative K leaching curves were similar for POLY and SOPM and slower but similar for MOP and SOP. A possible explanation may be the influence of the additional cations of Ca and Mg in POLY and Mg in SOPM that affected the mobility of K in this low Ca and Mg testing soil (Table 2).
The pattern of K leaching in the Norfolk loamy fine sand (Figure 2) was quite different from the Ankona/Farmton sand (Figure 2). A small peak of K concentration was observed at the 360 ml of cumulative leach ate point in the curve for all fertilizers but the concentrations in the leach ate were approximately 50% of the K concentration in the Ankona/Farmton sand. Leaching of K was higher from POLY through most of the first 14 leaching events, particularly from 840 to 1680 ml cumulative leaching amounts, and was essentially complete at 1920ml of cumulative leaching (16 leaching events). Complete leaching of K from SOPM took all 24 leaching events while only 71 and 86% of K added as MOP and SOP, respectively, were leached by 24 leaching events. The higher concentrations of K in leach ates from the untreated control (UC) columns (Figure 2) indicate that the Norfolk loamy fine sand had a higher leachable K than the Ankona/Farmton sand (Figure 2) reflecting the higher pH, higher clay content, and higher soil test K levels (Table 2). The much higher Ca and Mg soil test levels may have influenced K leaching patterns in this soil. Again, for this soil, K release and mobility from POLY was comparatively better than SOPM, MOP and SOP and did not correspond to solubility in water differences among these fertilizers.
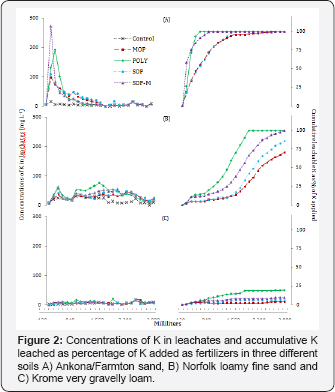
The leaching of K in the Krome very gravelly loam soil was greatly reduce compared to the other soils in this study, with none of the leaching event leach ates having K concentrations more than 20mgL-1 (Figure 2). Leaching of K from POLY was clearly higher than the other K source fertilizers. The cumulative leaching from POLY after 24 leaching events was only about 20%, with only 4,7 and 10% of K added as MOP, SOP, and SOPM, respectively leached after 24 leaching events (Figure 2), with the K leaching pattern and amounts for these fertilizers like the UC (Figure 2). The leaching pattern for POLY would indicate that K availability in calcareous soils might be better for POLY than the other K source fertilizers although this soil can retain K well compared to the other two soils.
Overall, the release of K and subsequent movement in soil as evidenced from the K leaching patterns in Figure 2 is best for POLY, intermediate for SOPM and less but similar for MOP and SOP. Barbarick [14] compared POLY with SOP to determine K, Ca, Mg and SO4 leaching curves in a loamy sand and reported that K was more promptly for leaching in SOP than in POLY Differences from the Barbarick leaching study might be because the POLY used by Barbarick contained 3.5% less K, 0.7% less Mg and 1.3% less S than the POLY used in the present study.
Calcium leaching
Some leaching of calcium (Ca) in the Ankona/Farmton sand occurred within the first few leaching events for all fertilizers and the UC but practically ceased by the third leaching event (360mm water added) for all but POLY which ceased after 600ml of water added (Figure 3A). The leaching of Ca was highest in the POLY to which 70% of the Ca was added, although some of the leached Ca came from the soil. The higher level of Ca leached in the SOPM columns during the first few events may be relating to the influence of Mg ions.
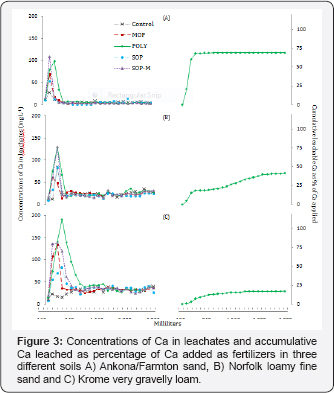
There was a similar pattern of Ca leaching in the Norfolk fine loamy sand with peak Ca concentrations in the second and third leaching event (Figure 3). However, there was a constant leaching of 20 to 25mgL-1 of Ca in the leach ate in all events beyond the first 480ml water added regardless of fertilizer added (Figure 3), higher than the 0 to 10mgL-1 of Ca in the leachate from the Ankona/Farmton sand (Figure 3). Leaching of Ca from the POLY columns continued throughout the study but only 42% of Ca added as POLY leached out after 24 leaching events (Figure 3).
In the Krome very gravelly loam, Ca leaching was like the pattern in the Norfolk fine loamy sand with a slightly extended period of leaching for POLY but a similar baseline leaching level for the two soils (Figures 3). Leaching of Ca materially ceased with the total Ca leached corresponding to about 17% of Ca added as POLY after 24 leaching events (Figure 3).
The leaching of Ca was highest in the Ankona/Farmton sand as would be expected from the coarse texture and low clay and organic matter contents, with the lowest in the Krome very gravelly loam, consistent with the leaching of K from that soil. The carbonate chemistry in this high pH soil appears to be controlling the fate of K source fertilizers although leaching of POLY was higher for both K and Ca in this soil.
Magnesium leaching
The leaching of magnesium(Mg) in the Ankona/Farmton sand occurred in the first few leaching events. It was the highest for POLY and SOPM as would be expected given the leaching patterns of K and Ca. Leaching of Mg materially ceased for SOPM after 360ml water applied and for POLY after 720 ml water applied, with about 61% of the Mg applied as POLY and 46% as SOPM leached after 24 leaching events (Figure 4).
The Norfolk fine loamy sand had higher concentrations of Mg for a longer period than the Ankona/Farmton sand for all fertilizers and the UC, with 5 to10mgL-1of Mg leached in the later events (Figure 4). Cumulatively, about 58% of Mg added as SOPM and 95% of Mg added as POLY leached after 24 events (Figure 4) but a significant portion of that could have come from the soil given the amount leached from the MOP, SOP, and the UC columns. The higher leaching of Mg from this soil relates to the high soil test Mg levels were 40 times higher than the Ankona/ Farmtons and (Table 2) and is consistent with the report by Havlin et al. [29] that applying MOP and SOP increased leaching of Mg from the soil profile.
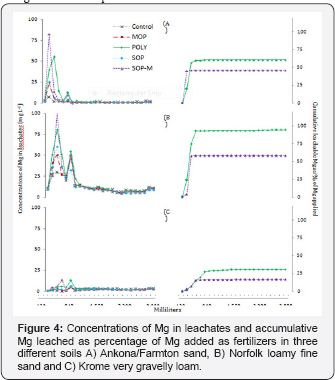
In the Krome very gravelly loam,leaching of Mg was very low, with a base of about 3mgL-1of Mg in all leachate events and some minor spikes of Mg in the leach ate of early events, <10mgL- 1of Mg for the SOPM and POLY columns (Figure 4). By the sixth event (720ml water added), about 17% of Mg added as SOPM had leached and for POLY about 31% of Mg added was leached after the 13th leaching event (1560ml water added) (Figure 4).
The leaching of Mg occurs within a few pore volumes of leaching. It was highest in the high Mg testing Norfolk fine loamy sand, and was very low in the calcareous Krome very gravelly loam soil. Therefore, the major influences on Mg leaching as evidenced from these three soils were high sand content (lack of clay), soil test Mg levels, and carbonates.
Sulfate leaching
Leaching of SO4-S was rapid and similar for the Ankona/ Farmton sand and the Norfolk fine loamy sand, with 100% of the SO4-S contained in SOP and SOPM leached within the four leaching events for both soils, respectively (Figures 5). For the Ankona/Farmton sand leaching of SO4-S ceased for POLY after 1320ml water applied and for Norfolk fine loamy sand after 1920ml water applied (Figure 5). While the Norfolk fine loamy sand had seven times higher soil test SO4-S than the Ankona/ Farmton sand, there was little leaching of SO4-S in either soil after the first three events, so it may not have been significant.
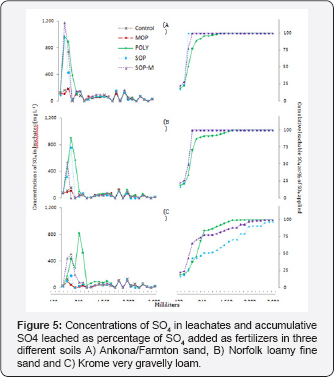
The concentrations of SO4 -S in the leachate from the Krome very gravelly loam were similar in the early events to the other two soils but the cumulative SO4-S leached was lower (Figure 5). The high soil test Ca along with the low solubility of gypsum (approximately 2-2.5g L-1) may be responsible for precipitation of gypsum and the subsequent reduction of SO4-S in soil solution and therefore the leachate. Note that Ca in the leachate was also low and this implies gypsum precipitation as a plausible explanation of low Ca and low SO4-S in the leach ate. All sulfate added as POLY, SOPM and SOP were leach out after 16, 22 and 24 leaching events respectively (Figure 5).
Leaching of SO4-S was rapid and complete in the two non- calcareous soils, and slower in the calcareous Krome very gravelly loam. The rapid leaching of SO4-S in the Ankona/ Farmton sand and the Norfolk fine loamy sand suggest that nutrient release from POLY was rapid, a conclusion supported by the leaching of K. Very little of the SO4-S from the three sulfate containing potassium fertilizers was leached in the calcareous soil consistent with the other nutrients in this soil. The leaching of SO4-S for these soils is consisted with Havlin et al. [29] who reported that sulfur is readily leached from soils dominated by monovalent cations (e.g. K) [30-35].
Comparing leaching of nutrients from polyhalite in three soils
Very clear from the leaching study is that fertilizers vary in leaching behavior and that leaching behavior is affected by soil properties, particularly texture, soil test levels, and the presence of carbonates. Leaching of K, Ca, and SO4-S in the Ankona/Farmton sand was rapid and complete but less so for Mg, and more rapid for POLY than SOPM and lowest for SOP and MOP. Leaching of nutrients from the Norfolk fine loamy sand was different from the Ankona/Farmton sand particularly for K in that the leaching of K occurred throughout the 24 leaching events and K from SOP and MOP was not complete. The pattern of leaching of Ca was similar for the two soils but more prolonged and not as complete for the Norfolk fine loamy sand. The leaching of Mg in the Norfolk fine loamy sand was enhanced by the high soil test Mg levels that were 40 times higher than the Ankona/Farmton sand. The leaching of SO4-S in both soils were similar, both rapid and complete. The leaching of all nutrients in the Krome very gravelly loam soil was different from the other two soils largely attributable to the presence of free carbonates, high soil pH, and high soil tests for K and Ca. That nutrients in POLY were often higher in concentration and in cumulative amounts in the leach ate suggest that POLY in soil will supply nutrients to plants in sufficient quantities compared to other K source fertilizers MOP, SOP, and SOPM.
- Research Article
- Abstract
- Introduction
- Materials and Methods
- Analyses of Total Elements in Polyhalite
- Salt Index (SI)
- Water Solubility of Polyhalite
- Leaching as a Measure of Nutrient Release from Polyhalite
- Results and Discussion
- Leaching as a Measure of Nutrient Release from Polyhalite
- Conclusion
- Acknowledgement
- References
Conclusion
Based on chemical analyses, POLY can be used as a multinutrient fertilizer containing more than ten nutrients which are essential for plants. Low salt index of POLY suggests that it can be applied along crop seeds with less potential for salt damage. The solubility of POLY is lower than that of MOP and SOP. However, the normal application rate of POLY is within the range of solubility. Therefore, low solubility of POLY will not affect nutrient bioavailability to plants. The leaching study indicated that K, Ca, Mg and SO4S in POLY were more readily available than those in SOP in a loamy soil as well as in a sandy soil. Therefore, the solubility should not affect nutrient bioavailability to plants.
- Research Article
- Abstract
- Introduction
- Materials and Methods
- Analyses of Total Elements in Polyhalite
- Salt Index (SI)
- Water Solubility of Polyhalite
- Leaching as a Measure of Nutrient Release from Polyhalite
- Results and Discussion
- Leaching as a Measure of Nutrient Release from Polyhalite
- Conclusion
- Acknowledgement
- References
Acknowledgement
The authors thank Dr. J. Jifon, Texas A&M University, Weslaco, Texas, USA, Dr. F.J. Pierce, Washington State University, Prosser, Washington, USA; Dr. W. Li, Shandong Agricultural University; and Dr. P. Pavinato, Universidade de Sao Paulo for providing data for Table 4; Robert Meakin, Kiran Pavuluri and Timothy D. Lewis from Sirius Minerals Plc for materials and comments on the manuscript; Guiqin Yu and Yuqing Geng, Tropical Research and Education Center, University of Florida for their technical help in the laboratory; Megan Codallo, College of Agriculture and Life Sciences, North Carolina State University, and Brian Zhong, University of Florida for reviewing the manuscript.
- Research Article
- Abstract
- Introduction
- Materials and Methods
- Analyses of Total Elements in Polyhalite
- Salt Index (SI)
- Water Solubility of Polyhalite
- Leaching as a Measure of Nutrient Release from Polyhalite
- Results and Discussion
- Leaching as a Measure of Nutrient Release from Polyhalite
- Conclusion
- Acknowledgement
- References
References
- Fraps GS (1932) Availability to plants of potash in polyhalite. Bulletin No 449. College Station, Texas Agricultural Experiment Station, Texas, USA.
- Mansfield GR, Lang WB (1929) Government potash exploration in Texas and New Mexico. (212). Am Inst Min and Met Eng Tech.
- IPNI (2010) Potassium Fertilizer, Production and Technology (Ref 1021) International Plant Nutrition Institute, USA, pp. 1 -49.
- Lazenby H (2012) Polyhalite-an almost forgotten potash source back from the brink. Engineering News.
- NASS (2014) Agricultural Prices. National Agricultural Statistics Service, USA.
- SMP-Sirius Minerals Plc (2015) Polyhalite factsheet: The future of fertilizer - Polyhalite.
- ICLF (2015) Readily available sulphur plus potassium, magnesium and calcium for better crops.
- SMP -Sirius Minerals Plc (2014) Polyhalite factsheet. Fertilizer of the future.
- Killorn R, Voss R (1986) Iowa State University. Cooperative Extension Service. Ames, Iowa Cooperative Extension Service. Iowa State University, USA.
- Mortvedt J (2001) Calculating salt index. Fluid J 9(2): 8-11.
- Rader LF, White LM, Whittaker CW (1943) The salt index: a measure of the effect of fertilizers on the concentration of the soil solution. Soil Sci 55(3): 201-218.
- IPNI (2010) Nutrient Source Specifics series. No. 3. Potassium chloride. Ref. 10063. International Plant Nutrition Institute, USA.
- IPNI (2010) Nutrient Source Specifics series. No. 5. Potassium sulfate, Ref. 10065. International Plant Nutrition Institute, USA.
- Barbarick KA (1991) Polyhalite application to Sorghum-Sudangras and leaching in soil columns. Soil Sci 151(2): 159-166.
- EPA (2012) Environmental Protection Agency, USA.
- Jackson ML (1958) Soil Chemical Analysis. 245. Englewood Cliffs, Prentice-Hall.
- Soil Survey Staff (2008) Natural Resources Conservation Service
- Nelson DW, Sommers LE (1982) Total carbon, organic carbon, and organic matter. In: Page AL, Miller RH, Keeney DR, Madison BS (Eds.), Methods of soil analysis. Amer Soc Agron, USA, pp. 539- 579.
- Polemio M, Rhoades JD (1977) Determining cation exchange capacity: A new procedure for calcareous and gypsiferous soils. Soil Sci Soc Am J 41(3): 524- 527.
- Rossum JR, Villarruz P (1961) Suggested methods for turbidimetric determination of sulfate in water J American Water Works Assoc 53(7): 873-876.
- NRCS (2013) Natural Resources Conservation Service Soils.
- NOAA (2008-2013) National Climatic Data Center (NCDC).
- Cleveland Potash (2012) Product Specification. Granular Polysulphate™. In: Black CA, Day PR (Eds.), Methods of soil analysis, Part I. Agronomy. Particle fractionation and particle-size analysis. pp. 545-567
- SGS (2014) Societe Generale de Surveillance. Main elements contain in Polyhalite and Polyhalite solubility. Arcueil Cedex, Unpublished information shared to the author of this document by Sirius Minerals, PLC, France.
- EU (2003) European Union. Regulation (EC) No. 2003/2003 of the European Parliament and of the Council relating to fertilizers.
- CEHT CF (2015) Development of Cleanup Target Levels. FAC 2005, University of Florida, Gainesville, University of Florida, USA.
- Liu G, Simonne EH, Li YC (2014) Nickel Nutrition in Plants. UF/IFAS Extension HS1191, University of Florida, Gainesville, USA.
- IPNI (2010d) Nutrient Source Specifics. Potassium Magnesium Sulfate: Langbeinite. Ref. #10066. International Plant Nutrition Institute, USA.
- Havlin JL, Beaton S, Tisdale L, Nelson WL (1999) Soil Fertility and Fertilizers. (6th edn). Upper Saddle River, Prentice Hall, New Jersey, USA.
- Berry P, Nicholson FF, Storer K, Weightman, R, Williams J, et al. (2014) Appendices to MDT Planning Statement. Ref: Q40243. ADAS. The Agronomic Case for Polyhalite. UK, pp. 1-99.
- ERS (2012) USDA ERS 2012. Data sets: U.S. fertilizer use and price.
- http://www.ers.usda.gov/data-products/fertilizer-use-and-price. aspx#26730
- IPNI (2006) Some Things to know about secondary nutrients. International Plant Nutrition Institute.
- Murray TP, Clapp JG (2004) Current fertilizer salt index tables are misleading. Communications in Soil Science and Plant Analysis 35 (1920): 2867-2873.
- Nelson DW, Sommers LE (1982) Total carbon, organic carbon, and organic matter. In: Page AL, Miller RH, Keeney DR (Eds.), 2 Methods of soil analysis. Madison, Amer Soc Agron, USA, pp. 539- 579.


