


Screening and Diversity Analysis of Drought Tolerant Genotypes in Vitro Tomato
Mallika Rani Roy, Md Rais Uddin Rashed*, Atiya Sharmin Mitu
Department of Genetics and Plant Breeding, Sher-e-Bangla Agricultural University, Bangladesh
Submission: January 30, 2017; Published: February 22, 2017
*Corresponding author: MD Rais Uddin Rashed, Department of Genetics and Plant Breeding, Sher-e-Bangla Agricultural University, Dhaka-1207, Bangladesh, Email: rurashed1987@gmail.com
How to cite this article: Roy MR, Md Rais U R, Mitu AS. Screening and Diversity Analysis of Drought Tolerant Genotypes in Vitro in Tomato. Agri Res &Tech: Open Access J. 2017; 4(2): 555632DOI:10.19080/ARTOAJ.2017.04.555632
Abstract
This experiment was carried out to screening the best genotypes among the existing tomato line and variety. Fourteen different genotypes were selected by observing their morphological growth. Seeds were inoculated in different PEG level of 0g, 20g, 40g and 60g in Petridis. Seedling was raised in controlled chamber. Shoot and root length of all fourteen genotypes were measured in different interval. BARI-2 showed the highest shoot and root growth among the other genotypes. The longest length of shoot (2.83 cm) was recorded for 0 g PEG condition, whereas the lowest length (1.88 cm) was observed in 60 g PEG. The highest weight of plant (0.43 g) was recorded for 0 g PEG, whereas the lowest weight of plant (0.36 g) was observed in 60 g PEG. Among the mean Comparison, Cluster I and IV was the largest cluster comprising of 5 genotypes followed by cluster II with 3 genotypes and cluster III belongs to only 1 genotypes of tomato.
Introduction
Tomat (solanum lycopersicum L.) is one ofthe most important and popular vegetable crop. Tomato ranks top the list of canned vegetables and next to potato and sweet potato in the world vegetable production FAO, [1]. In Bangladesh it is cultivated as winter vegetable, which occupies an area of 58,854 acres in 200910 BBS [2]. The average tomato production in Bangladesh is 5090 tons/ha [3]. Generally tomato is grown during Rabi (winter) season and it is dry and as such, the inadequate soil moisture in this season limits the use of fertilizers, and consequently results in decreased yield. Deficiency of water is now considered as one of the major constraints to successful upland crop production in Bangladesh [4].
Many researchers have reported about different genetic parameters in tomato based on few traits. As yield is the main object of a breeder, so it is important to know the relationship between various characters that have direct and indirect effect on yield.
Some germplasms were received from Plant Genetic Resource Centre (PGRC) of Bangladesh Agricultural Research Institute (Bari), Gazipur and Lal Teer Seed Company, Dhaka but information about species as well as their identifying characters was unknown in drought condition. So, it is an opportunity to categorize the germplasm morphologically under different species for future utilization in drought prone area of Bangladesh. A study was, therefore, conducted on the performance in relation to growth especially length and weight in tissue culture under grown in culture media in laboratory condition. With conceiving the above scheme in mind, the present research work has been undertaken in order to fulfilling the following objectives:
- To develop a new protocol of tissue culture to regenerate plantlets from tomato seeds
- To identify the best drought tolerant genotypes in vitro
- To identify the characters contributing to genetic diversity
- To assess the magnitude of genetic divergence in genotypes
Materials and Methods
The study was conducted at the Genetics and Plant Breeding Laboratory of Sher-e Bangla Agricultural University, Dhaka, Bangladesh to study the screening of drought tolerant genotypes in Vitro Tomato.
Tomato genotypes
Fourteen tomato genotypes were used as experimental materials among which BARI Tomato 2, BARI Tomato -11 are parent material and rest of all were lines. The materials were collected from Bangladesh Agricultural Research Institute (BARI), Gazipur. The genotypes used in the study are listed below (Table 1).

Culture media
Success of any experiment depends on the culture media, hormone combination, tissue and employing cell. Murashige and Skoog (1962) medium were used with different PEG concentration as culture medium for giving stress to the plants. The composition of MS medium has been presented in Appendix 1. PEG was added to MS media as per treatment of the experiment. For the preparation of media, stock solutions were prepared at the beginning and stored in the refrigerator at 4±1°C. The respective media were prepared from stock solutions.
Preparation of stock solutions
Preparation of in NaOH: 40 g NaOH pellets were weighed and added to the 800 ml of sterilized distilled water and stirred well until dissolved. Sterilized distilled water was added to make volume 1000ml and mixed the closed bottle.
Preparation of 70% Ethanol: In a 100 ml measuring cylinder 70 ml 99.9% ethanol was poured. Double distilled water was poured up to the level of 100 ml. Store the solution in a sterilized glass bottle. This solution was made fresh each time before use.
pH of the medium: pH of the medium was adjusted to 5.7±1 by pH meter with the addition of 1 N NaOH or 0.1 N HCl whichever was necessary
Agar: The media was gelled with 8 g/L agar and the whole mixture was gently heated on microwave oven at 250 °C Temperature for 8-10 minutes.
Sterilization
Sterilization of culture media: One litre of MS medium were divided into two 1 litre conical flasks and capped with aluminium foil. Then the conical flasks were autoclaved at 15 psi pressure at 121°C for 20 minutes. The medium was then transfer into the culture room and cooled at 24°C temperature. Aliquote fixed volume of medium into petridishes. After dispensing the petridishes were covered with thin polythene (Saran wrap) and marked with different codes with the help of a permanent glass marker to indicate specific PEG supplements. The petridishes containing media could be store at 4°C until use. Marking was done for identification.
Sterilization of seed: Seeds were treated with absolute alcohol for 1 minute. After treating, seeds were rinsed with sterilized distilled water for 2 times. Then treated with NaOCl/ CaOCl (20%) with a drop of tween-20 for 2 minutes. Then seeds were rinsed 5 times with sterilized distilled water.
Inoculation subculture
The sterilized seeds of fifteen genotypes of tomato were inoculated in a linear order on MS medium supplemented with 0, 20, 40 and 60 g/L of Poly-Ethelene Glycol (PEG). The petridishes were labeled properly. The culture environment will includes, 25oC, 60% relative humidity, and a 16-h photoperiod from white fluorescent lamps (200^mol photons/m2s-1). Root length and the weight of the plantlets were measured at different time frames. Transfer of regenerated plantlets required to transfer in a fresh medium if the nutrient media is exhausted or contamination occurs in the medium.
Analysis of genetic divergence
Genetic divergences among the genotypes studied were assessed by using Mahalanobis' D2 statistics and its auxiliary analysis. Both techniques estimate divergences among a set of genotypes on multivariate scale.
Mahalanobis' D2 statistics
First the variation among the materials were tested by Wilkin's criteria '^'.
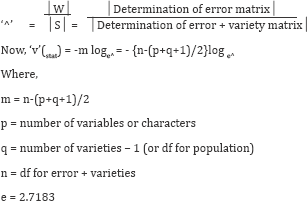
Data were then analysed for D2 statistics according to Rao (1952). Error variance and covariance matrix obtained from analysis of variance and covariance were inverted by pivotal condensation method. Using the pivotal elements the original means of the characters (X, X2---------X8) were transformed into a set of uncorrelated variables (Y, Y2---------Y8).
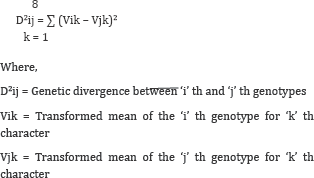
Now, the genetic divergence between two varieties/lines (suppose Vi and Vj was calculated as -
The D2 values between all varieties were arranged in order of relative distances from each other and were used for clusters formation, as suggested by Rao, 1952.
Results and Discussion
The experiment was conducted to study the screening of drought tolerant genotypes ^ in tomato. The results have been presented and discussed with the help of table and graphs and possible interpretations given under the following headings:

Shoot length: Statistically significant variation was recorded for shoot length due to PEG level of 0, 20, 40 and 60 g under the present trial (Table 2). For different Mean PEG shoot length varied from 1.88 cm to 2.83 cm. The longest length of shoot (2.83 cm) was recorded for 0 g PEG which was followed (2.38 cm) by 20 g PEG, whereas the lowest length (1.88 cm) was observed in 60 g PEG which was statistically similar (2.04 cm) with 40 g PEG. Data revealed that in the application of 0 g PEG produced comparatively the longest shoot which was generally followed by 20 g PEG. It was also found that 20 g PEG have minimum adverse effect on shoot length for the genotypes that were used in this trial. On the other hand, in 40 and 60 g PEG produced the shortest length of shoot that mean in this concentration tomato genotypes exhibit adverse effect in consideration of shoot length. Among the studied genotypes BD-7301 produced the longest shoot in 40 and 60 g PEG compared to 0 and 20 g PEG. Figure 1 & 2 showed the shoot length for 0 and 40 g PEG.


In an average among the different genotypes of tomato the highest length of shoot (5.01 cm) was recorded from BARI-2 which was followed (4.02 cm and 3.86 cm) by BD-7258 and BD- 7290. On the other hand, the lowest length of shoot (0.69 cm) was found in BARI-11 which was statistically identical (0.70 cm, 0.76 cm and 0.94 cm) with BD-7292, BD-7260 and BD-7295, respectively which was closely followed (1.18 cm) by BD-7302 (Table 2).

Relative shoots length over control: Statistically significant variation was recorded for relative shoot length due to PEG level of 20, 40 and 60 g under the present trial (Table 3). For different PEG the average relative shoot length was 0.80, 0.71 and 0.66, respectively for 20, 40 and 60 g PEG. The highest relative shoot length over control (0.80) was recorded for 20 g PEG, while the lowest relative plant weight (0.66) was observed In 60 g PEG which was closely followed (0.71) by 40 g PEG. Data revealed that with the increase of level of PEG relative shoot length decreases and for 40 and 60 g PEG the relative shoot length followed more or less similar decreasing trend. From the data of relative shoot length over control BD-7290, BD-7286, BD-7258, BD-7289, BD-7301 and BD-7762 gave the increasing trend with the increasing level of PEG. It was also found that PEG from 40 to 60 g relative shoot length showed decreasing trend that men with the increase of PEG level relative shoot length decreases for the studied genotypes. Figure 3 showed the relative shoot length of different genotypes for 40 g PEG.

In an average among the different genotypes of tomato the highest relative length of shoot over control (1.20) was recorded from BD-7301 which was followed (1.07 and 1.01) by BD-7286 and BD-7290. On the other hand, the lowest relative length of shoot (0.42) was recorded in BARI-11 which was statistically identical (0.45 and 0.46) with BD-7260 & BD-7292 and BD- 7295 & BD-7269, respectively which was closely followed (0.54) by BD-7302 (Table 3) under the present trial. Markovic et al. [5] studied genetic divergence of 25 cultivars of tomato originating from the area of the former Yugoslavia and recorded the presence of a high degree of genetic divergence in different genotypes consisting of 5 clusters. Sharma & Verma [6] reported genetic divergence of 18 genotypes of tomato and grouped them into 5 clusters irrespective of geographic divergence indicating no parallelism between genetic diversity and geographical divergence.
Plant weight: Statistically significant variation was recorded for plant weight due to PEG level of 0, 20, 40 and 60 g under the present trial. For different PEG plant weight varied from 0.036 g to 0.43 g. The highest weight of plant (0.43 g) was recorded for 0 g PEG which statistically similar (0.039 g) with 20 g PEG, whereas the lowest weight of plant (0.36 g) was observed in 60 g PEG which was statistically similar (0.037 g) with 40 g PEG. Data revealed that in the application of 0 g PEG produced comparatively the highest weight of plant which was generally followed by 20 g PEG. It was also found that 20 g PEG have minimum adverse effect on plant that produced significant weight of plant for the genotypes that were studied under this trial. On the other hand, in 40 and 60 g PEG produced the lowest weight of shoot that mean in this level of PEG tomato genotypes exhibit adverse effect in consideration of plant weigh. Among the studied genotypes BARI-2, BD-7258, BD-7301 and BD-7762 produced the highest plant weight in 40 and 60 g PEG compared to 0 and 20 g PEG.
In an average among the different genotypes of tomato the highest weight of plant (0.068 g) was recorded from BARI-2 and BD-7290 which was statistically identical (0.062 g and 0.061 g) with BD-7286 and BD-7258. On the other hand, the lowest weight of plant (0.003 g) was found in BARI-11 and BARI-7292 which was statistically identical (0.012 g) with BD-7260. Mittal et al. [7] estimated heritability and genetic advance in 27 genotypes of tomato. High heritability associated with high genetic advance was observed by them indicating the character, predominantly under the control of additive gene, could be improved through selection [8-10].
Relative plant weight over control: Statistically significant variation was recorded for relative plant weight due to PEG level of 20, 40 and 60 g under the present trial. For different PEG the average relative plant weight was 0.86, 0.92 and 0.86, respectively for 20, 40 and 60 g PEG. The highest relative plant weight over control (0.92) was recorded for 40 g PEG, while the lowest relative plant weight (0.86) was observed in 0 and 60 g PEG. Data revealed that 40 g PEG gave the average highest relative weight of plant and for 0 g PEG the relative plant weight was same for 0 and 60 g PEG. From the data of relative plant weight over control BARI-2, BD-7286, BD-7258, BD-7289, BD-7292, BD-7301 and BD-7762 gave the increasing trend with the increasing level of PEG [11-13]. In an average among the different genotypes of tomato the highest relative plant weight over control (1.81) was recorded from BD-7301 which was followed (1.38) by BD-7258. On the other hand, the lowest relative plant weight (0.41) was recorded in BD-7260 which was statistically identical (0.51) with BD-7269 under the present trial.
Genetic diversity: Mahalanobis D2 statistics was used to measure the degree of diversification among the genotypes. Using this technique, grouping of genotypes was done in four clusters where genotypes grouped together were less divergent than the ones placed in different clusters. The clusters separated by greatest statistical distance exhibited maximum divergence. Composition of different clusters with their corresponding genotypes and their source are shown in Table 2 & 4. Cluster I and IV was the largest cluster comprising of 5 genotypes followed by cluster II with 3 genotypes and cluster III belongs only 1 genotypes of tomato (Table 2 & 4).

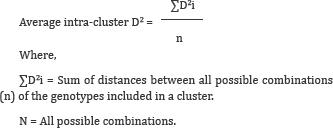
In considering of clustering mean for initial length the highest mean was 1.49 for cluster IV. In case of length highest cluster mean 6.53 was recorded in cluster III and for plant weight highest cluster 0.066 was observed in cluster III. Cluster distances denoted by the average inter and intra-cluster distances are the approximate measure of the cluster divergence (Table 3). Inter cluster distance was maximum (13.288) between clusters I and III, followed by clusters III and IV (10.744). The intra and inter cluster distance presented in Figure 4 & 5. The results revealed that genotypes chosen for hybridization from clusters with highest distances would give high heterotic F1 and broad spectrum of variability in segregating generations [14,15].


Summary and Conclusion
The longest length of shoot (2.83 cm) was recorded for 0 g PEG, whereas the lowest length (1.88 cm) was observed in 60 g PEG. In an average, among the different genotypes of tomato the highest length of shoot (5.01 cm) was recorded from BARI-2 and the lowest length of shoot (0.69 cm) in BARI-11. For different PEG the average relative shoot length was 0.80, 0.71 and 0.66, respectively for 20, 40 and 60 g PEG. Among the different genotypes of tomato the highest relative length of shoot over control (1.20) was recorded from BD-7301 and the lowest relative length of shoot (0.42) in BARI-11.
The highest weight of plant (0.43 g) was recorded for 0 g PEG, whereas the lowest weight of plant (0.36 g) was observed in 60 g PEG. Among the studied genotypes BARI-2, BD-7258, BD- 7301 and BD-7762 produced the highest plant weight in 40 and 60 g PEG compared to 0 and 20 g PEG. In an average among the different genotypes of tomato the highest weight of plant (0.068 g) was recorded from BARI-2 and BD-7290 and the lowest weight of plant (0.003 g) was found in BARI-11 and BARI-7292. The highest relative plant weight over control (0.92) was recorded for 40 g PEG, while the lowest relative plant weight (0.86) was observed in 0 and 60 g PEG. From the data of relative plant weight over control BARI-2, BD-7286, BD-7258, BD-7289, BD-7292, BD-7301 and BD-7762 gave the increasing trend with the increasing level of PEG. In an average among the different genotypes of tomato the highest relative plant weight over control (1.81) was recorded from BD-7301 and the lowest relative plant weight (0.41) was recorded in BD-7260.
Cluster I and IV was the largest cluster comprising of 5 genotypes followed by cluster II with 3 genotypes and cluster III belongs only 1 genotypes of tomato. In considering of clustering mean for initial length the highest mean was 1.49 for cluster IV. In case of length highest cluster mean 6.53 was recorded in cluster III and for plant weight highest cluster 0.066 was observed in cluster III.
References
- FAO (2010) Production Year Book. Food and Agricultural Organizations of the United Nations, Rome, Italy 68: 113-115.
- BBS (2010) Year Book of Agricultural Statistics of Bangladesh. Bangladesh Bureau of Statistics, Planning Division, Ministry of Planning, Govt of the Peoples Republic of Bangladesh, Dhaka, Bangladesh, p. 163.
- Bari (2010) Krishi Projukti Hatboi, Bangladesh Agricultural Research Institute, Joydevpur, Bangladesh, p. 304.
- Islam JK, Noor SP (1982) Deficiency of soil nutrient is now considered as one of the major constraints to successful upland crop production in Bangladesh. Pakistan J Sci Res 34(3-4): 113-119.
- Markovic Z, Zdravkovic J, Mijatovic M, Danjanovic M, Paroussi G, et al. (2002) Breeding potential of local tomato populations for beta- carotene and vitamin C. Acta-Hort 579: 157-161.
- Sharma KC, Verma S (2001) Analysis of genetic divergence in tomato. Annals Agric Res 22(1): 71-73.
- Mittal P, Prakash S, Singh AK (1996) Variability studies in tomato Lycopersicum esculentum Mill.) under sub-humid condition of Himachal pradesh. South Indian Hort 44: 132-148.
- Aditya TL, Rahman L, Alam MS, Ghoseh AK (1997) Correlation and path co-efficient analysis in tomato. Bangladesh J Agril Sci 26(1): 119-122.
- Bose TK, Som MG (1990) Vegetable crops in India. Naya Prakash, Calcutta-Six, India, pp. 687-691.
- Chowdhury D, Sharma KC (2002) Studies on variability, heritability, genetic advance and correlation in ridge gourd (Luffa acutangula Roxb.). Hort J 15(3): 53-58.
- Cuortero J, Fernandez R (1999) Tomato and salinity. Scientia Hort 78(1-4): 83-84.
- FAO (1997) Production Year Book. Food and Agricultural Organizations of the United Nations, Rome, Italy 51: 125-127.
- Patil AA (1984) Studies on correlation, path analysis, genetic divergence, Heterosis and combining ability in ten parent diallel cross of tomato Lycopersicum esculentum Mill.). Univ Agric Sci, Dharwad, India.
- Salunkhe FC, Marui K, Nakano Y (1987) Origin of the genus Lycopersicon Workshop papers Agricultural Economics and Social Sciences Programme. BARC, Dhaka, Bangladesh, pp. 4.
- Shashikanth, Basavaraj N, Hosamani RM, Patil BC (2010) Genetic variability in tomato (Solanum Iycopersicon [Mill].Wettsd.). Karnataka J Agric Sci 23(3): 536-537.


