Comparison of Transcriptomes and Sporulation of Two Clostridium botulinum A1 Strains
Virginia Ng and Wei-Jen Lin*
Biological Sciences Department, California State Polytechnic University, USA
Submission: March 20, 2018;Published: November 16, 2018
*Corresponding author: Wei-Jen Lin, Biological Sciences Department, California State Polytechnic University, 3801 W. Temple Ave. Pomona, CA 91768, USA
How to cite this article: Virginia N, Wei-Jen L. Comparison of Transcriptomes and Sporulation of Two Clostridium botulinum A1 Strains. Adv Biotech & Micro. 2018; 11(5): 555822. DOI:10.19080/AIBM.2018.11.555822
Abstract
Clostridium botulinum subtype A1 strains are one of the major causes of human botulism. Two of the genome-sequenced subtype A1 strains, Hall A and ATCC 3502, exhibit unique phenotypes in sporulation and botulinum neurotoxin (BoNT) production. Hall A, a hyper toxin producer used in BoNT/A production for medicinal and research purposes, is known to be deficient in sporulation, while ATCC 3502 is a laboratory strain capable of forming spores and producing a modest level of BoNT. Microarray-based transcriptomes were compared between these strains to identify key molecules contributing to these different phenotypes. Expression analysis showed that Hall A strain exhibited an increased expression level of the toxin cluster genes, which correlates to its hyper toxin production. Hall A also displayed a lower expression level of the sporulation initiation master regulator, Spo0A, and the forespore-specific Sigma F and Sigma G, which correlates to its poor sporulation phenotypes. In addition, Hall A showed a lowered expression level of CBO1120, a histidine sensor kinase that has been shown to activate sporulation by phosphorylating Spo0A. Further analysis of the sequences of CBO1120 showed an A to G base substitution at nucleotide position 661 resulting in a mutation of E221K. The differential expression of spo0A and CBO1120, as well as the critical point mutation identified in CBO1120, may imply that spo0A is not only poorly expressed in Hall A, its phosphorylation activation by the sensor histidine kinase may also be impaired. Overall, our genomic sequence and microarray analyses have brought insights into the genetic and physiological differences between the two C. botulinum Type A1 strains. The results may lead to further understanding of the sporulation process in C. botulinu
Keywords: Clostridium botulinum; Microarray; Transcriptome; Sporulation; Neurotoxin
Introduction
Clostridium botulinum is a Gram positive, anaerobic bacterium with the ability to produce spores as well as Botulinum Neurotoxin (BoNT). Based on antigenicity and sequence similarities, BoNTs are grouped into seven serotypes (A - G) and several subtypes (e.g. A1 -A5). Most C. botulinum strains produce only one type of BoNTs; however, some strains may harbor a silent bont gene or are bivalent or, very rarely, trivalent [1]. Among the serotypes, only serotypes A, B, E, and F are known to cause botulism in humans. Studies of C. botulinum strains have been advanced by the availability of the genomic sequences and the gene annotation data. Phylogenetic analyses based on either 16S rRNA or COG both agree that the C. botulinum strains are diverse and may not coincide with the phylogeny of toxin types [2,3]. Analysis of the neurotoxin gene clusters revealed two major classes of bont clusters, orfX+ and HA+ clusters. The orfX+ clusters, correlating to the formation of a 300kDa neurotoxin complex of the 150kDa BoNT and the Non-Toxic Non-Hemagglutinin protein (NTNH), are found in strains of A1-A4, E and F; while HA+ clusters, correlating to the production of 300-900 kDa neurotoxin complex of various sizes of Hemagglutinins (HAs) and one molecule each of NTNH and BoNT, are found in A1, A5, B, C, D, and G serotypes/subtypes [4].
Interestingly, the bont/A1 is the only gene that is found in both HA+ and orfX+ clusters. It is hypothesized that the existence of bont/A1 gene on HA+ or orfX+ clusters was due to a recombination event [5-7]. The HA+ A1 cluster, consisting of ha17, ha70, ha33, botR, ntnh, and bont/A, is located around 900 kb position on the chromosome near the oppA/brnQ operon [4,8]. The orfX+ A1 cluster is found 48 kb upstream from the HA+ (B) cluster near the arsC operon in the A1(B) strain, NCTC 2916 [4]. Further analysis of the genomes of A1 subtypes showed a very similar genomic structure whereby the three assembled A1 genomes, ATCC 3502, Hall A, and ATCC 19397, as well as the partially assembled genome of an A1(B) subtype, NCTC 2916, shared over 90% core genes [3].
The synteny dot plot analyses also showed a close relationship of these A1 strains to all sequenced strains within the proteolytic Group I C. botulinum strains as well as C. sporogenes strain ATCC 15579 [3]. It has also been shown that the level of the neurotoxin production varied with strains as well as growth media [9, 10]. An excess of tryptophan decreased toxin production in C. botulinum serotype E [11], while an excess of arginine suppressed toxin and protease activity in C. botulinum strains Okra B and Hall A [12]. Further analysis showed that the expression of neurotoxin gene cluster peaked at late-log to early stationary growth phase and is known to be regulated by both positive and negative regulatory elements [13]. BotR, encoded within the neurotoxin gene cluster, has shown to function as an alternative RNA polymerase sigma factor to activate the expression of the ntnh-bont and ha operons in a similar fashion as the TetR in C. tetani [14-16]. More recently, three Two-Component Systems (TCSs) were identified in subtype A1 strain Hall to positively control the transcription of the neurotoxin gene cluster, independently of BotR/A [17]. The HA+ A1 cluster was also found to be negatively regulated by a TCS, CBO0787/CBO0786, where CBO0786 was shown to bind to the promoters of ha and ntnh-bont operon [18]. A homologous TCS, CLC0842/CLC0843, was also identified in the subtype A1 strain Hall A [13]. In addition, two distinct agr quorum sensing systems were identified, among them, agr-2 seems to control neurotoxin production in C. botulinum group I strains [19].
Although the sporulation process of C. botulinum is not well understood, several recent comparative genomic studies have shed some light on how it may work in C. botulinum. Unlike Bacillus subtilis, C. botulinum lacks genes encoding for Spo0B and Spo0F, the intermediates in the phosphorelay of the initiation process of sporulation [20]. Worner et al. [20] further identified a sensor histidine kinase, CBO1120, in C. botulinum ATCC 3502 that appeared to be able to directly phosphorylate Spo0A, although three additional orphan kinases (CBO0336, CBO0340, and CBO2762) may function similarly [20]. The expression of Spo0A and four sporulation-specific sigma factors in C. botulinum ATCC 3502 was analyzed by qPCR and the results showed slightly different expression patterns than those in B. subtilis [21]. Specifically, spo0A was expressed during the exponential phase, which may initiate the concomitant transcription of sigF, sigE, and sigG at the end of the exponential phase. The expression of sigK occurred at both early and late stages of sporulation, as evident by the early termination of sporulation in a sigK mutant [21,22]. Interestingly, the sigF, sigE, and sigG mutants appeared to impair spo0A expression, indicating the role of these sigma factors in early sporulation [23].
In addition, Dahlsten et al. [24] suggested that SigK may play an additional role in stress responses to cold and hyperosmotic conditions in C. botulinum ATCC 3502. A quorum sensing network identified as the accessory gene regulatory (agr) system is known to play a vital part in the virulence of methicillin-resistant Staphylococcus aureus [25]. Homologs to this agr system have been found in genomes of various Clostridium spp. In C. difficile, the agr genes have been shown to contribute to virulence [26]. In Group I C. botulinum and C. sporogenes, two agrBD loci were found, where agr-1 may control sporulation and agr-2 may mediate neurotoxin production [19]. To further characterize the sporulation process of C. botulinum, the global gene expression profiles (i.e. transcriptomes) were compared between two subtype A1 strains known to show unique phenotypes in sporulation and toxin production level. C. botulinum Hall A, a hyper toxin producer used in BoNT/A production for medicinal and research purposes, is known to be deficient in sporulation. While ATCC 3502 is a laboratory strain with the capability to form spores and produce a modest level of BoNT. The aim of this study was to compare the transcriptomes between the two strains, ATCC 3502 and Hall A, in searching for distinctive expression patterns of molecules that may correlate to the sporulation and level of neurotoxin production. The results may lead to further understanding of sporulation in C. botulinum.
Materials and Methods
Bacterial strains and media
Clostridium botulinum strains, ATCC 3502, Hall A (aka Hyper Hall), and NCTC 2916 were grown in Cooked Meat Medium (CMM) for the bacterial stock and TPGY medium (5% Trypticase peptone, 0.5% Bacto peptone, 0.4% glucose, 2% yeast extract) for growth studies. Growth was performed at 37 °C in Hungate anaerobic tubes (Bellco Glass, Vineland, NJ). All procedures involving C. botulinum were performed using Biosafety Level 2 practices in a laboratory registered with the CDC Select Agent Program.
Cell collection and RNA purification
Bacterial growth was monitored for 120 hours with at least triplicate samples for the growth study. At least three independent studies were performed. Specifically, an overnight culture was inoculated to fresh TPGY tubes at a concentration that will yield a 0.03 optical density (OD at 600 nm) value. The tubes were incubated at 37 °C and the growth was monitored by OD at 600 nm for up to 120 hours. RNA was extracted from cells collected at 4, 6, and 8 hours after inoculation to represent the mid-log, late-log, and early-stationary phases of growth. In order to minimize RNase contamination, RNA procedures were performed with caution and used reagents of RNase-free and/or the highest grade possible, as well as RNase Away Reagent (Fisher, Pittsburgh, PA). At each time point of collection, RNA Protect Bacteria Reagent (Qiagen, Valencia, CA) was immediately added to the cell suspension at a 2:1 ratio to protect the RNA from degradation. This mixture was incubated at room temperature for 5 minutes followed by centrifugation at 6,000 rpm for 10 minutes. Cell pellets were stored at -80°C for no more than one week until RNA extraction. The RNA was extracted by the RNeasy Mini kit (Qiagen, Valencia, CA) following the manufacturer’s instructions. The concentration and quality of RNA was determined by Nanophotometer (Implen, Westlake Viallage, CA).
Transcriptome analysis using microarray
The C. botulinum Version 2 microarray slides used in this study were kindly provided by the Pathogen Functional Genomics Resource Center (PFGRC) of J. Craig Venter Institute (JCVI, Rockville, MD). The “Microbial RNA Aminoallyl Labeling for Microarrays” protocol (SOP: M007 Rev. 2; pfgrc.jcvi.org/index. php/microarray/protocols.html) was followed for synthesizing cDNA and preparing the probes with Alexa Fluor Cy 3 and Cy 5 dyes (Invitrogen, Carlsbad, CA). Except for the reverse-dye experiments for quality control, cDNAs from strain ATCC 3502 were labeled with Cy 5, while cDNAs from Hall A were labeled with Cy 3 in this study. The “Hybridization of labeled DNA and cDNA probes” protocol (SOP: M008 Rev. 2.1; pfgrc.jcvi.org/index. php /microarray/protocols.html) was used to hybridize the probes to the microarray slides. After hybridization, the washed microarray slides were scanned by GenePix® 4000B microarray scanner (Molecular Devices, Sunnyvale, CA) using GenePix® Pro 6.0 to capture the images. Scanned images (.tif) of the microarray slides were analyzed using the TM4 Suite (www.tm4.org), which encompasses four individual software tools: Spot Finder, Microarray Data Analysis System (MIDAS), Multi Experiment Viewer (MEV), and Microarray Data Manager (MADAM). Briefly, microarray spots were screened manually in Spot Finder and only the high-quality spots were exported to MIDAS where the data went through rigorous normalization and calibration steps such as the “LocFit Normalization (LOWESS)”, “Standard Deviation Regularization”, and “In-Slide Replicates Analysis” to avoid variations due to dye labeling bias, spot location bias, and slide-toslide variations. At least two independent microarray data were analyzed for each time point.
Sporulation study
Bacterial cells were collected at designated time points for sporulation observation. Smears of the culture were prepared, heat fixed, and stained for the presence of spores by malachite green using the Schaeffer-Fulton staining method [27]. Images of stains were obtained using the Leica LAS EZ microscope (Buffalo Grove, IL). The presence of spores was also studied by examining the viability of bacterial culture after heat shock at 80 °C for 5 minutes.
Sequence analysis
The sequences and the annotated file of individual genes were retrieved from GenBank NC_009495 for C. botulinum ATCC 3502 and NC_009698 for Hall A (aka: Hall A-hyper). T-Coffee was used for multiple sequence alignment of the sporulation- and toxinrelated genes. Notably, the FASTA sequence of CBO1120 was acquired for ATCC 3502 as well as the homologous sequence of Hall A. To align, these FASTA sequences were transferred to the T-Coffee Server found at.
Results
Growth curves vary slightly between strains
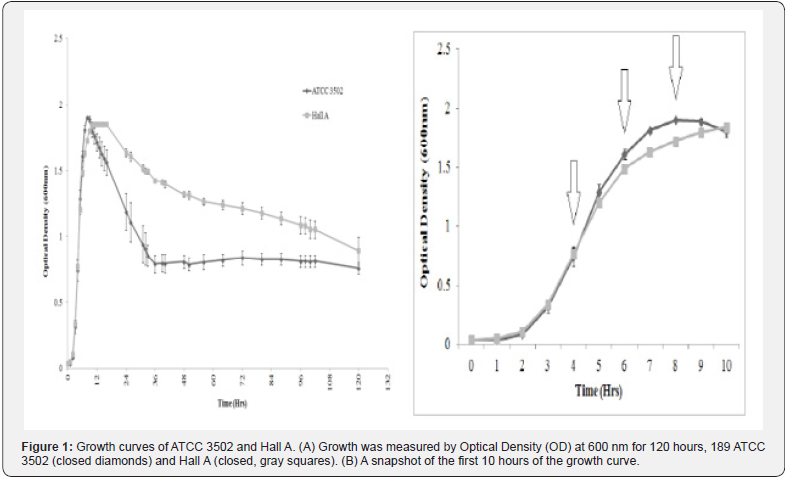
The growth was compared between C. botulinum strains ATCC 3502 and Hall A. Both bacteria strains grew similarly in TPGY medium. Growth started to show about 2-3 hours after inoculation and reached stationary phase around 7-9 hours (Figure 1A). Hall A sustained stationary phase for a longer period of time and started to show lysis after 20 hours, while ATCC 3502 started lysis immediately after reaching its peak at 9-10 hours (Figure 1A). Similar growth curves were observed from two additional independent studies (data not shown). Based on this result, total RNA was extracted from cultures grown for 4, 6, and 8 hours to represent the mid-log, late-log, and early stationary phases of growth, respectively (Figure 1B).
Transcriptome analysis reveals differentially expressed genes between ATCC 3502 and Hall A
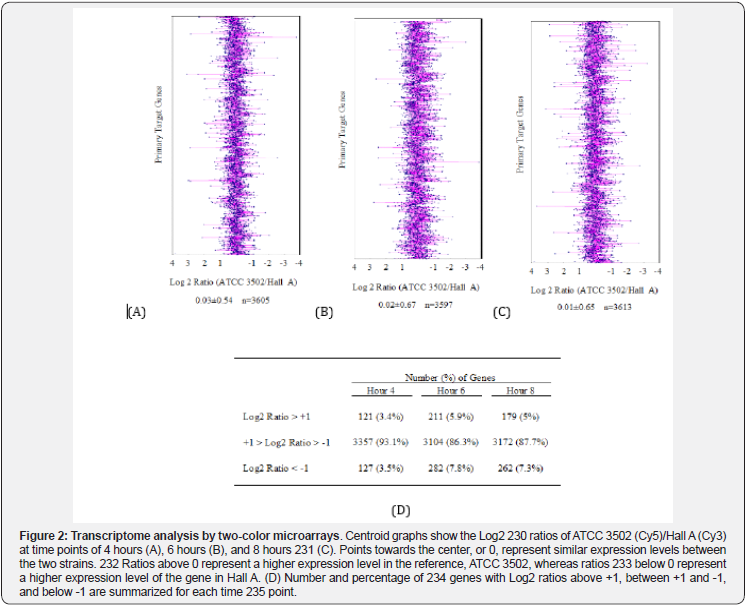
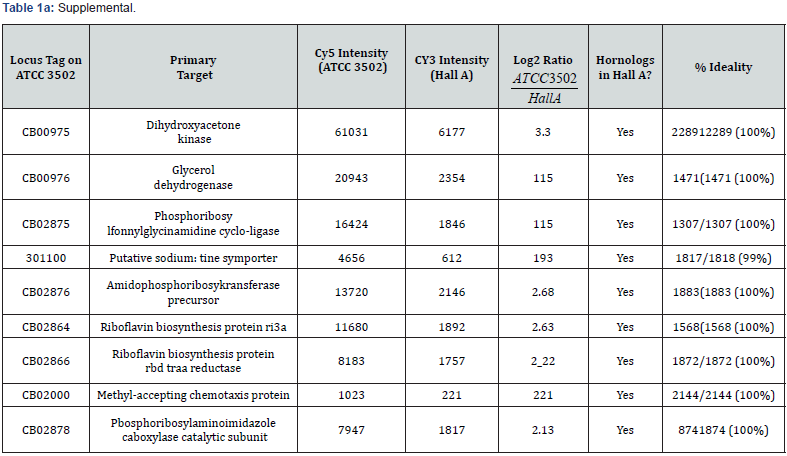
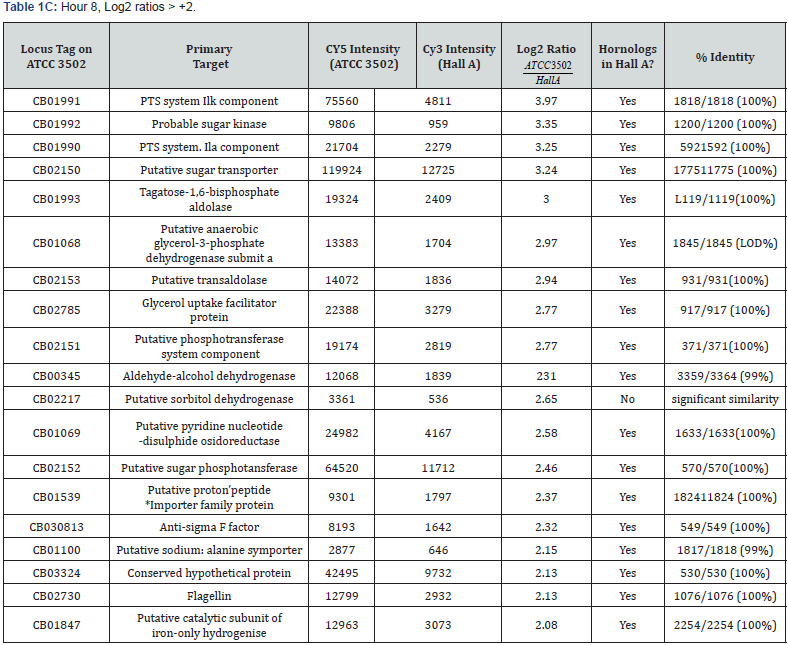
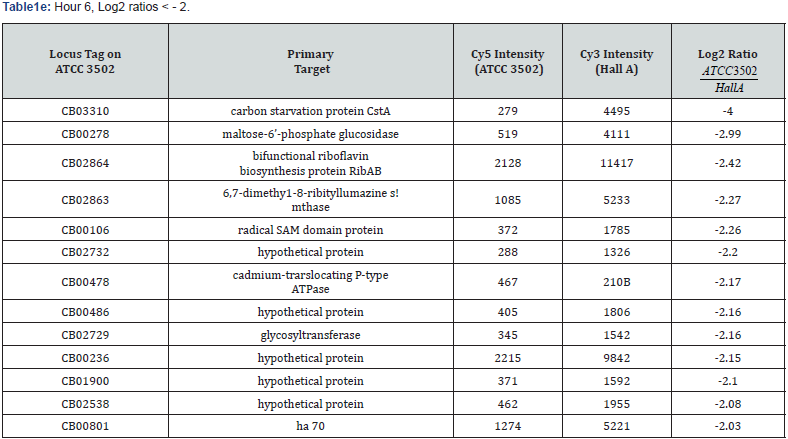
Two-color microarray analysis was used to compare the transcriptomes of C. botulinum ATCC 3502 and Hall A. The differential expressions of individual genes were presented as the Log2 ratios of Cy5/Cy3 (ATCC 3502/Hall A). The results in Figure 2 show the centroid graphs across a range of -4 and +4 of the Log2 ratios. It is clear that the majority (86.3 – 93.1%) of the genes show similar expression levels (within two-fold differences) between the two strains as demonstrated by the number of genes showing close to zero Log2 ratios in all three time points studied (Figure 1d). However, there are distinctive differential expressions of some genes among the three sampling time points where slightly more differences were observed in the latter two time points. Genes found to be above a Log2 ratio of +2 and below a Log2 ratio of -2 were identified and listed in S1 Table. The total number of genes that were expressed by more than four-fold in ATCC 3502 than Hall A (using Log2 ratios > 2) were 9, 8 and 19 for transcriptomes from 4, 6, and 8 hours of growth, respectively. While the numbers of genes that were expressed four times less in ATCC 3502 than Hall A (Log2 ratios < -2) were 5, 13 and 16 for transcriptomes from 4, 6, and 8 hours of growth, respectively. There is an increase in differentially expressed genes at hour 8, or the early-stationary phase, as compared to the other two sampling time points (Table 1a), suggesting that the two strains may be reacting differently while entering the stationary phase when the nutrient depletion and accumulation of toxic products occurred. CBO0278, a maltose- 6-phosphate glucosidase, is the only gene to be shown at all three time points to have Log2 < -2, indicating a higher expression level in Hall A over ATCC 3502. A similar behavior was seen in CBO2538, encoding for a hypothetical protein, with an exception t hour 4 where the expression level (Log2 ratio = -1.98) was only slightly above our Log2 cut-off at -2. It is worth noting that an anti-sigma F factor (CBO3088), which promotes the fore spore formation, was expressed more at hour 8 in ATCC 3502 than Hall A (Log2 ratio at 2.32; Table1c), indicating lack of CBO3088 expression in Hall A despite a gene homolog present in Hall A (3,144,309 - 3,144,731). Overall, most of the genes that were over expressed in ATCC 3502 compared to Hall A are involved in carbohydrate transportation and catabolism (1a, 1b, and 1c Tables), suggesting a need of energy and substrates for active growth and/or sporulation. Most of the genes that were under-expressed in ATCC 3502 are related to anaerobic respiration (1d, 1e, 1f Tables), suggesting a possible switch of the energy source in Hall A to deter from sporulation.



Transcriptome profiles confirm Hall A as a high toxin producer
The expression patterns of the toxin cluster genes (CBO0801 – CBO0806) were examined between ATCC 3502 and the homologs in Hall A. When graphing the individual dye intensities, ha17, ha33, ha70, ntnh, and bont show similar increasing expression trends for both strains where the expression was the highest at hour 8 (early stationary) among the three time points analyzed (Figures 3A-C, 3E, & 3F). Despite the similar expression patterns, Hall A did display slightly higher intensities at hours 6 and 8 for bont and ha genes while ntnh expression patterns were similar between the two strains (Figs. 3A-C, 3E, and 3F). The temporal expression pattern of bot/R, the gene for a positive transcriptional regulator, is different from the other toxin cluster genes in that its expression in ATCC 3502 increased only slightly in the time study as compared to Hall A (Figure 3D).
The botR in Hall A showed a slight increase at hour 8 (Figure 3D), which appears to correlate to its higher toxin expression at later time points (Figure 3F). The expression of a two-component system, CBO0786/0787, a potential negative regulatory system for the toxin cluster was also observed to confirm its regulatory influence [18]. The two-component system is located at 888,856 – 890,985 in ATCC 3502, 10,896 bp upstream of the toxin cluster (Figure 3J). Both genes showed an upwards expression trend in ATCC 3502 and a down-and-up trend for Hall A (Figs. 3G and 3H). Although the expression levels were low in both strains as expected at the time points analyzed, the steadily increased expression levels of CBO0786/0787 in ATCC 3502 may eventually contribute to the suppression of the neurotoxin expression, while the lack of the trend or delayed expression of this system in Hall A may contribute to its hyper toxin phenotype. A hierarchical cluster shows that the expression patterns of the regulatory genes, botR and CBO0786/0787, are clustered in a separate clade from the ha and ntnh-bont operons, which further confirms that it is expressed differently than the other genes (Figure 3I). The majority of expression patterns show green heat maps throughout the time points for all toxin cluster genes (Figure 3I), which is not surprising since Hall A is known to be a hyper toxin producer than most other serotype A strains. The most distinctive green colored heat maps are found for genes in the ha operon (ha33, ha17, ha70), especially ha33 and ha70 around hour 6 during the late-log growth phase, indicating a much higher level of expression was occurring in Hall A. Overall, our microarray analysis of the transcriptomes not only provides the molecular evidence to support the hyper toxicity phenotype of Hall A [28]. It also provides further insights of gene regulation of the neurotoxin gene cluster between the two subtype A1 strains.
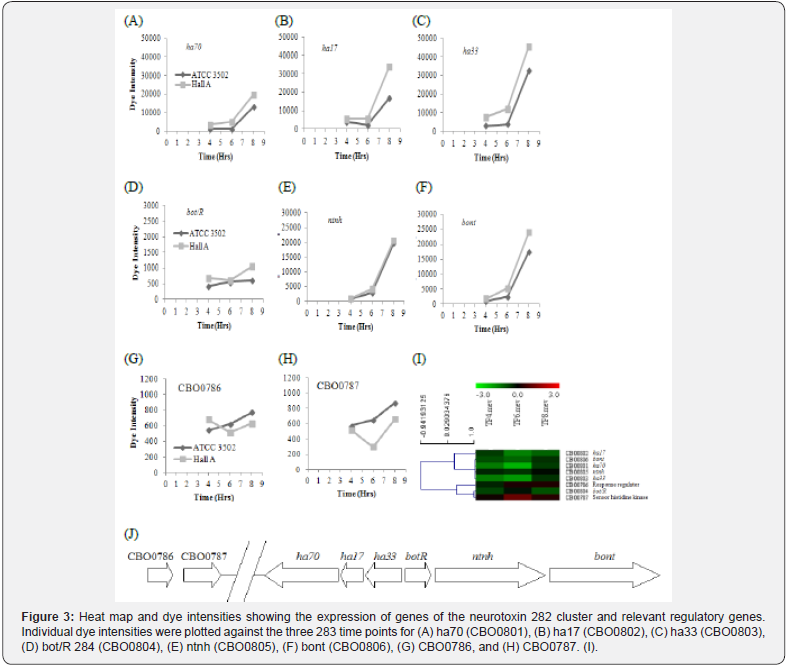
Additionally, real-time RT-PCR was used to confirm the expression patterns of bont, and the results showed comparable trends to that of the microarray data (data not shown). Heat map and clustering view of gene expression based on Log2 ratios. Heat maps in red color indicate higher levels of expression in ATCC 3502 (Cy5), whereas the green indicates more expression in Hall A. Heat maps in black color represent genes that were equally expressed in both strains. Heat map was constructed using complete linkage of Pearson Correlation using MeV of the TM4 Suite Software. (J) A representation of the neurotoxin gene cluster shows arrangement of selected genes studied.
Sporulation genes are more expressed in ATCC 3502 than Hall A
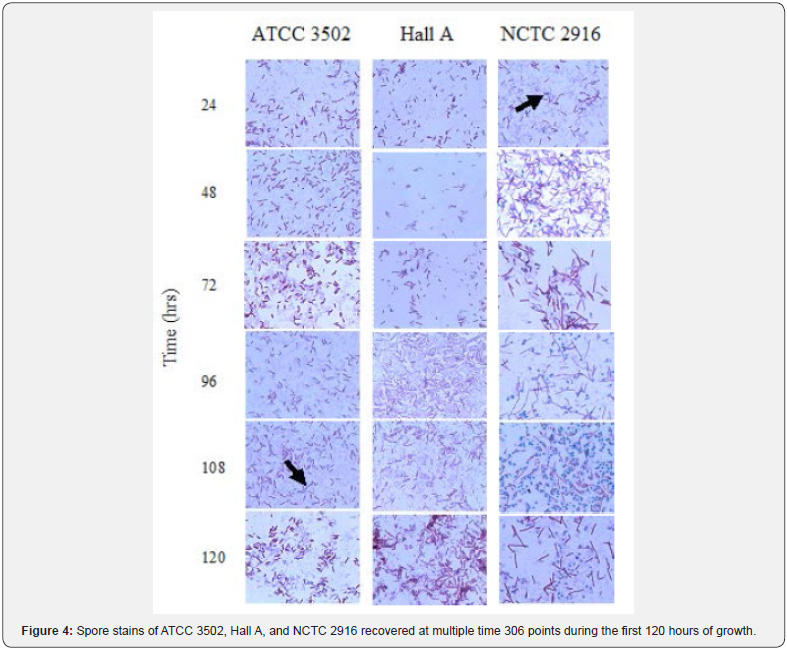
C. botulinum strain Hall A is known for its low or lack of sporulation. Sporulation patterns were compared among strains ATCC 3502, Hall A, and NCTC 2916 during a 120-hour period (Figure 4). NCTC 2916 was added as a control for fast sporulation. Based on spore staining and microscopy, spores can be found in NCTC 2916 as early as 24 hours, as opposed to 108 hours in ATCC 3502. No spore production was observed in Hall A through the 120 hours analyzed (Figure 4). To further confirm if spores are absent in Hall A, cultures grown in TPGY broth for various time courses were sampled and heat shocked at 80 °C for 5 minutes, followed by a viability check. Hall A culture did not survive the heat shock even after 19 days of growth in TPGY, while NCTC 2916 and ATCC 3502 culture survived heat shock after 0 and 24 hours of growth, respectively (data not shown). Strain NCTC 2916 survived the heat shock at 0 hour obviously owing to the spores in the inoculum carried over from the overnight culture. Vegetative cells stained red-pink, whereas spores stain green. Arrows indicate the first appearance of spores in the respective strains.
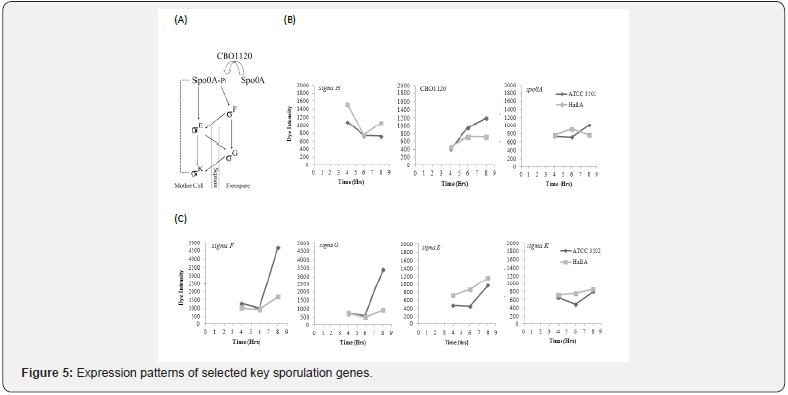
To further compare the differential sporulation processes in these two strains, the expression patterns for genes coding for the key regulatory molecules in the sigma cascade of sporulation, including Spo0A, Sigma H, Sigma E, Sigma F, Sigma G, Sigma K, and a sensor histidine kinase (CBO1120), were plotted and analyzed in order to understand their pathway trends (Figure 5). As a guide, the sigma cascade was plotted based on the Bacillis system [29] and studies in C. botulinum [20, 22] (Figure 5A). Expression of sigma H was high for both strains at the early growth stage and decreases as incubation time increases (Figure 5B), suggesting its role in vegetative growth and the stimulation of spo0A during the earlier growth stages. However, expressions of sigma H in Hall A were down and then back up at hour 8, which may imply a transition back to the vegetative growth.
As shown in Figure 5B, spo0A expression was low in all three time points in Hall A but increased during late log phase in ATCC 3502. The lack of spo0A expression in Hall A may explain the sporulation deficiency observed in this strain. Sigma F and G, responsible for regulating genes important in forespore formation, exhibited increases in expressions during late log phase in ATCC 3502, but not in Hall A (Figure 5C). Interestingly, the expression of the mother cell-specific sigma factor, sigma E, was not impaired in Hall A and showed a similarly increasing trend as in ATCC 3502 (Figure 5C). Sigma K, a transcriptional regulator involved in spore maturation, displayed a low expression level in both ATCC 3502 and Hall A as expected for the time points analyzed (Figure 5C). Despite of the low expression level, the down-and-up trend of expression of sigma K in ATCC 3502 was also observed in a separate transcriptomes analysis where 7 time points from hours 3 to 11 were examined (unpublished data).
The expression levels were also analyzed for the putative sensor histidine kinase, CBO1120, which exhibited phosphorylating capabilities towards Spo0A [20]. Although signals are relatively lower compared to those aforementioned sigma-related genes, there is a higher dye intensity for strain ATCC 3502 than Hall A at hour 8 (Figure 5B). The differential expression of spo0A and CBO1120 in these two strains may imply that spo0A is not only poorly expressed in Hall A, its phosphorylation activation by the sensor histidine kinase may also be reduced as compared to the expression level in ATCC 3502 (Figure 5B). When aligning the sequences of spo0A and cbo1120 from ATCC 3502 to the homologs in Hall A, a 100% and 99% identity, respectively, was observed (data not shown). A single A to G nucleotide substitution at position 661 of cbo1120 was found when compared to its homolog, clc1171 in Hall A resulting in a
glutamic acid to lysine substitution at amino acid position 221 (Figure 6). Interestingly, the amino acid difference falls right in the critical dimer interface and is only 7 amino acids away from the histidine phosphorylation site (Figure 6). Cooksley et al. [19] has identified two putative agr quorum sensing systems in C. botulinum ATCC 3502 and demonstrated their roles in regulating sporulation and neurotoxin formation. To examine if these agr systems are differentially expressed in the two strains studied, genes of the two putative agr systems were analyzed (S1 Figure). The expression patterns of the two agr regions in the two C. botulinum show similar flat and low expression trends during the three time points sampled, except for CBO0331 and CBO0338 (agrB-2) where the expressions were high at hour 4 and low at hours 6 and 8 (S1 Figure).

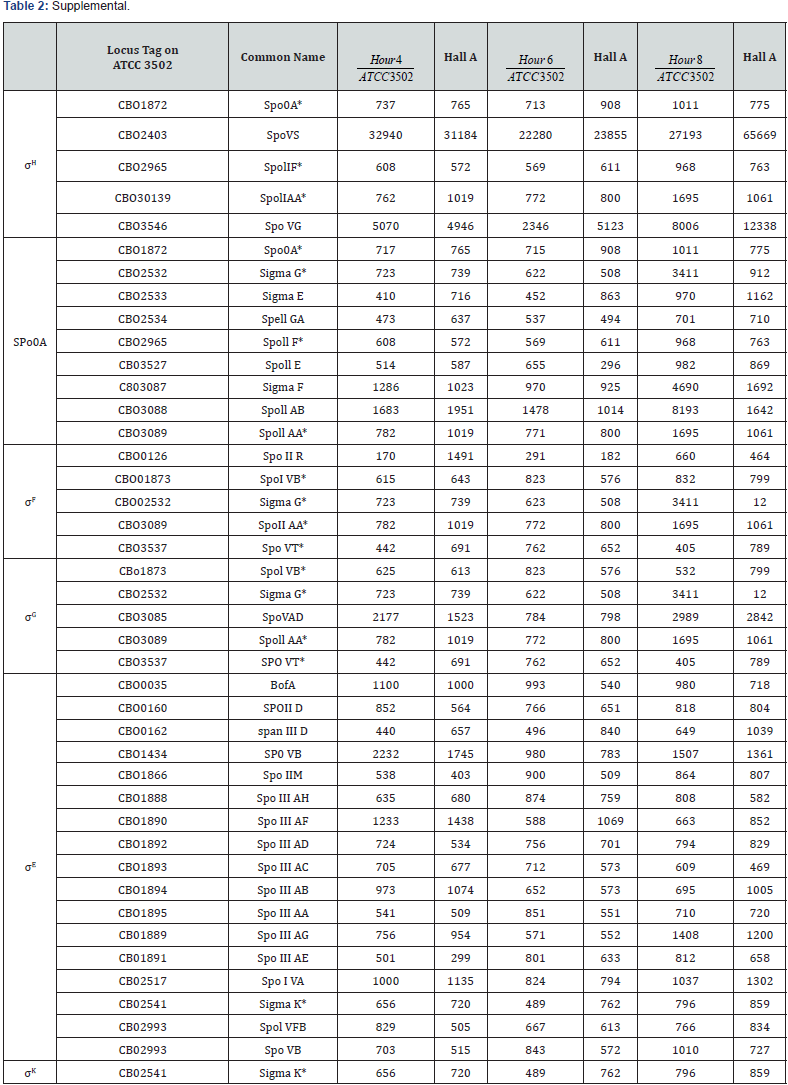
To further characterize the sporulation process, the transcriptome data of ATCC 3502 and Hall A was analyzed by pulling most of the sporulation related genes based on the annotated files from NCBI for ATCC 3502 (NC_009495) and Hall A (NC_009698). The genes were then sorted by the regulons based on the Bacillus system defined in SubtiWiki (http://subtiwiki.unigoettingen. de). The dye intensities for both strains at each time point are included (Table 2).
None of these genes showed an extreme differential expression. The majority of regulons showed similar dye intensities for both strains (Table 2), with the exception of a few genes which are highlighted in red and green to represent those with Log2 ratios higher than +1 and lower than -1, respectively (Table 2). Among the 32 genes analyzed, only five genes showed more than two-fold differential expressions. Four out of these five genes showed their differential expressions at hour 8 when the sporulation may be initiated in ATCC 3502. Among the four genes, only spoVS, an early gene induced by σH, showed a 2.4-fold higher expression level in Hall A; while three genes in the Spo0A regulon, sigG (CBO2532), sigF (CBO3087), and spoIIAB (CBO3088), showed higher expression levels in ATCC 3502, implicating a weakened or lack of activated Spo0A in the latter strain. Overall, based on the transcriptome analysis of ATCC 3502 and Hall A at mid-log, late-log, and early stationary growth phases, the differential expression occurred early in the initiation process as evident by the weak expression of spo0A and some genes in the Spo0A regulons in Hall A.
Discussion
Phenotypic variations were observed among the closely related C. botulinum subtype A1 strains, despite their similarity in genomic structure and gene functions [3,8]. Comparative genomic analysis of the assembled A1 genomes of C. botulinum ATCC 3502, ATCC 19397, and Hall A showed strong genomic alignments and a shared core of over 90% of their genes [3]. To further correlate the functions to their genomic contents, we compared the transcriptomes of two selected C. botulinum subtype A1 strains, ATCC 3502 and Hall A, with distinctive phenotypes in sporulation and neurotoxin production. C. botulinum ATCC 3502, the first C. botulinum genome being sequenced, produces modest levels of neurotoxin and endospores under normal laboratory conditions. Interestingly, the hyper toxin-producing strain Hall A, used in the commercial production of A1 neurotoxin for medicinal and research purposes, is known to be weak or lack in sporulation [28]. Our comparative analyses showed similar growth patterns (Figure 1) and transcriptomes (Figure 2) between ATCC 3502 and Hall A. The majority of the genes are expressed similarly with 93% of the genes falling within Log2 of +1 during the mid-log growth phase and dropping to approximately 86% for late log and early stationary phase (Figure 2).
In this study, we verified that Hall A lacks the capability to form spores in our culturing condition even with extended incubation time, as evident by the absence of spores by microscopic spore staining (Figure 4; 120 hours) and inability to survive heat shock after 19 days. Not much is known of whether the hyper toxicity and lack of sporulation in Hall A strain are related or independent events. In Bacillus subtilis, the environmental cues are received and transmitted through a two-component system using multiple sensor kinases (KinA-E) that will auto phosphorylate on a conserved histidine residue. A phosphorelay will take place by passing the phosphate group sequentially to Spo0F, Spo0B, and finally the aspartate residue of Spo0A, the master regulator that turns on sporulation [29]. In B. subtilis, a promoter upstream of Spo0A is expressed at relatively low levels during mid exponential phase, under the control of σA-RNA polymerase [30- 34]. Upon exiting the exponential phase, the expression of σH and phosphorylation of Spo0A, which is driven by KinA, controls a downstream promoter that sustains high levels of Spo0A and subsequently, sporulation [35]. The phosphorelay of Spo0A
In Clostridium is still unknown since Spo0F and Spo0B are absent from C. botulinum [20]. There are three proposed possibilities of Spo0A phosphorylation in C. botulinum, which include the existence of a different yet unknown phosphorelay system, direct phosphorylation by acetyl- or butyryl-phosphate, or direct phosphorylation by sensor kinases [36]. Similar sensor histidine kinases were identified in C. botulinum. Among them, CBO1120 is the only one out of the 35 sensor histidine kinases in ATCC 3502 that is capable of phosphorylating Spo0A [20]. In our study, we found a higher level of expression of CBO1120 sensor kinase at hour 8 in ATCC 3502, but not in Hall A. When comparing the sequences of CBO1120 from ATCC 3502 with the homolog in Hall A, a G to A transitional mutation was found at nucleotide position 661 resulting in an amino acid substitution from glutamic acid to lysine, i.e. E221K (Figure 6). Interestingly, this substitution is located within the conserved dimer interface polypeptide binding motif of sensor kinases and is only seven amino acids away from the histidine phosphorylation site (H228). Further studies will be needed to determine if E221K modification has altered the subsequent phosphorylation of Spo0A. Interestingly, CBO1120 is closely related to orphan sensor histidine kinases, which are part of the two-component system. Three such orphan kinases, CBO0336, CBO0340, and CBO2762, have been identified in ATCC 3502. Our expression analysis showed that these three kinases were expressed at very low levels in both ATCC 3502 and Hall A during the time points we studied (S1 Figure and unpublished data). Further studies to measure CBO1120 kinase activity and its subsequent Spo0A phosphorylation and spore morphological changes in the two strains will be required to understand whether they may play a role in the triggering of sporulation in C. botulinum.
In Bacillus subtilis, the sigma cascade is triggered after the initiation of sporulation by phosphorylated Spo0A, starting with the activation of SigF which then activates SigE via SpoIIGA and SpoIIR. SigE will use SpoIIIA to activate SigG, which will finally activate SigK through SpoIVFB [29]. From our data, SigF and SigG, which are needed for subsequent forespore-specific sporulation processes, are highly expressed at hour 8 in ATCC 3502 but were severely lowered in Hall A (Figure 5C). This further demonstrated the absence or severely lowered expressions of forespore specific regulatory network in Hall A. On the other hand, the early mother cell specific regulator, SigE, was expressed at lowered levels but with an increasing trend in both strains (Figure 5C), suggesting that the forespore, but not the mother cell, regulatory network may have been compromised in Hall A strain resulting in its poor sporulation phenotype. Based on the Bacillus model, we believe the poor expression of Spo0A may have contributed to the lowered SigF and SigG expressions in Hall A at hour 8 and the SigE may be triggered by a small amount of SigF produced or an alternative regulatory pathway in Hall A. The sigma cascade of C. botulinum is not well-understood; however, it is probably different slightly from the system found in B. subtilis.
Recent studies have shown that these sporulation-specific sigma factors may have a role in early sporulation process in C. botulinum as demonstrated by the disrupted expression of Spo0A in the SigF, SigE, or SigG knockout mutants [23] and a biphasic expression of SigK in early and late growth phases [21,22]. Our data support the biphasic expression of SigK in ATCC 3502 (Figure 5C and unpublished data), but not in Hall A (Figure 5C). It is not clear whether the lack of the biphasic sigK expression in Hall contributed to its sporulation problem. We also observed severely lowered expressions of spo0A, sigF, and sigG in Hall A (Figures. 5B and 5C). Kirk et al [23] has shown that knockout of SigF or SigE prevents the formation of endospores, while SigG mutants did form spores but without a coat [23]. Studies on spoIIID knockout in C. botulinum type B has an impact on earlier genes like Spo0A and SigF, further confirming that sporulation differs between C. botulinum strains and B. subtilis [37]. The lack of spores in Hall A suggests that the sporulation was interrupted at a muchearlier stage than the SigG (Figure 4). Further studies using knockout and/or over-expression 26 mutants, as well as electron microscopy, may be required to figure out the molecular mechanisms of sporulation deficiency in Hall A.
Our transcriptome analysis confirmed the temporal expression of genes in the HA+ toxin cluster of the two subtype A1 strains studied where these genes started to express at mid- to late-log growth phase (Figure 3) [9,10,17]. When comparing the two A1 strains, the expressions were slightly higher in Hall A as compared to ATCC 3502 (Figure 3), which may only partially account for the hyper toxin yield in Hall A (~3-10 folds). Comparable toxin yields, as determined by ELISA, were also observed between Hall A and a laboratory strain, 62A [9]. The results in both TPGY and TPM media showed only slightly higher toxin yields in Hall A during the first 24 hours. The hyper yield in Hall A (~ 3-fold higher) appeared to occur much later in growth (after 48 hours) and only in TPM medium [9]. Our microarray-based transcriptome analysis was limited to early growth stages where high quality RNAs could be obtained. Furthermore, the hyper toxicity in Hall A could be resulted from post-translation modifications in aged culture (after 48 hours) where the single chain inactive neurotoxin is nicked to the active di-chain form [9,10]. Despite that, we were able to compare the neurotoxin expression patterns during the early growth of the two A1 strains.
Our analysis of BotR, a positive regulator of the bi- and tricistronic bont and ha operons, shows an expression pattern distinctively different from the rest of the genes in the toxin cluster (Figure 3B), which supports the fact that BotR expression is regulated under its own element [38]. Interestingly, Hall A strain did show a higher BotR expression level than ATCC 3502, supporting its positive regulatory role leading to the elevated expressions of BoNT and HA genes in Hall A (Figures 3A-F). More recently, Zhang et al. [18] identified a two-component regulatory system, CBO0787/0786, which is located ~11 kb upstream of the HA+ toxin cluster and appears to bind directly to the promoters and repress the expression of the ntnh-botA and ha operons [18]. In our study, CBO0786 and CBO0787 showed a steady increase in their expressions in ATCC 3502, but not Hall A, during the time points analyzed (Figures 3G&3H) [18]. The cbo0787 or cbo0786 mutants have shown to cause up to a 10-fold increase of the neurotoxin expression [18], which was much higher than what was observed in our study. We believe this two-component negative regulatory system was functioning in Hall A but was down-regulated slightly to allow only a modest increase in the expression of genes in the HA+ toxin cluster (Figures 3G and 3H).
The synchronization between neurotoxin production and sporulation has long been suspected, especially owing to the existence of the hyper toxin producer, Hall A, which lacks sporulation capability [28]. Two tandemly located agrBD loci were found in Group I C. botulinum and C. sporogenes and appear to act through quorum sensing to orchestrate the neurotoxin production or sporulation in the bacterial cells [19]. With the use of the ClosTron knockouts and anti-sense RNA, the study was able to show the correlation of agr-1 to sporulation and agr-2 to neurotoxin production. These two agr loci and their surrounding genes were analyzed, and our results show no major differential expressions between Hall A and ATCC 3502 that could clearly explain the differential phenotypes between the two A1 strains (S1 Figure). We suspect the differential expression, if any, would take place at a later growth stage where quorum sensing is active (higher cell density). There is also a hypothesis suggesting that the repression of neurotoxin production and continuation into sporulation would be the metabolic controls due to limited nutrient and energy sources [18, 28]. Our transcriptome analysis of the highly differentially expressed genes (Log2 > 2 or < -2) shows an overall trend of gene profile shift where most of the genes that were over expressed in ATCC 3502 are involved in carbohydrate transportation and catabolism and genes that were over-expressed in Hall A are related to anaerobic respiration (S1 Table). Such distinctive metabolic and energy pathway shift may be necessary for the bacteria to direct its resources to sporulation in ATCC 3502 and toxin production in Hall A.
Our transcriptome analysis of the two A1 strains provides strong evidence to show that the deficiency of sporulation in Hall A occurs early in the sporulation process, as shown by the lowered expressions of the putative signaling sensor histidine kinase, CBO1120, and the sporulation master regulator, spo0A in Hall A strain. Consequently, forespore-specific SigF and SigG were also severely impaired in Hall A. We also observed a slight increase of BotR, the positive regulator for the toxin cluster, and a slight decrease of the negative regulator, CBO0786/CBO0787, in Hall A, which may partially account for the higher toxin yield in Hall A.
Analysis of cells collected from later growth stages may be required to identify additional factors contributing to its increasing toxicity in the aged culture of Hall A. Such studies could be achieved using RNA-seq for transcriptome analysis and biochemical analysis to investigate post-translational modifications. To our knowledge, this study is the first transcriptome analysis to compare two C. botulinum subtype A1 strains with distinctive toxin production and sporulation phenotypes. Our study has shed light on the differential expression of these two strains for their global trends as well as selected individual key molecules, which will lead to further studies on individual molecules and pathways. Our findings set a foundation for further studies involving the use of knockout and/or over-expression mutants of genes important in the differential regulation of sporulation and toxin synthesis to help elucidate the regulation of sporulation and neurotoxin production in C. botulinum.
Acknowledgements
The authors would like to thank Dr. Eric A. Johnson of University of Wisconsin-Madison for providing the bacterial strain, Drs. Ren-Jang Lin and Carlotta Glackin of Beckman Research Institute of the City of Hope for their assistance in the microarray study, the Pathogen Functional Genomics Resource Center of J. Craig Venter Institute for the microarray slides, and DOE Joint Genomic Institute for the workshop on genomic analysis tools. This project is partially funded by NIH grant 1SC3GM086303.
References
- Popoff MR, Bouvet P (2013) Genetic characteristics of toxigenic Clostridia and toxin gene evolution. Toxicon 75: 63-89.
- Hill KK, Smith TJ, Helma CH, Ticknor LO, Foley BT, et al. (2007) Genetic diversity among botulinum neurotoxin-producing clostridial strains. Journal of Bacteriology 189(3): 818-832.
- Ng V, Lin W-J (2014) Comparison of assembled Clostridium botulinum A1 genomes revealed their evolutionary relationship. Genomics 103: 94-106.
- Hill KK, Smith TJ (2013) Genetic diversity within Clostridium botulinum serotypes, botulinum neurotoxin gene clusters and toxin subtypes. Curr Top Microbiol Immunol 364: 1-20.
- Dineen SS, Bradshaw M, Johnson EA (2003) Neurotoxin gene clusters in Clostridium botulinum Type A strains: sequence comparison and evolutionary implications. Current Microbiology 46: 345-352.
- Jacobson MJ, Lin G, Raphael B, Andreadis J, Johnson EA (2008) Analysis of neurotoxin cluster genes in Clostridium botulinum strains producing botulinum neurotoxin serotype A subtypes. Appl Environ Microbiol 74(9): 2778-2786.
- Jovita MR, Collins MD, East AK (1998) Gene organization and sequence determination of the two botulinum neurotoxin gene clusters in Clostridium botulinum Type A(B) strain NCTC 2916. Current Microbiology 36(4): 226-231.
- Fang P-K, Raphael BH, Maslanka SE, Cai S, Singh BR (2010) Analysis of genomic differences among Clostridium botulinum type A1 strains. BMC Genomics 11: 725.
- Bradshaw M, Dineen SS, Maks ND, Johnson EA (2004) Regulation of neurotoxin complex expression in Clostridium botulinum strains 62A, Hall A-hyper, and NCTC 2916. Anaerobe 10(6): 321-333.
- Rao S, L. SR, Morris M, Lin W-J (2007) Variations in expression and release of botulinum neurotoxin in Clostridium botulinum Type A strains. Food borne Pathogens and Disease 4(2): 201-217.
- Leyer GJ, Johnson EA (1990) Repression of toxin production by tryptophan in Clostridium botulinum type E. Arch Microbiol 154(5): 443-447.
- Patterson-Curtis SI, Johnson EA (1989) Regulation of neurotoxin and protease formation in Clostridium botulinum Okra B and Hall A by arginine. Appl Environ Microbiol 55(6): 1544-1548.
- Connan C, Deneve C, Mazuet C, Popoff MR (2013) Regulation of toxin synthesis in Clostridium botulinum and Clostridium tetani. Toxicon 75: 90-100.
- Marvaud J-C, Eisel U, Binz T, Niemann H, Popoff MR (1988) TetR is a positive regulator of the tetanus toxin gene in Clostridium tetani and is homologous to BotR. Infect Immun 66(12): 5698-5702.
- Marvaud JC, Gibert M, Inoue K, Fujinaga Y, Oguma K, Popoff MR. botR/A is a positive regulator of botulinum neurotoxin and associated non-toxin protein genes in Clostridium botulinum A. Molecular Microbiology. 1998;29(4):1009-18.
- Raffestin S, Dupuy B, Marvaud JC, Popoff MR (2005) BotR/A and TetR are alternative RNA polymerase sigma factors controlling the expression of the neurotoxin and associated protein genes in Clostridium botulinum type A and Clostridium tetani. Mol Microbiol 55(1): 235-249.
- Connan C, Brueggemann H, Mazuet C, Raffestin S, Cayet N, et al. (2012) Two-component systems are involved in the regulation of botulinum neurotoxin synthesis in Clostridium botulinum type A strain Hall. PLoS One 7(7): e41848.
- Zhang Z, Korkeala H, Dahlsten E, Sahala E, Heap JT, et al. (2013) Twocomponent signal transduction system CBO0787/CBO0786 represses transcription from botulinum neurotoxin promoters in Clostridium botulinum ATCC 3502. PLoS Pathog 9(3): e1003252.
- Cooksley CM, Davis IJ, Winzer K, Chan WC, Peck MW, et al. (2010) Regulation of neurotoxin production and sporulation by a putative agrBD signaling system in proteolytic Clostridium botulinum. Appl Environ Microbiol 76(13): 4448-4460.
- Worner K, Szurmant H, Chiang C, Hoch JA (2006) Phosphorylation and functional analysis of the sporulation initiation factor Spo0A from Clostridium botulinum. Mol Microbiol 59(3): 1000-1012.
- Kirk DG, Palonen E, Korkeala H, Lindstrom M (2014) Evaluation of normalization reference genes for RT-qPCR analysis of spo0A and four sporulation sigma factor genes in Clostridium botulinum Group I strain ATCC 3502. Anaerobe 26: 14-9.
- Kirk DG, Dahlsten E, Zhang Z, Korkeala H, Lindstrom M (2012) Involvement of Clostridium botulinum ATCC 3502 sigma factor K in early-stage sporulation. Appl Environ Microbiol 78(13): 4590-4596.
- Kirk DG, Zhang Z, Korkeala H, Lindstrom M (2014) Alternative sigma factors SigF, SigE, and SigG are essential for sporulation in Clostridium botulinum ATCC 3502. 80(16): (5141-5150).
- Dahlsten E, Kirk D, Lindstrom M, Korkeala H (2013) Alternative sigma factor SigK has a role in stress tolerance of Group I Clostridium botulinum strain ATCC 3502. Appl Environmental Microbiol 79(12): 3867-3868.
- Ferreira FA, Souza RR, de Sousa Moraes B, de Amorim Ferreira AM, Americo MA, et al. (2013) Impact of agr dysfunction on virulence profiles and infections associated with a novel methicillin-resistant Staphylococcus aureus (MRSA) variant of the lineage ST1-SCCmec IV. BMC Microbiology 13: 93.
- Martin MJ, Clare S, Goulding D, Faulds-Pain A, Barquist L, et al. (2013) The agr locus regulates virulence and colonization genes in Clostridium difficile 027. J Bacteriol 195(16): 3672-3681.
- Murray RGE, Doetsch RN, Robinow CF (1994) Chapter 2: Determinative and cytological light microscopy. In: P Gerhards (Ed.) Methods for General and Molecular Bacteriology. Washington D C: ASM Press.
- Schantz EJ, Johnson EA (1992) Properties and use of botulinum toxin and other microbial neurotoxins in medicine. Microbiological Reviews 56(1): 80-99.
- Higgins D, Dworkin J (2012) Recent progress in Bacillus subtilis sporulation. FEMS Microbiol Rev 36(1): 131-1448.
- Talukdar PK, Olguín-Araneda V, Alnoman M, Paredes-Sabja D, Sarker MR (2014) Updates on the sporulation process in Clostridium species. Research in Microbiology 166(4): 225-235.
- Durre P, Hollergschwandner C (2004) Initiation of endospore formation in Clostridium acetobutylicum. Anaerobe 10(2): 69-74.
- Losick R, Stragier P (1992) Crisscross regulation of cell-type-specific gene expression during development in B. subtilis. Nature 355(6361): 601-604.
- Chibazakura T, Kawamura F, Takahashi H (1991) Differential regulation of spo0A transcription in Bacillus subtilis: glucose represses promoter switching at the initiation of sporulation. J Bacteriol 173(8): 2625-32.
- Mirouze N, Prepiak P, Dubnau D (2011) Fluctuations in spo0A transcription control rare developmental transitions in Bacillus subtilis. PLoS Genetics 7(4): e1002048.
- Chastanet A, Losick R (2011) Just-in-time control of Spo0A synthesis in Bacillus subtilis by multiple regulatory mechanisms. J Bacteriol 193(22): 6366-6374.
- Dυrre P (2011) Ancestral sporulation initiation. Mol Microbiol 80(3): 584-587.
- Hosomi K, Kuwana R, Takamatsu H, Kohda T, Kozaki S, et al. (2015) Morphological and genetic characterization of group I Clostridium botulinum type B strain 111 and the transcriptional regulator spoIIID gene knockout mutant in sporulation. Anaerobe 33: 55-63.
- Raffestin S, Christophe J, Marvaud C, Cerrato R, Dupuy B, Popoff MR (2004) Organization and Anaerobe 10: 93-100.


