A Novel Image Analyzing Algorithm for Colony Plate Counting with Handheld Devices
Marquard D, Austerjost J, Düsterloh S, Schneider-Barthold C, Beutel S, Scheper T and Lindner P*
Leibniz Universität Hannover, Germany
Submission: April 22, 2018; Published: September 04, 2018
*Corresponding author: Lindner P, Institut für Technische Chemie, Leibniz Universität Hannover, Germany, Email: linder@iftc.uni-hannover.de
How to cite this article: Austerjost J, Düsterloh S, Schneider-Barthold C, Beutel S, Lindner P. RA Novel Image Analyzing Algorithm for Colony Plate Counting with Handheld Devices. Adv Biotech & Micro. 2018; 11(1): 555804. DOI:10.19080/AIBM.2018.11.555804
Abstract
Smart devices like smartphones, tablets and smart glasses are part of our daily life and recently started to become crucial parts in lab work and within the quality control of manufacturing processes. Counting colonies on agar plates is an important part of academic research, quality management in food industry and pharmaceutical screening processes. Carrying out counting by hand is a very time consuming and error-prone process.
In this work, an image processing algorithm is introduced, which allows for counting of colonies on images from agar plates acquired by the built-in camera of handheld devices like smartphones or smart glasses. The algorithm detects the petri dish on the image and counts single colonies as well as colonies in clusters. The algorithm was applied to images of E. coli colonies grown on LB agar plates. The results of the algorithm were compared with those from manual counting. The mean difference of the counting results achieved by the algorithm compared to the manual counting overall was 6.46%. However, the accuracy of the algorithm depends on the colony density of the plate. The mean difference was 4.32% for low colony densities and 9.46% for high colony densities. The increased difference for the plates with higher colony densities was caused by a strong cluster formation in the rim area. Therefore, a correction factor based on a linear model was introduced to reduce the mean difference for the higher colony densities from 9.46% to 3.70% and the overall mean difference from 6.46% to 4.12%.
Keywords: Image processing; Colony plate; Handheld devices; Smart technology
Introduction
Lab digitalization
The digitalization of laboratory infrastructures and processes, in which smart laboratory devices collect, store and interpret accumulating data, is currently an integral part of research done by both academic and non-academic institutions [1-2]. Not only the demand for the banishment of outdated paper notes from the laboratory is a motivator for these endeavors, but also the reduction of documentation and data analysis efforts that come along with every single experiment [3]. As a result, it saves time, productivity can be increased, and researchers can easily share accurately stored experiment data and results. As a logical consequence as well as to enable laboratory digitalization, smart mobile devices are currently taking their place in the laboratory; not only as a tool for imaging and documentation of experiments as well as monitoring of experiments independent from stationary desktop computers, but also as a powerful sensor that gains experiment data itself. The built-in camera of most smart mobile devices can serve as a collector for image data, whereas powerful image processing algorithms can interpret and process this data [4-5].
Colony growth applications
The growth of microorganisms on agar plates is one of the most common used techniques to acquire information about the living microorganisms in a sample. The counting of colony forming units (CFU) on agar plates is an essential part of quality management in food industry and water quality labs [6]. Also, agar plates are widely used in a variety of research projects, examples including screening of soil bacteria for agriculture approaches [7] or antibiotics development [7-8]. Furthermore, the transformation efficiency of microorganisms is determined by cultivating the transformed cells on agar plates [9]. Observing the formation of colonies is also part in cancer research [10-11].
Colony counting
Manual counting of CFUs on agar plates is a time consuming, difficult and monotonous work. To ease this work, plates are divided in several sections and only one section is counted. This causes errors due to the uneven distribution of the cells. Furthermore, it is very difficult to consistently decide, if there is a single colony or a cluster [12]. Therefore, systems to automate this counting process were developed. All these systems are based on imaging techniques in combination with image processing algorithms. The systems can be divided in two types: semi-automatic and fully-automatic systems. Semi-automatic systems require user input to set certain parameters needed for the image processing, while fully-automatic systems are independent from user input.
An example for a semi-automatic system is the software Clono-Counter which is designed to detect and count colony formations of cancer cells in six-well plates or flasks [11]. The parameters need to be adjusted by the user. To find suitable parameters, some experience is needed [13]. Ateş & Gerek [14] published a software which counts different types of bacteria colonies on agar plates. For this software, the user is asked to select three points on the boundary of the petri dish to mark it for the algorithm. Another example for a semi-automatic counting system is the software Open CFU [12]. It is designed to detect circular objects like colonies on agar plates.
Fully-automatic systems mostly include a fixed setup used for the image acquisition. An example for this is the colony counting system which was published by Brugger et al. [15]. This system contains a static system for image acquisition to get an image with a defined illumination from a defined angle. The software described by Barber et al. [10] counts colonies of brain cancer cells in angular flasks. The system described by Dahle et al. [16] uses a flatbed scanner to analyze 12 petri dishes with colonies of mammalian cells at once. The recognition of colonies in the rim area is a serious issue for most of the described algorithms. A system to overcome this problem is shown by Chiang et al. [13]. The PetriJet Platform is able to fully independently handle a magazine of up to 20 petri dishes and monitor the contents of these dishes [17]. A commercially available system is the Proto COL 3. This system is able to recognize ten different types of bacterial and fungal colonies [18]. It was also evaluated for Group A. streptococcus counting and applications in water quality laboratories [6,19].
All methods introduced above are using image stations or more complex systems to obtain a suitable image quality which is required for the adequate function of the specific algorithm. In the future, smartphones and other handheld devices will have their place in biotechnological and biomedical research [20]. Therefore, the image processing algorithm displayed in this work tackles this field and allows the colony counting with handheld devices.
Algorithm
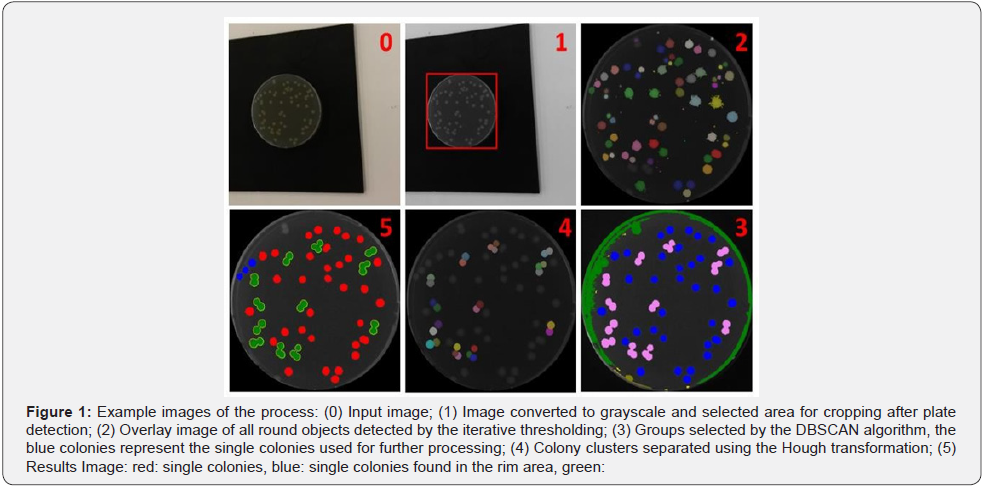
The developed algorithm is designed to count bacterial colonies on agar plates from images acquired by handheld devices like smartphones or smart glasses. To achieve good results from this algorithm the agar plate needs to be placed on a homogenous surface and the amount of light reflections on the plate surface should be as low as possible, especially in the center of the plate. Important steps of the algorithm are displayed in (Figure 1).
The algorithm can be divided into five major steps (Figure 2). The first part includes the recognition of the plate that is followed by finding the optimal binarization threshold (part two). Subsequently, the single colonies and colonies in clusters are defined (part three), which leads to the splitting of the colony clusters into single colonies (part four). In the last part (part five), the algorithm locates previously missed single colonies.
In the first step the input image is converted into a gray scale image and a Sobel operator is applied to highlight the edge of the agar plate (Figure 2, No.1). Then a simple image statistics (SIS) thresholding is performed to obtain a binary image. Afterwards an object detection is performed, which means that pixel in the Moore neighborhood are grouped to objects. In a next step, holes in these objects are eliminated. If there is an object which contains at least 2% of all pixels in the image and has an eccentricity lower than 1.5, this object is treated as being the plate. If more than one object fulfills those criteria, the biggest one of them is used. In the case that no such object is found, an iterative thresholding procedure is started. The initial binarization threshold is 40 and is lowered in each iteration by 1. In each iteration object detection is performed looking for the same criteria as before. If there is no suitable object found, the algorithm is terminated. In the next step, an erosion is performed on the plate object to remove potential artifacts from the binarization process. Now the border of the plate object is determined, and the original grayscale image is cropped (Figure 1, No.1). In the last step, all pixels outside the plate object are set to 0 (black), thus eliminating the 113 background. The resulting image is in the following named “colony image”.
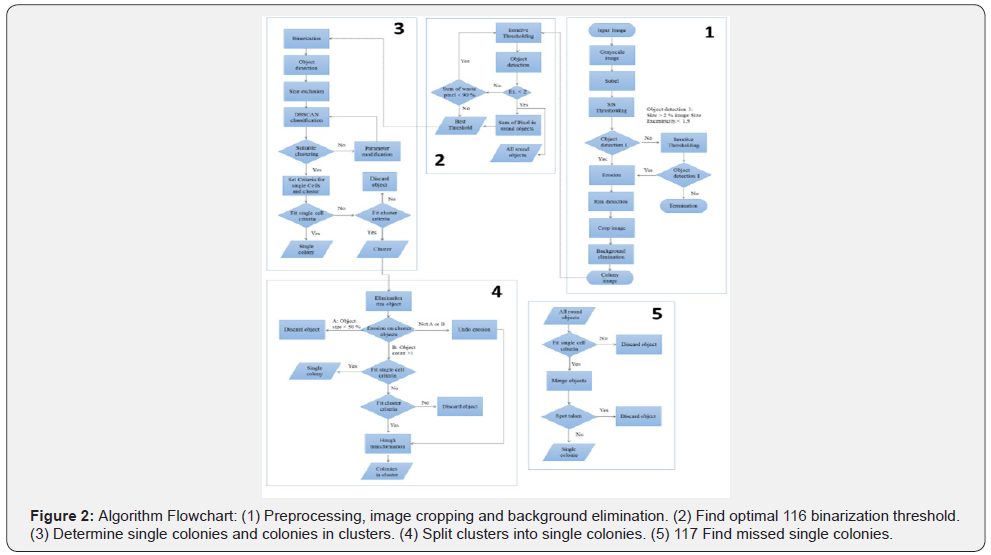
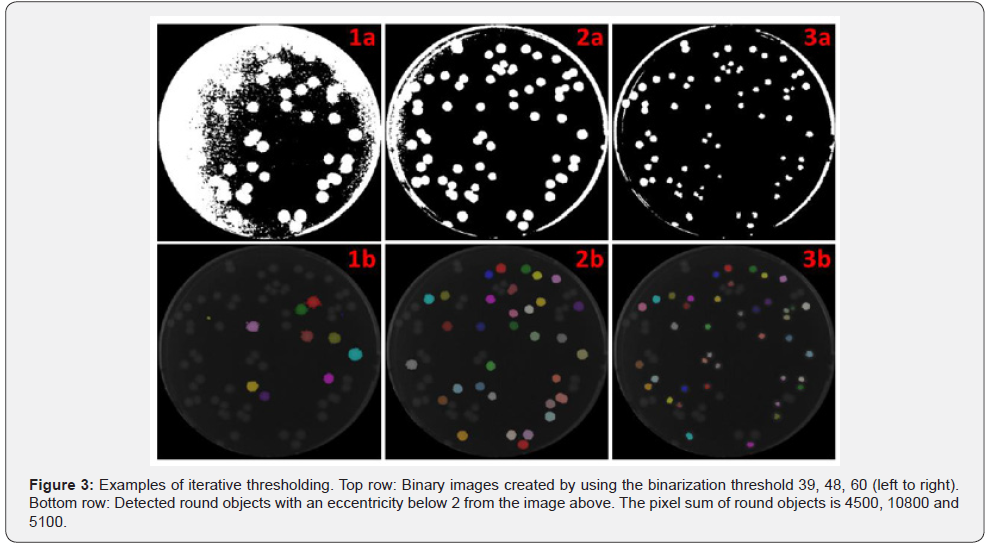
In the second section of the algorithm (Figure 2, No.2), an iterative threshold is applied to the colony image. The value of the brightest pixel is used as a start threshold and after each iteration the threshold is lowered by one. The resulting binary image is used for object detection (Figure 3). All detected objects with an eccentricity below 2 are classified as “good objects” and all other objects are classified as “waste objects”. In each iteration, all good objects, the sum of pixels of all good objects and the sum of pixels of all waste objects are stored. The iteration process ends as soon as the sum of waste pixels reaches 90% of all pixels of the plate. The previously stored good objects are used for finding missing colonies in section 5 of the algorithm. An image of all found good object is shown in Figure 1 (No.2). Due to the overlay of objects in the same spot from different iterations only the largest object is displayed. In the last step, the best binarization threshold is determined by using the threshold of the iteration with the highest sum of pixels in good objects.
At the beginning of the third part of the algorithm, the best binarization threshold is applied to the colony image (Figure 2, No.3). Afterwards an object detection is performed. This is followed by a size exclusion step, which eliminates objects below 10 pixels to remove all binarization artifacts. In the next step the DBSCAN-algorithm is applied to the size and eccentricity values of all objects [21]. The aim of this step is to recognize objects which represent single colonies and to determine the size of these objects. A clustering is treated as successful if there is a group which fits the success criteria. An example for a suitable group is depicted as blue objects in Figure 1 (No.3). At the beginning, the following criteria were applied: an average eccentricity below 2.5 and a standard deviation of the size below 30%. If no suitable group is found, the clustering is restarted with the eccentricity increased by 0.5 and the size standard deviation by 2%. After detecting a suitable group in the clustering process, two properties of this group are used for further processing of the image. The first is the average object size (AOS) of the group and the second is the average object eccentricity (AOE). From these two properties, the criteria for an object are set to count as a single colony or as a colony cluster. For a single colony, the object size needs to be between 30% and 300% of the AOS and the eccentricity must be below the sum of AOE and the standard deviation of the AOE. If both criteria are satisfied, the object is counted as a single colony. If eccentricity criteria not satisfied, but the size of the object is larger than the AOS, the object is counted as cluster. All objects which are not fitting the single colony, or the cluster criteria are discarded.
In the fourth step, all cluster objects are further examined (Figure 2, No.4). First, all objects which have more than 70% of their pixels in the rim area, are excluded because these objects are mostly reflections. The rim area is defined as the 10% of the plate which are closest to the rim of the plate. To determine if a pixel is in the rim area, its distance to the center point is compared to the plate radius. If the distance is larger than 90% of the radius, the pixel is a member of the rim area.
In the next step, an erosion with a window size of 3 is performed on the clusters and three different outcomes are handled. Outcome A is that the object size is decreased by 50%. Then this object is counted as noise and is discarded. Outcome B is the decomposition of an object into two or more objects. In this case, all objects are reevaluated, if they fit the single cell or cluster criteria. Otherwise (Not A or B), the erosion step is undone, and a Hough circle transformation is performed on all remaining clusters to determine the number of single colonies in these clusters.
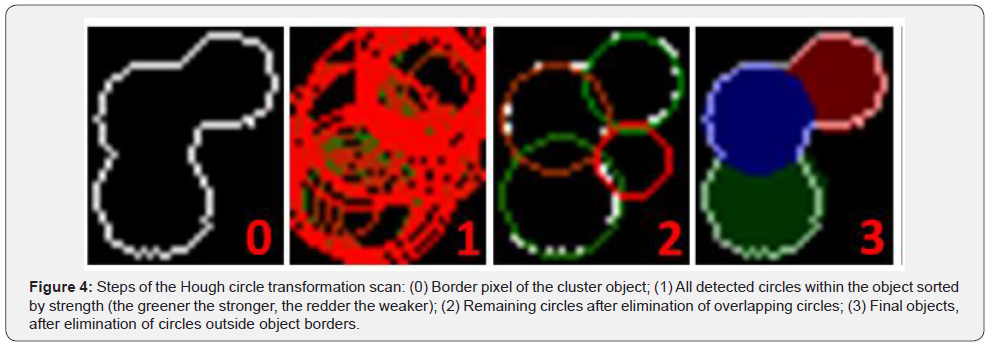
As the first step of the Hough processing, the average radius is determined from the AOS by assuming all colonies are perfect circles. Then an iterative Hough circle transformation scan is performed (Figure 4). The scan starts with an initial search radius set to one third of the average radius. All detected circles are stored in a list. After each iteration, the radius used for the search is increased by 1until it reaches the average radius. When the scan is finished, all detected circles are sorted by their percentage strength. This value shows how many matching pixels exist between the object border and the circle. Consequently, this represents the quality of the circle. This step is followed by three plausibility checks to make sure all circles actually represent a colony. First, all circles are checked if there is the center of another circle within the radius of this circle. If this is the case, the weaker circle is discarded. In the second step, circles which share more than 50% of their area with other circles are discarded. Finally, a circle is discarded if at least 50% of the area of the circle is outside the cluster. The remaining circles represent the colonies within the cluster (Figure 1. No.4).
In the last part of the algorithm all good objects gathered in part 2 are used to find missing single colonies, especially in the rim area of the plate (Figure 2, No.5). At the beginning all round objects are checked if they fit the single colony criteria defined in part 3 of the algorithm. All non-suiting objects are discarded. In a next step, all objects from different iterations which are in the same location are merged. The merging is performed by combining all objects in a binary image and performing a new object detection. As a consequence, only, the biggest object in all those positions is kept. Finally, it is checked for each remaining object if its spot on the plate is already occupied by another single colony or a colony cluster. If this is the case, the object is discarded. The remaining objects are added to the list of single colonies. An example for single colonies is shown in blue in Figure 1 (No.5).
Material and Methods
For all experiments in this work the Escherichia coli strain BL21 (DE3) was used. As media for all cultivations Lysogeny Broth (LB) media was used. One liter of the used LB-Media contains 10g tryptone, 5g yeast extract, 10g NaCl, and 25mg kanamycin. The pH-value was adjusted to 7.5. For agar plates 15g/l agar was added to the LB-Media. For the preparation of the agar plates 20ml of LB medium with agar was transferred to a petri dish.
The preculture were prepared using a heat sterilized 100mL shake flask containing 10mL of sterile filtered LB medium that was inoculated with 1ml of E. coli BL21 (DE3) cryo culture. The preculture was cultivated at 37 °C until an optical density of 0.04 was reached. Afterwards different dilutions of the starting culture were prepared. In each case, 50μl of the dilution were put in the center of the agar plate and were dispensed using a Drigalski spatula. The plates were then incubated at 37 °C for 24h followed by image acquisition.
All images were acquired by a Samsung Galaxy S4 Mini smartphone camera with a resolution of 2.4 Megapixels. The plates were placed on a gray or black pad to achieve homogenous non-reflecting background. As illumination, the standard neon tube light in the lab was used. No additional light source was used. All images were taken free hand perpendicular above the plate. During the image taking, it was tried to avoid light reflection on the plate as good as possible.
The algorithm was developed in C# and is part of the inhouse software “Graphic Analyzer”. For the validation of the algorithm results all images were also evaluated by hand. To make the counting easier and more reliable, it was performed by using a counting tool of the “Graphic Analyzer”. For this purpose, every colony on an image was marked with a dot. Red dots were used to mark single colonies and blue dots were used to mark colonies within a cluster. Afterwards all dots in the images were counted automatically by the “Graphic analyzer”. These results were correlated with the results of the algorithm. In a second step the “Graphic Analyzer” also matches the position of detected colonies from the algorithm and manual counting. This offers additional quality criteria to check if the colonies detected by the algorithm are real colonies and not artifacts. For the calculations, a normal desktop computer was used (CPU: Intel(R) Core (TM)2 Duo CPU T8100 2.10 GHz; Ram: 4 GB; 218 HDD; Windows 7, 32 bit)
Results and discussion
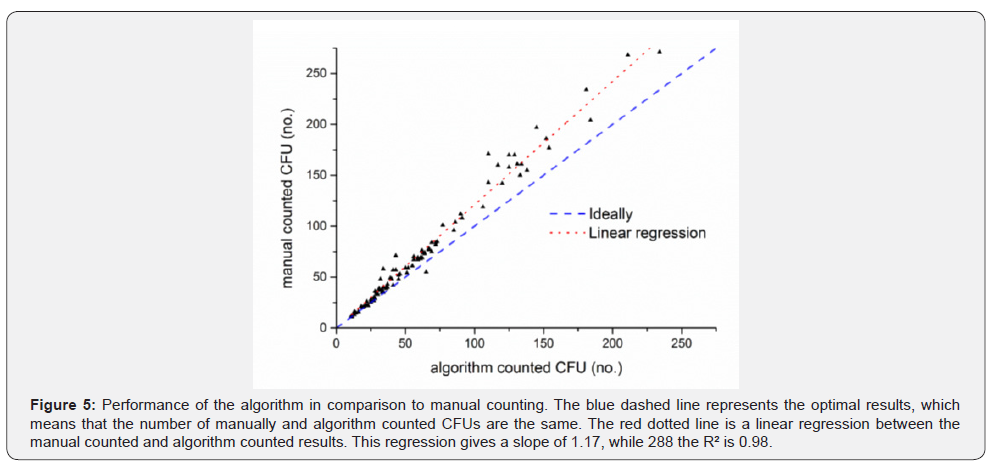
To evaluate the algorithm results, 100 plates were manually counted as well as with the algorithm. A comparison of the obtained results is shown in (Figure 5). For plates with 50 or less CFUs, the results of the algorithm and the manual counting are very close to each other. Plates with more than 50 CFUs show a bigger difference between the results of the different counting approaches. Overall the meandifference between the manual and the algorithm counting is 11.88% (Table 1). For up to 50 CFUs the mean difference is 8.07%. Between 50 and 150 CFUs per plate the difference is 14.2% and for more than 150 CFUs it is 16.99%. In almost all cases, the value of the manual counts is higher than the algorithm results, especially on plates with high colony densities. The main reason for this is the failure of the algorithm to detect clusters in the rim area. An extreme example is shown in (Figure 6). In this plate, a large number of colony clusters can be seen in the rim area in the bottom left part of the plate. Furthermore, even clusters which are located outside the rim area are sometimes connected with rim objects, which causes an elimination of those clusters. This effect can be recognized in the green rim object in Figure 6 (No. 2). Due to the strong artifact formation caused by light reflections, it is very hard to distinguish between these artifacts and clusters in the rim area. Another problem is to find clusters in joined objects from clusters and reflections. Unlike single colonies, clusters cannot be easily recognized by their geometrical shape. Therefore, the algorithm is not detecting/counting these colonies.
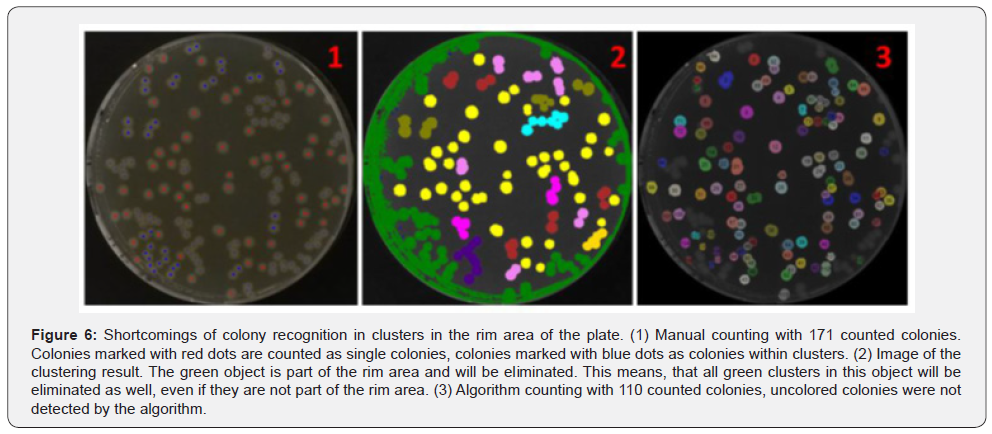

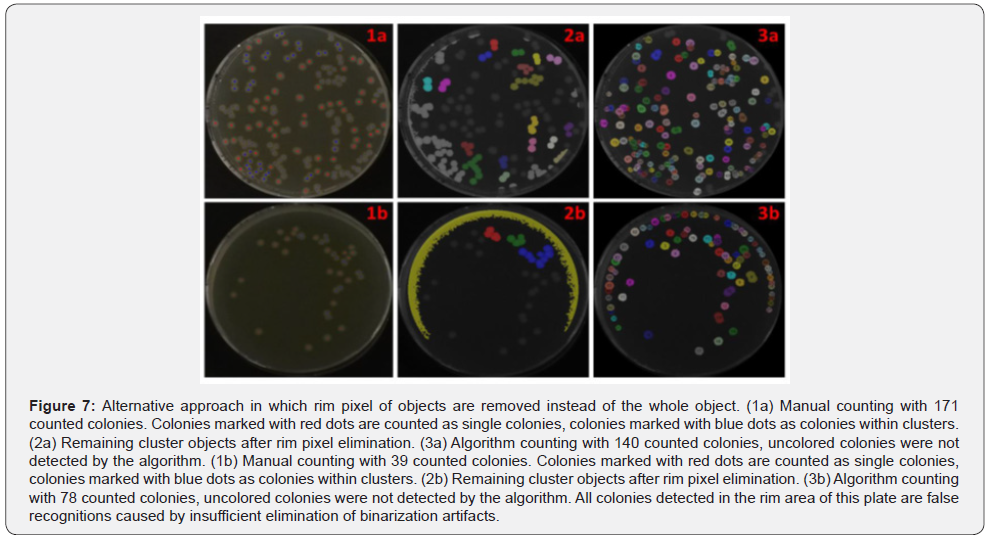
Clusters which are not part of the rim area but connected with it, are eliminated in the process and therefore they are not recognized by the algorithm as shown in Figure 6. An improvement of the detection of those clusters increases the algorithm accuracy. A possible solution for a better detection could be the removal of rim area pixels, thus preventing the removal of the whole object (Figure 7, No.1-3a). This approach was applied to the same set of images. It improves the accuracy for plates with higher colony density, but also extremely decreases the accuracy for plates with low colony densities (Table 1). For plates with less than 50 colonies the mean difference between the 244 algorithm results and the manual counting increases from 8.07% to 68.33%. The main reason for this intense drop of accuracy is the insufficient elimination of binarization artifacts in the rim area (Figure 7, No.2b). Plates with low colony densities are more likely to have no or very few single colonies in the rim area. Therefore, a lower binarization threshold is selected during the determination of the best threshold (Figure 2, No.2). As a result, no round objects are lost by joining them with growing binarization artefacts from rim area. This causes a strong formation of binarization artefacts in the rim area, which are only insufficiently removed in this approach. Due to the very difficult handling of this approach under real conditions it is not applicable to improve the algorithm accuracy in general. Only for special cases an improvement was observed.
An alternative solution to handle this systematic error caused by the rim clusters might be balanced by using a correction factor. For this a linear regression was performed, which achieves a R2 of 0.98 and slope of 1.17 (Figure 5). The R2 of 0.98 indicates that this linear model is suitable to describe the systematic error. Therefore, the slope can be used as a correction factor and was multiplied with the algorithm results (Table 1). For plates with more than 50 CFUs the correction improves the accuracy and lowers the differences for 50 to 150 CFUs per plate to 6.77% and for plates with more than 150 CFUs to 7.16%. Below 50 CFUs per plate the difference is increased to 10.35% which indicates an overcorrection. For these low colony densities, there are very few clusters in the rim area, therefore this correction should only apply to plates with more than 50 CFUs.
The correction factor is a valuable tool to improve the accuracy of the algorithm. But it is only useful if the colonies are evenly distributed on the plate, which is not the case if plates are not carefully prepared. Presumably, the correction factor needs to be separately determined for each type of experiment. Therefore, an improved detection of colony clusters in the rim area would be a huge advantage for this algorithm and the next step to do. The strategy introduced by Chiang et al., [13] in which the rim area of the plate is independently examined with special algorithms, is probably the most promising one. The implementation of an additional step in the algorithm, which would allow to detect and remove light reflections [22], could improve the detection of colony cluster in the rim area and also potentially simplify the image acquisition process.
In addition to the total CFU count, the correct recognition of colonies in the algorithm must be evaluated as well. To do this, the same images were analyzed manually and with the algorithm to ensure no artifacts are counted as colonies. In the next step the positions of all detected colonies in both images are matched. It was tested, if every colony detected by the algorithm has a colony in the same position in the manually counted image. This test was performed for all 100 evaluated images. The algorithm achieves an overall matching rate of 99.46%. In images with more than 100 colonies the matching rate is 98.61%. The mismatches are mostly caused by variations in the cluster splitting between manual counting and the algorithm results. These results prove that the developed algorithm is very accurate in the detection of CFUs and has almost no false recognitions.
Another important factor besides the accuracy is the time needed to count a plate. For 50 plates the time for the manual and the algorithm counting was monitored. While the average time for the manually-counted plates was 2 minutes, the average time for the algorithm counting was only 2seconds in average on a standard office computer.
Summary and Outlook
The developed image processing algorithm was applied to images from E. coli agar plates. The images were acquired by hand using a smartphone without any additional equipment. The algorithm allows to detect the plates on the images and to count the colonies on the plates. The average time to process an image was 2 seconds on an office computer. These results were compared to manual counting of the colonies on the plate images. The algorithm achieves a mean difference between 8.07% and 16.99% depending on the colony density on the plate.
The main issue for the differences is clusters of bacterial colonies in the rim area of the plate. These clusters are very hard to distinguish from artifacts caused by light reflections. To compensate this error, a correction factor from a linear model was introduced. With this correction factor the mean difference was improved from 16.99% to 7.16% for plates with high colony densities. But on the other hand, the mean difference was slight increased from 8.07 % to 10.35 % on plates with less than 50 colonies. Therefore, the correction factor should only be applied on plates with higher cell density.
Furthermore, 99.46% of all colonies detected by the algorithm were also recognized in the same position by manual counting. This shows that the algorithm is precise and very robust against false recognitions.
The used correction factor is more an adjuvant than a solution. To improve the accuracy of the algorithm the cluster, recognition in the rim area needs to be improved. Furthermore, an additional algorithm part which detects and removes reflections from the image would improve the accuracy of the algorithm and ease the image analysis process. An integration of the developed algorithm into an app is displayed by Austerjost et al., [23], who also compares the performance of this algorithm to other available algorithms.
The integration into an app is a necessary next step to make the algorithm accessible and useful for lab work. Such an integration. The presented work demonstrates that handheld devices in combination with a suitable image processing algorithm are applicable for counting colony forming units on agar plates.
Acknowledgement
The algorithm was developed within the frame of the smartLAB-initiative. We thank the Lower Saxony Ministery of Research and Culture and the Ministery of Economics for the financial support. This work was partially performed within the framework of the BIOFABRICATION FOR NIFE initiative, funded by the state of Lower Saxony, Germany.
References
- Perkel JM (2017) The Internet of Things comes to the lab. Nature 542(7639): 125-126.
- Beutel S, Lindner P, Endres C (2016) Flexibel, Funktionell Und Digital. Nachrichten Aus Der Chemie 64(4): 428-430.
- Giles J (2012) Going paperless: The digital lab. Nature 481(7382): 430- 431.
- Contreras-Naranjo JC, Wei Q, Ozcan A (2016) Mobile Phone-Based Microscopy, Sensing, and Diagnostics. IEEE Journal of Selected Topics in Quantum Electronics 22(3).
- Coskun AF, Ozcan A (2014) Computational imaging, sensing and diagnostics for global health applications. Curr Opin Biotechnol 25: 8-16.
- Hallas G, Monis P (2015) Evaluation of heterotrophic plate and chromogenic agar colony counting in water quality laboratories. Methods X 2: 415-422.
- Alves GM, Cruvinel PE (2016) Customized Computer Vision and Sensor System for Colony Recognition and Live Bacteria Counting in Agriculture. Sensors & Transducers 201(6): 65-77.
- van Doorn LJ, Schneeberger PM, Nouhan N, Plaisier AP, Quint WG, et al. (2000) Importance of Helicobacter pylori cagA and vacA status for the efficacy of antibiotic treatment. Gut 46(3): 321-326.
- Invitrogen (2013) One ShotTOP10 Competent Cells. Invit User Gudie 280126: 1-16.
- Barber P, Vojnovic B, Kelly J (2000) An automated colony counter utilising a compact Hough transform. Med Image: 2-5.
- Niyazi M, Niyazi I, Belka C (2007) Counting colonies of clonogenic assays by using densitometric software. Radiat Oncol 2: 4.
- Geissmann Q (2013) Open CFU, a New Free and Open-Source Software to Count Cell Colonies and Other Circular Objects. PLoS One 8(2): e54072.
- Chiang PJ, Tseng MJ, He ZS, Li CH (2015) Automated counting of bacterial colonies by image analysis. J Microbiol Methods 108: 74-82.
- Ateş H, Gerek ÖN (2009) An image-processing based automated bacteria colony counter. 2009 24th International Symposium on Computer and Information Sciences.
- Brugger SD, Baumberger C, Jost M, Jenni W, Brugger U, et al. (2012) Automated Counting of Bacterial Colony Forming Units on Agar Plates. PLoS One 7(3) e33695.
- Dahle J, Kakar M, Steen HB, Kaalhus O (2004) Automated counting of mammalian cell colonies by means of a flat bed scanner and image processing. Cytometry A 60(2): 182-188.
- Vogel M, Boschke E, Bley T, Lenk F (2015) PetriJet Platform Technology: An Automated Platform for Culture Dish Handling and Monitoring of the Contents. J Lab Autom 20(4): 447-456.
- Pridmore A, (2012) Evaluation of the ProtoCOL 3 instrument for enumeration of bacterial and fungal colonies on agar plates, pp. 1-9.
- Frost HR, Tsoi SK, Baker CA, Laho D, Sanderson-Smith ML, et al. (2016) Validation of an automated colony counting system for group A Streptococcus. BMC Res Notes 9: 72.
- Gan SKE, Poon JK (2016) The world of biomedical apps: their uses, limitations, and potential. Scientific Phone Apps and Mobile Devices 2(1): 6.
- Ester M, Kriegel HP, Sander J, Xu X (1996) A Density-Based Algorithm for Discovering Clusters in Large Spatial Databases with Noise. Proc 2nd Int Conf Knowl Discov and Data Min, pp. 226-231.
- T Xue, M Rubinstein, C Liu, W T Freeman (2015) A computational approach for obstruction-392 free photography. ACM Trans Graph 34(4): 79.
- J Austerjost, D Marquard, L Raddatz, D Geier, T Becker, et al. (2017) 394 Beutel, A smart device application for the automated determination of E. coli colonies on 395 agar plates. Eng Life Sci, pp. 396-397.


