


Development of General Gompertz Models and Their Simplified Two-Parameter Forms Based on Specific Microbial Growth Rate for Microbial Growth, Bio-Products and Substrate Consumption
Jiacheng Shen and Jun Zhu*
Biological and Agricultural Engineering, University of Arkansas, USA
Submission: June 08, 2017;Published: July 25, 2017
*Corresponding author: Jun Zhu, Biological and Agricultural Engineering, University of Arkansas, USA, Tel: 479-575-2883; Email: junzhu@uark.edu
How to cite this article: Jiacheng S, Jun Z. Development of General Gompertz Models and Their Simplified Two-Parameter Forms Based on Specific Microbial Growth Rate for Microbial Growth, Bio-Products and Substrate Consumption. Adv Biotech & Micro. 2017; 4(3): 555640. DOI: 10.19080/AIBM.2017.04.555640
Abstract
Modified Gompertz model has been widely used to simulate the kinetics of microbial growth and bio-products formation. However, the fundamental problem with this model rests with its inability of meeting the initial condition of bio-products. A general Gompertz model for microbial growth and its 2-parameter form were developed in this study, both of which can reduce to the original Gompertz model. The developed model for microbial growth was further extended to account for bio-products production and substrate consumption by means of the corresponding yield coefficients. All the models developed herein could meet the initial conditions of microbial growth, bio-products, and substrate consumption. Batch experiments of anaerobic co-digestions of poultry litter and wheat straw at 2% total solids level consisting of 100, 75, and 50% VS of poultry litter were conducted to verify the model. The maximum specific methane volumes were obtained to be 207, 134, 5.18mL (g VS)-1 for 50, 75, and 100% VS co-digestion, respectively. The developed model for bio-products was successfully applied to cumulative methane volumes produced from anaerobic co-digestion. The model parameters obtained from the bio-products model combined with the corresponding yield coefficients were applied to the microbial and substrate models to predict the microbial and substrate changes during co-digestion, with the relative errors being less than 2.21% for the former and 4.46% for the latter, respectively.
Keywords: Anaerobic processes; Biogas; Bio kinetics; Gompertz model; Poultry litter; Waste treatment
Introduction
In anaerobic digestion, the cumulative gas volume produced and the specific volume (gas volume per gram of initial volatile solid (VS) or chemical oxygen demand (COD))are commonly used to estimate the process efficiency, and their profiles with respect to time often are described by the first-order models (Equation(1) and(2)) [1,2] and the modified Gompertz model (Equation (3))[3-10].
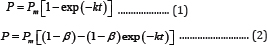
where P is the cumulative gas volume (mL); Pm is the maximum gas volume (mL); k is the first-order reaction rate constant, (d-1); t is the reaction time, (d); and β is the non-degradable fraction of substrate (dimensionless).
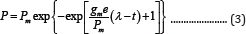
Where gm is the maximum bio-product production rate (i.e., production rate at the deflection point of P VS. t curve)(mL d-1), λ is the lag time, which is defined as the t-axis intercept of the tangent through the inflection point (d), and e is the base of the natural logarithm (dimensionless).
Compared to the first-order model, the modified Gompertz model was commonly used as it was correlated with two biochemical reaction parameters, gm and λ. However, the inherent short coming of both the Gompertz and modified Gompertz models is apparent because neither of them meets the initial condition (i.e., P = 0 at t = 0) when they areused to describe biogas production (Equation (4)) unless parameter A approaches infinite.
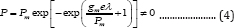
This issue originates from the fact that both the Gompertz model (Gompertz, 1825) and the modified Gompertz model [11] were developed to describe biological and bacterial growth rather than their product production, such as methane, because two situations have different initial conditions. For example, in methane production from wastewater, the initial microbial mass is not zero due to the addition of the seeds of anaerobic activated sludge to the bioreactor (Equation (4)=0 at t = 0), while the product volume (methane) is zero. Therefore, direct uses of Gompertz and modified Gompertz models without correction to simulate bio-products production and microbial growth is not appropriate.
Another issue of the modified Gompertz model for bioproducts production is that the lag time fitted from the experimental data sometimes is negative, which occurs at situations where bio-products are generated almost immediately without a lag period. For example, biogas is produced quickly during anaerobic digestion of wastewater that is inoculated with acclimatized anaerobic sludge. Therefore, it is necessary to develop two general models, as well as their simplified 2-parameter forms (λ = 0), for microbial growth and bio-products production. Another advantage of the 2-parameter model is the reduction in the number of fitted constant combinations compared to a 3-parameter model, and it is well known that non-linear regressions often produce many combinations of the fitted constants [12].
The fewer the required fitted constants, the fewer is the number of the fitted constant combinations produced. The kinetics of a biological process can usually be described completely by three variables, i.e., substrate consumption, microbial growth, and product formation. Mu et al. [7] simulated the kinetics of hydrogen, sucrose, and microorganisms using the modified Gompertz model based on three sets of kinetic data collected, and obtained three sets of model parameters. Similar work was also reported, except for simulation of microorganism, by Wu et al. [9]. However, sampling and analyzing biogas in batch anaerobic digestion is often easier than measuring microbial biomass in the liquid phase because of the potential disruption of the anaerobic condition maintained in the liquid. Therefore, to estimate microbial mass based on the biogas volume produced becomes a challenge. Fortunately, the bioproduct yield coefficients are correlated with the three variables, making it possible to use a kinetic variable combined with the corresponding yield coefficient to describe another kinetic variable.
The objectives of this study were to
A. Develop the general Gompertz models and their mplified 2-parameter forms for microbial growth based on a defined specific microbial growth rate μ.
B. Extend the developed models for bio-products to microbial growth and substrate consumption with corresponding yield coefficients.
C. Measure the cumulative specific methane volume of codigestion of poultry litter and wheat straw in a batch reactor.
D. Apply the developed models to simulating the cumulated methane volume with respect to time, and obtain the model parameters.
E. Predict the kinetics of the microbial growth (represented by the ratio of volatile suspended solid ( VS S) to non-volatile suspended solid (NON- VS S)) and substrate consumption (represented by the ratio of volatile solid ( VS ) to non-volatile solid (NON- VS )) in co-digestion using the model parameters obtained from bio-product kinetics.
Development of general Gompertz models and their simplified two-parameter forms based on a defined specific microbial growth rate
A general Gompertz model and its simplified 2-parameter form for microbial growth
The specific microbial growth rate takes on an exponential form [13]:
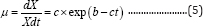
where µ is the specific microbial growth rate (d-1), X is the microbial mass (g), and b (d) and c (dimensionless) are constants. Integrating Equation (5) with respect to time produces

where C1 is a constant. When t = 0 and X = X0, we have

and

Equation (8) reduces to the Gompertz model (referred to as 3PG model, Equation (9))[11] if constant 1 is much smaller than exp(-ct).

Therefore, Equation (8) can be named as the general 3-parameter Gompertz model for microbial growth (G3PGB). When b =1, 3PG model reduces to 2-parameter Gompertz model (referred to as 2PG model, which is Equation (10)):

When t approaches infinite, X approaches the maximum value X :

When t = 0, the specific microbial growth rate becomes the maximum value µm :
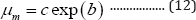
Substituting Equation (12) into Equation (8) produces the second form of G3PGB containing the maximum specific growth rate shown in Equation (13):
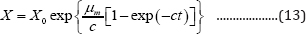
The first and second derivatives of Equation (8) are
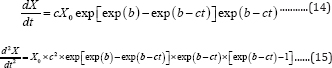
Let the second derivative be zero at the inflection point, the time ti at inflaction point is
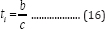
The coordinates at the deflection point and x-axis intercept of the tangent through the inflection point are (b/c, cX0 exp (-exp(b)), and (λ, 0) (Figure 1). So the maximum microbial growth rate, gmb, (g d -1) is

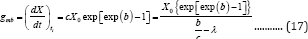
From Equation (17), we can derive the lag time:
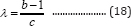
Substituting Equation (18) into Equation (8) produces the third form of G3PGB containing two parameters λ and µm (Equation (19)):
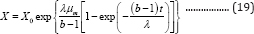
where b, µm, and λ are the fitted constants. If the lag time is taken as zero, from Equation (18), we will obtain:

Thus, Equation (8) reduces to a general 2-parameter Gompertz model for microbial growth (G2PGB) described by Equation (21):

General 3-parameter and 2-paramer Gompertz models for bio-products formation and substrate consumption:
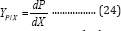
The yield coefficients of bacteria to substrate YX/S(gg-1), and product to substrate Yp/X(mLg-1) are defined as[13]:
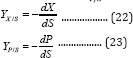
Combining Equation (22) and (23) produces the yield coefficients of product to bacteria Yp/X (mL g-1):
Integrating Equation (24) with respect to time, considering the initial condition: t = 0, P0 =0,and assuming that YP/X is constant during digestion as reported by Fan et al. [14] produces:
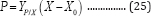
Substituting Equation (8) into Equation(25) produces:
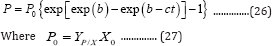
Equation (26) can be defined as the general 3-parameter Gompertz model for bio-products (G3PGP). When t approaches infinite, P approaches the maximum value Pm:

Substituting Equation (12) into Equation (28) produces the second form of G3PGP containing the parameter nm shown in Equation (29):

The first and second derivative of Equation (26) are similar to those of Equations (14) and (15) except that X0 is substituted by P0. Thus, ti = b/cat the inflection point t = ti can be obtained. However, since the coordinates at the inflection point for bioproducts are different from those of microbial growth, which are (b/c, P0 exp(-exp(b)-1)-P0) (Figure 1), the maximum bio-product production rate, gm (mLd-1), becomes
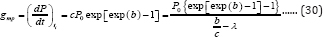
From Equation (30) comes the lag time for bio-products production:

If the lag time is set to zero, the constant, b, based on Equation (31) will be:
Thus, Equation (26) reduces to a general 2-parameter Gompertz model for bio-products formation (G2PGP), as shown by Equation (33):
Similarly, the general 3-parameter Gompertz model and its simplified 2-parameter form for substrate consumption (G3PGS (Equation (34) and G2PGS (Equation (35)) can be derived:
Meanwhile, the microbial growth models (G3PGB and G2PGB) (Equation (8) and (21)) can also be expressed with respect to bio-products production:
Equation(34) through (37) suggest that the substrate and microbial changes versus time can be expressed as a set of parameters obtained from the bio-products production model combined with the corresponding yield coefficients.
The sum of squares of residuals (SSR), and correlation coefficients (R2) were used to estimate the simulation defects, which are defined as follows:
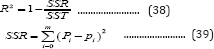
Where Pi is the value of the ith point calculated from the models, pi is the observed value of the ith point, SST is the total sum of squares of deviations,

where is the mean of the observed data, i is the index of observed points, and m is the sample size,
Materials and Methods
Materials
The poultry litter used in the experiments was obtained from the content of the raw sieved particles of poultry litter and the raw granulated particles of the wheat straw were measured in our laboratory, and presented in Table 1. The extractives, ash, and structural carbohydrates including glucose, xylose, arabinose, and lignin contents of wheat straw were analyzed in another laboratory of our department and were reported in Table 2 [15].


Methods

* PL and WS: poultry litter and wheat straw
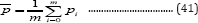
The co-digestion experiments of poultry litter and wheat straw were conducted in 1000mL graduated glass flasks. The flasks were sealed using rubber stoppers, and connected to 500 or 1000mL gas bags (Tedlar Bag, CEL scientific Corp.), depending on gas volumes produced, at the top of the flasks. There were valves between the flasks and gas bags to prevent air from entering into the flasks during gas bag replacement to maintain anaerobic environment in the digesters. Prior to the experiments, the anaerobic activated slurry as inoculum was prepared for 25 days using 2%TS poultry litter with addition of half-dried activated sludge (85% moisture content) taken from the Fayetteville municipal wastewater treatment plant and stored in the refrigerator. Then, the poultry litter and wheat straw (Table 3) were mixed with 100mL prepared anaerobic activated slurry and tap water to form 2% total solid suspensions (on a dry basis, total volume 500mL) in 1000mL flasks. Three mixtures of poultry litter (100, 75, and 50% VS in total VS ) and wheat straw (0, 25, 50% VS in total VS ) were examined in co-digestion. The masses of the three mixtures required to meet those VS percentages were calculated using the following Equations:
where r is the ratio of VS fractions of poultry litter to wheat straw; mts is the total mass required of the raw poultry litter and wheat straw combined, (g); m . and m are the raw masses of poultry liter and wheat straw required at a ratio of VS of poultry litter to wheat straw (g); mdpl and mdws are the dried masses of poultry litter and wheat straw (g); fpl and fws are the VS fractions of poultry litter and wheat straw; and mcpl and mcws are the moisture contents of poultry litter and wheat straw based on the raw masses (dimensionless). The samples were taken from the suspensions in the flasks to measure their initial properties before the flasks were purged with pure nitrogen for 5 minutes to remove the air in the headspace. And then the flasks containing the suspensions were kept at 37 °C in an incubator (Fisher Scientific Isotemp Standard Incubators 600 Series), and were manually shaken twice a day for about 30 seconds. Biogas samples were taken daily in the first two days and every three days thereafter until no biogas in the flasks was produced. The liquid samples were taken at the end of experiments. The initial and final liquid samples were divided into two parts: one part was directly measured for the properties of the suspensions containing solid, such as VS , TS, and total COD, etc., and another part was filtered through a glass fiber paper (Fisher brandG4) in vacuum, with the filtrate used to measure the soluble properties, such as VS S, ammonia-nitrogen, total Kjeldahl nitrogen (TKN), soluble COD, and volatile fatty acids, etc. The suspended solids left on the filter paper were used to measure VS and VS S after heating at 105 °C and 550 °C. Controlled digestions (100mL of active slurry plus 400mL of tap water without any poultry litter and wheat straw) also were conducted to eliminate the effect of activated slurry on gas volume produced from the noncontrolled experiments.
The total solids and volatile solids were measured using the gravity method. The total and soluble CODs, total nitrogen, total Kjeldahl nitrogen (TKN), and ammonia-nitrogen were analyzed using a DR 3900 Hach Spectrophotometerand a DRB 200 Hach Reactor following the Hach Manual sand the Standard Methods [1]. The biogas composition collected in the gas bags was analyzed using a Shimadzu Gas Chromatograph (GC 2014) equipped with a thermal conductivity detector (TCD) and a Shin Carbon column (Restek, length 2m ID 2mm). The temperature for the column was kept at 40 °C for 2 minutes, followed by increasing at a rate of 25 °C per minute until 150 °C, then held for 1minute. The temperatures of the injector and TCD were 180 °C and 185 °C, respectively. Sample volume of 0.2mL was injected using a gas tight syringe by hand. The GC was calibrated for methane, carbon dioxide and nitrogen using three standard gases (15% methane, 15% carbon dioxide, and 70% nitrogen; 60% methane and 40% carbon dioxide; 100% methane) purchased from the Gas Co. (BuyCalGas.com).
The volatile fatty acids in the digested solution were also analyzed by the same GC equipped with a flame ionization detector (FID), an auto injector (Shimadzu, A0C-20i), and a Stabilwax®-DA column (Restek, length 30m* ID 0.53mm). The temperature for the column was kept at 40 °C for 2 minutes, followed by increasing at a rate of 25 °C per minute until 150 °C, and then held for 1minute. Temperatures of both the injector and FID were 250 °C. The injected sample volume was 0.006mL. Identification of the volatile fatty acids, including acetic acid, propionic acid, isobutyric acid, butyric acid, isovaleric acid, n-valeric acid, isocaproic acid, n-caproic acid, and heptanoic acid, was verified by comparing their retention times with those of a standard mixture (Sigma-Aldrich, St. Louis, MO). Biogas volumes produced from the digesters were measured using a wet gas meter (Model XMF-1, Shanghai Cixi Instrument Co., Ltd).
Results and Discussion
Cumulative specific methane volumes of co-digestion of poultry litter and wheat straw
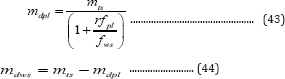
Figure 2 shows the cumulative specific methane volumes (mL (g initial VS)-1) at three VS percentages (100, 75, and 50% VS of poultry litter) during anaerobic co-digestion. Generally, they all increased with the digestion time. After 35 days, the maximum specific methane volumes for 75 and 50% VS were reached with no further increases, but that for 100% VS still increased slightly (although the overall volume was much lower than those of the other two). The maximum cumulative specific methane volumes of 50 and 75% VS were about 207 and 134mL (g initial VS)-1, respectively (Figure 2), but the 100% VS had only less than 5.2mL (g initial VS)-1 (Figure 2). Meanwhile, the VS removals were about 46.2, 54.4, and 53.3% for 100, 75, and 50% VS, respectively. Although the concentrations of ammonia- nitrogen and total volatile fatty acids were usually considered as two inhibitors to anaerobic digestion [16,17], in the present study, their concentrations in the digested effluents of 100% VS were lower than those of the other two VS percentages (except that the ammonia-nitrogen level for 100% VS was similar to that of 75% VS (288 VS 287mg L-1), which suggested that ammonia- nitrogen and total volatile fatty acids were not the causes of low methane volume production for the 100% VS treatment. Another factor influencing the methane yield in anaerobic digestion was the ratio of carbon to nitrogen in the feedstock. Although the theoretical ratio is 16:1 (weight: weight) typically for glucose conversion to methane, the actual C: N ratio should be greater than 16:1 because some carbon compounds in biomass such as lignin are not biodegradable by anaerobic bacteria. For this reason, the C: N ratio of solid feedstock usually measured using an elemental analyzer can be inaccurate. Therefore, a concept of the available C: N ratio, rC/Na, was introduced in this study, which was defined as


* TP: total phosphate
Where CODit, CODft, and CODfs are the initial total COD, final total COD, and final soluble COD (all in unit: mg L-1), respectively, TNfs is the final soluble nitrogen, and 12 and 32 are the carbon and nitrogen molecular weights for conversion of the COD unit (O2 unit: mg L-1) to carbon unit (C: mg L-1). The TNfs s in the digested effluent were measured to be 251, 342, and 406mg-N L-1 for the three VS percentages (Table 4), respectively. Thus, the ratios of available C:N, rC/Nα, were calculated to be 9.63, 13.2 and 22.3 for 100, 75, and 50% treatments. The lowest C: N ratio of 100% VS appeared to explain the lowest methan effluent were 7.71, 7.59, and 7.39 for the three VS percentages. The highest pH (7.71) for the 100% VS was beyond a normal operating pH range of 6.4-7.5 (Kugelman & Chin, 1971), which could be the second reason for the lowest methane volume of the 100% VS . The initial total COD (29,625mg L-1) (Table 4) of the 50% VS was 2.16(13,750mg L-1 for the 100% VS ) and1.38 (21,450mg L 1 for the 75% VS ) times those of the other VS percentages, but the corresponding VS (8.2g) of the 50% VS was only 1.16 (7.09g) and 1.08 (7.60g) times those of the other two VS percentages, implying that the chemical components, such as hemi cellulose and cellulose, in wheat straw contributed more to COD than those in poultry litter. However, the initial soluble COD (2,773 mg L-1) of the 100% VS was higher than those (2,540mg L-1 for 75% VS and 2,304mg L 1 of 50% VS ) of the other VS percentages, which could be attributed to the easily soluble proteins and amino acids in poultry litter as opposed to the components of wheat straw.
Simulation of methane production kinetics using the developed models
The cumulative volumes (mL) with respect to time were applied to the models of G3PGP (Equation (26)), G2PGP (Equation (33)), 3PG (Equation (9)), and 2PG (Equation (10)). The model parameters were obtained using a MATLAB nonlinear regression program. The fitted parameters and data of statistical analysis are listed in Table 5 & 6, respectively, and the simulated curves are shown in Figure 3. It can be seen that the regression curves of the cumulative methane volumes from the G3PGP and G2PGP models passed the origin of the coordinates as expected, while greater deviations at the origin for the regression curves calculated from the 3PG and 2PG models were observed. However, the 3PG model produced the best simulated effect among the four models based on its smallest sums of squares residues (SSR), highest correlation coefficients(R2) (for example, for 100% VS, R2 = 0.9875 compared to 0.9873 for G3PGP, 0.9857 for G2PGP, and 0.9858 for 2PG), and F-test values (Table 6).These statistical analysis data for the 2PG model were also better than the G2PGP model except for the 75% VS, which might be attributed to a more stringent requirement of crossing obtained data is considered. Therefore, if the weighted least square regression was applied [18] (Equation (46)), a series of weighted statistical parameters were obtained and presented in Table 6.


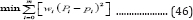
where wi is the weight at point i. For example, weight 3 was given to the deviation from the origin point and weight 1 was given to the deviations from other observed points produced by the models. The weighted correlation coefficients (R2w) produced from the 3PG and 2PG models were lower than the corresponding G3PGP and G2PGP models (for example, for the 100% VS for 3PG, R2w= 0.9808, which was lower than 0.9873for G3PGP, and R2w = 0.9727 for 2PG, which was lower than 0.9857 for G2PGP).
Prediction of kinetics of VS S growth and VS consumption using kinetic constants obtained from methane production

Volatile suspend solid sand volatile solids are often used to measure microbial activity in activated sludge and the removal efficiencies of organic components in wastewater treatment, respectively [19]. The initial and final ratios of VS S to NON- VS S of the three VS percentages were 0.2379 and 0.4390 for 100% VS, 0.1652 and 0.3597 for 75% VS, and 0.1376 and 0.2684 for 50% VS, respectively. According to the definitions of YP/X (Equation (24)), the obtained YP/X for the three VS percentages were 178.2, 5,223, and 12,986mL. The constants, P0 and c, in G2PGB (Equation (37)) (for simplification, G2PGB was used) were also determined from methane regression (G2PGP Equation (33)) (Table 5). Thus, the kinetics of microbial growth based on ratios of VS S to NON- VS S during digestion can be predicted using G2PGB Figure 4. The predicted ratios of VS S to NON- VS S for the three VS percentages at the end of experiments were 0.4462, 0.3676, and 0.2737 (relative errors: 1.65%, 2.21% and 1.99%), respectively. Similarly, the yield coefficients, YP/S, of product to substrate of the three VS percentages were 28.63, 508.5, and 836.3mL (g VS)-1, and the predicted ratios of VS to NON- VS at errors:2.90%, 4.46%, and 4.28%) using the G2PGS model the end of experiments were 1.510, 1.747, and 1.852 (relative (Equation (35)) (Figure 4).
Predictions of methane production rate, and integral and differential methane yields

The methane production rates at the three VS percentages of poultry litter and wheat straw can be expressed as the first derivative of G2PGP model (Equation (33)) and the curves are shown in Figure 5:

It is interesting to note that the maximum methane production rate (about 33.2mL d-1) was achieved on the 15th day by the 75% VS compared to other maximum rates (1.40mL d-1on the 11th day by the 100% VS and 52.4 mLd-1on the 42ndday by the 50% VS), although the maximum methane volume (1,700mL) of the 50% VS was higher than that (1,016mL) of the 75% VS. This may suggest that in continuous operation of anaerobic digestion, the75% VS with a shorter residence time could produce more total methane volume than the 50% VS with a longer residence time.

On the other hand, the effect of feed stocks on anaerobic digestion is commonly expressed as the methane volume divided by the VS added initially. However, the feed stocks used in anaerobic digestion usually are mixtures consisting of various components rather than pure substances, and these components produce different methane volumes per their respective masses. It is therefore beneficial to define methane yield as methane volume produced per VS mass consumed rather than VS added (The latter is referred to as the specific methane volume in the present study). Such yield information will be instrumental in understanding the contributions of various VS components to methane production. The yield can be further defined as the integral yield and differential yield, with the former expressed as and the latter as
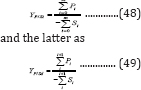
Figure 6 shows the integral and differential methane yields of the three VS percentages tested in this study, in which the methane volumes observed and the substrate masses calculated from G2PGS (Equation (35)) were used. The integral methane yields demonstrated the greatest values of 28.5, 963, and 751mL (g VS reacted)-1 for 100, 75, and 50% VS, respectively, at the inception. There were two peaks and valleys for the integral yield for the 100 and 50% VS, but only one peak and valley for 75% VS. The differential yields for 100, 75, and 50% VS showed the maximum values of 32.9, 686, and 846mL (g VS reacted)-1 at the residence times of 26, 32, and 35 day, respectively. The longer residence times needed for 75 and 50% VS to reach the maximum yields were apparently due to the increasing lingo cellulosic contents in the substrates that required longer times for hydrolysis than for proteins and amino acids contained in poultry litter.
Conclusion
Anaerobic co-digestion of poultry litter and wheat straw at 2% total solids level consisting of 100, 75, and 50% VS (poultry litter/(poultry litter+wheat straw)) in batch experiments produced the cumulative methane and specific methane volumes of 35.8mL and 5.18mL (g VS ) 1, 1,016mL and 134mL (g VS )-1, and 1,699mL and 207mL (g VS ) 1, respectively. The low C: N ratio and high pH value resulted in low methane volume for 100% VS of poultry litter. The V Sin feedstock was removed by about 46.2, 54.4, and 53.3% for 100, 75, and 50% VS, respectively. The general Gompertz models and their simplified 2-parameter forms for microbial growth, bio-products, and substrate consumption were developed, all of which were able to meet the initial conditions of bio-kinetics. The developed models were successfully applied to describing the cumulative methane volumes produced, microbial growth, and substrate consumption during anaerobic co-digestion, with the relative errors for microbial growth and substrate consumption being less than 2.21% and 4.46%, respectively.
Acknowledgement
This work is financially supported by the USDA National Institute of Food and Agriculture, Hatch project 1003122, and the Arkansas Agricultural Experiment Station.
References
- Li Y, Feng L, Zhang R, He Y, Liu X, et al. (2013) Influence of Inoculum Source and Pre-incubation on Bio-Methane Potential of Chicken Manure and Corn Stover. Applied Biochemistry and Biotechnology 171(1): 117-127.
- Li Y, Zhang R, Chen C, Liu G, He Y, et al. (2013) Biogas production from co-digestion of corn stover and chicken manure under anaerobic wet, hemi-solid, and solid state conditions. Bioresource Technology 149: 406-412.
- Costa JC, Barbosa SG, Alves MM, Sousa DZ (2012) Thermo chemical pre- and biological co-treatments to improve hydrolysis and methane production from poultry litter. Bio resource Technology 111: 141-147.
- Kafle GK, Kim SH, Sung KI (2013) Ensiling of fish industry waste for biogas production: A lab scale evaluation of biochemical methane potential (BMP) and kinetics. Bioresource Technology 127: 326-336.
- Lay JY, Li YY, Noike T (1998) Developments of bacterial population and methanogenic activity in a laboratory-scale landfill bioreactor. Water Research 32(12): 3673-3679.
- Li Y, Zhang R, Liu X, Chen C, Xiao X, et al. (2013) Evaluating Methane Production from Anaerobic Mono- and Co-digestion of Kitchen Waste, Corn Stover, and Chicken Manure. Energy & Fuels 27(4): 2085-2091.
- Mu Y, Yu HQ, Wang G (2007) A kinetic approach to anaerobic hydrogen- producing process. Water Research 41(5): 1152-1160.
- Van Ginkel S, Sung SW, Lay JJ (2001) Biohydrogen production as a function of pH and substrate concentration. Environmental Science & Technology 35(24): 4726-4730.
- Wu X, Zhu J, Miller C (2013) Kinetics study of fermentative hydrogen production from liquid swine manure supplemented with glucose under controlled pH. Journal of Environmental Science and Health Part B-Pesticides Food Contaminants and Agricultural Wastes 48(6): 477-485.
- Zhu J, Zheng Y, Xu F, Li Y (2014) Solid-state anaerobic co-digestion of hay and soybean processing waste for biogas production. Bioresource Technology 154: 240-247.
- Zwietering MH, Jongenburger I, Rombouts FM, Vantriet K (1990) Modeling of the bacterial-growth curve. Applied and Environmental Microbiology 56(6): 1875-1881.
- Zedlewski J, Sobti S, Garg N, Zheng F, Krishnamurthy A, et al. (2003) Modeling Hard-Disk Power Consumption. FAST pp. 217-230.
- Blanch HW, Clark DS (1996) Biochemical Engineering. Mercel Dekker, Inc., New York, USA.
- Fan Y, Wang Y, Qian PY, Gu JD (2004) Optimization of phthalic acid batch biodegradation and the use of modified Richards model for modelling degradation. International Biodeterioration & Biodegradation 53(1): 57-63.
- Rajan K, Carrier DJ (2014) Effect of dilute acid pretreatment conditions and washing on the production of inhibitors and on recovery of sugars during wheat straw enzymatic hydrolysis. Biomass and Bioenerg 62: 222-227.?
- Singh K, Lee K, Worley J, Risse LM, Das KC (2010) Anaerobic digestion of poultry litter: a review. Applied Engineering in Agriculture 26(4): 677-688.
- Stafford DA, Hawkes DL, Horton R (1980) Methane production from waste organic matter. CRC Press Inc Boca Raton, Florida, USA.
- Nist S (2012) Engineering Statistics Handbook. FreeComputerBooks. com.
- Tchobanoglous G, Burton FL (1991) Wastewater Engineering: Treatment, Disposal, and Reuse. Irwin McGraw-Hill Boston MA, USA.


