


Angular Parameterization of Orthonormal Wavelet Filter Banks in Power Quality: A Method for Detecting Disturbances in the Voltage Waveforms
Diniz HC1, Uzinski JC2 and Ferrari JGP2*
1 Department of Electrical Engineering, Universidade Estadual Paulista, Brazil
2Department of Electrical Engineering, Universidade do Estado de Mato Grosso, Brazil
Submission: February 07, 2018; Published: May 29, 2018
*Corresponding author: Uzinski JC, Universidade do Estado de Mato Grosso, Rua das Gaivotas-325, Jardim das Nações-Sinop, Brazil.
How to cite this article: Diniz HC,Uzinski JC,Ferrari JGP. Angular Parameterization of Orthonormal Wavelet Filter Banks in Power Quality: A Method for Detecting Disturbances in the Voltage Waveforms. Robot Autom Eng J. 2018; 3(1): 555605. DOI: 10.19080/RAEJ.2018.03.555605
Abstract
Detecting transients in the voltage waveforms is one of the most important issues in power quality for both the preservation of equipment connected to the network, as well as the power supply. Among various techniques for detection of transients in electrical signals highlights, the wavelet transform is a method that can determine the instant when the disturbances occur and can detect different types in a same signal. The orthonormal wavelet filter banks yield a perfect reconstruction of a decomposed signal and if the regularity of the used wavelets is high, where the compression of the regular parts of the signal is good, and better evidencing of the singularities is at hand. In this paper, an orthonormal wavelet filter banks parameterization for detecting disturbances in the voltage waveforms is proposed. To evaluate the proposed methodology, some tests of detecting singularities in the voltage waveforms are presented.
Keywords: Angular parameterization; Orthonormal wavelet; Filter banks; Power quality; Waveforms; Voltage; Electrical signals.
Introduction
The power quality is a major concern of energy suppliers, equipment manufacturers, and users in general. Problems in power quality can be defined as any phenomenon that occurs in voltage, current or frequency deviation, resulting in failure or improper operation of equipment connected to the network.
Transitional situations in power systems are common and may occur due to lightning strikes, fault current, starting currents of large motors, or due to capacitor switching [1].
Such disturbances that arise in the system can cause several unwanted interference as sensitive equipment malfunction, distortions in measurement equipment, and even they can result in the interruption of power supply. What results in losses both for the energy concessionaires as for the consumers. Due to the increased use of electronic devices, it becomes increasingly necessary the care to the energy quality provided by the power utility [2].
In this paper, a sinusoidal waveform representing the voltage with a duration of 5 seconds is used, Figure 1, which is a signal in its ideal form, this is, without disturbance or interference. From this signal, the signals with disorders which is used in this work have been generated

Short term voltage fluctuations
Variations are considered as a short term duration when the duration is between 0, 5 cycle to 1 minute, whereas, these voltage variations are generated by energization of large loads or intermittent failures in the connections of the system cables. The failures that may occur in these situations are a sag, a voltage elevation, or complete interruption of the electrical system [2]
SAG: The voltage sag, is characterized as the occurrence of a brief drop in the effective voltage value for a certain time interval. Depending on the location of the fault and system conditions, a fault may cause a temporary decrease of 10 to90% in the effective value of the system voltage [3]. If the system voltage falls 30% or more, its condition is considered critical [4]. It is shown in Figure 2, a sag disturbance that lasts for three cycles.

This kind of disturbances usually occur by faults in transmission and distribution systems, and also it may arise due to energization of heavy loads, starting of large motors or the energizing of a transformer [2].
Voltage Elevation (Swell): Unlike the sag disturbance event, the voltage elevation (Swell) is characterized by a little increase in the system effective voltage, it is possible to occur an increase of 10% to 80% of the voltage, with duration of 0, 5cycle to 1 minute [3]. This shortfall may stress the delicate equipment components to premature failure.
This type of disorder can also be generated by system faults, and mainly with the phase-to-ground short-circuit. Also it may occur due to output of large blocks of loads or the energization of large capacitor banks, however, with a lower incidence [2]. The waveform of voltage swell is shown in Figure 3.

Interruption: The interruption of short duration is characterized as a momentary loss of voltage on a power system. An interruption which reveals a drop of 90% to 100% of the system voltage lasting for half a cycle to 1 minute is caused by faults in the power system, equipment failures and malfunctions of control systems [2].
It is also possible that the interruption occurs immediately after a voltage sag, which usually happens due to faults in the supply system. Sag will occur between the fault inception and operation of the protective device system. Figure 4 shows an example of interruption applied to the presented signal of Figure 1 [2].

Long term voltage fluctuations
Voltage variations are characterized as long-term when it occurs for a period of more than 1 minute. Having similar characteristics with the variations of short duration and usually caused by load variations and switching operations in the system.
Wavelet Transform - WT
The Wavelet Transform (WT) is a tool that allows the unification of a large number of techniques for analysis and processing. The development of wavelet theory occurred in the fields of Mathematics, Engineering and Quantum Physics. Currently may be included in: seismic geology, image processing, computational and human vision, radar and sonar, spectrometry, computer graphics, analysis of transients in power lines, and other applications [5].
A wavelet is a function 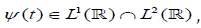 such that the
family of functions
such that the
family of functions
Where j and k are arbitrary integers as an orthonormal basis
for 
The Wavelet Transform is written in the form:

In (1) the values of a and b for the discrete values
a = am0 Andy are
constants has
are
constants has

The parameter b indicates the translation of the length in b the axis t , it is concluded that (1) provides a time-frequency description for f . The parameter a is the scale parameter.
The function ψa,b(t) has time and width adapted to its frequency: the ψa,b(t) under high frequency conditions is ‘narrower’, while under low frequencies, they are broad. This makes that the wavelet transform be more efficient for local analysis of short duration phenomena with high frequency, that not characterize stationary signals, such as transient in signals [6].
Formulation of sherlock & monro
The angular parameterization of orthonormal filter bankwas initially studied in [7], adapting the work of [8] infactorization of paraunity matrix and parameterizing the orthonormal wavelet space by a set of angular parameters. This parameterization can be used to adjust the wavelet, in order to improve the performance index of certain applications related to signal processing concerned.
The weights of the low-pass filter H and high-pass filter of the
filter bank are  , and the transfer functions of these
filters are given respectively by
, and the transfer functions of these
filters are given respectively by

where the length of the filter bank is 2N .
To ensure the condition of complementary between H and G , so that the FWT is invertible, the weights of gi(N ) are obtained from hi(N ) through a method called of ‘AlternateFlip’ in [9] as follow,

It follows that the orthogonal filter pairs can be completely parameterized by N angles αi,1 ≤ i ≤ N , that can take anyvalue in the set of real numbers, [10].
In the formulation of [7] and using [8], a recursive formulas to express the coefficients of hi(N ) are presented

where i = 0,1,..,2N −1.
According to [11-13], the parameterization based on (6) satisfies the conditions for orthonormality presented in [9],

Regularity of sherlock & monro wavelets
An important factor to be considered is the choice of the wavelet that should be used in the analysis of a given signal. In the decomposition of a signal by WT, properties such as regularity, smoothness and compact support are deterministic in the choice of wavelet to be used. The greater the number of vanishing moments of a wavelet, the smoother it is.
The formulation of [7] guarantees the orthonormality of the filter bank, on the other hand, it does not guarantee that the parameterized wavelet has a number of pre-determined vanishing moments; in this sense, [10] extend the formulation and present restrictions to guarantee up to two vanish moments and in [11- 13] the authors has made the extension to vanishing moments of at least three.
According to [7], in order to characterizing the WT filter bank and considering at least one vanishing moment it is necessary to taking into account the (9).

In order that the WT has at least two vanishing moments it is necessary to consider (10).

Equation (10) has a real solution if the angles i α satisfy the condition of (11).

According to [11-13], continuing with the reasoning, in order to obtain a third vanishing moment it is necessary to satisfy (12)

where 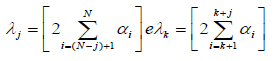
The equation (12) ensures the third vanishing moment, but the equation (12) has a real solution if the angles i α satisfy the condition of (13)

Detection of the Aggregated Disorders in the Voltage Waveforms
According to this idea and the previous restrictions, especially (12), a wavelet was obtained with three null moments. This wavelet is given from the set of angular parameters α = {−0.3033,−0.8243,1.6308,0.2822} and is denoted by ψ , which is shown in Figure 5.

First, the signal presented without disturbances, Figure 1, was analyzed using ψ . The Figure 6 shows the detail coefficients of the analyzed signal in the first (d1) and second (d2) decomposition levels usingψ . In the Figure 7, the scalogram which represents the percentage of energy for each wavelet coefficient is considered [14].


In the Figure 6, it can be seen that there is no presence of the detail coefficients with higher amplitude suggesting the absence of high frequency information. The concept of Figure 7 is the same as Figure 6, because there is no evidence of energy change at different times. This is expected since the signal is decomposed into ideal conditions, that is, without disturbances.
After analyzing the signal without disturbances, the analysis of signals with SAG, swell and interruption are made. In these cases the presented singularities in the voltage waveforms should be located according to the time in which they occur

Figure 8 reveals the presence of detail coefficients with greater amplitude at instants 1.5s and 2.75s, interval in which the SAG phenomenon occurs. The other parts of the signal are more regular, but in the interval 1.5s < t < 2.75s the amplitude of the detail coefficients is slightly smaller which in 0s ≤ t < 1.5s and 2.75s < t ≤ 5s. The Figure 9 is the best evidence of it, because it is observable that the percentage of energy in the range 1.5s < t < 2.75s is lower than of 0s ≤ t < 1.5s and 2.75s < t ≤ 5s, indicating the presence of a dip in the signal. Therefore through both figures it is concluded that at 1.5s minute starts a SAG which ends in 2.75s.


The signal with swell, Figure 3, was also analyzed using the waveletψ , Figure 5, with three vanishing moments. The decomposed signal in the first (d1) and second (d2) level is shown in the Figure 10. In the Figure 11 the scalogram is considered which represents the percentage of energy for each wavelet coefficient.
From Figure 10 the presence of detail coefficients with greater amplitude at instants 1.5s and 2.75s, interval in which the swell phenomenon occurs is realized. The other parts of the signal are more regular, but in the range 1.5s < t < 2.75s the amplitude of the detail coefficients is slightly lower which 0s ≤ t < 1.5s and 2.75s < t ≤ 5s. From Figure 11 it is more understandable the meaning of it, because it is observable the percentage of energy in the range 1.5s < t < 2.75s is higher than in 0s ≤ t < 1.5s and 2.75s < t ≤ 5s, indicating the presence of a swell in the signal. Therefore through both figures we conclude that the instant 1.5s minute starts a swell which ends in 2.75s.
The signal with an interruption, Figure 4, was analyzed using the wavelet ψ , Figure 5, with three vanishing moments. The decomposed signal in the first (d1) and second (d2) level is shown in the Figure 12. In the Figure 13 the scalogram is considered which represents the percentage of energy for each wavelet coefficient.


In the Figure 12 the presence of f detail coefficients with greater amplitude at instants 1.5s and 2.75s, interval in which the interruption occurs is realized. The other parts of the signal are more regular, but in the interval 1.5s < t < 2.75s the amplitude of the detail coefficients is zero differently that in 0s ≤ t < 1.5s and 2.75s < t ≤ 5s. The Figure 13 shows better the meaning of it, because it is visible the percentage of energy in the interval 1.5s < t < 2.75s is zero, as opposed that in 0s ≤ t < 1.5s and 2.75s < t ≤ 5s, indicating the presence of an interruption in the signal. Therefore, from Figures 12 & 13 we conclude that at the instant 1.5s starts an interrupt ending on 2.75s.
Conclusion
In this paper, signals with disturbances in the voltage waveform presented in the study of power quality are analyzed. To ensure the operation of equipment connected to the network the detection of these disorders is important, so it is interesting to develop efficient techniques to detect and identify the types of disorders.
The presented method for detecting disturbances in the voltage waveforms using angular parameterization of orthonormal wavelet filter banks with regular functions shows a good performance. For all the analyzed cases, the detection was accurate, showing the beginning and end of the disorder, of cases in which they are present in the signal.
The scalogram signal decomposed by the same wavelet with three vanishing moments reveals the nature of the phenomenon that occurs in the signal, since visually the detail coefficients at different parts of the signal may look the same when it does not identify high frequency information.
References
- Milind AG, Sandeep Kumar K, Santhosh Kumar BR, Sudheer ML (2008) Detection and estimation of voltage disturbances using Wavelet Transforms. Electromagnetic Interference & Compatibility, 2008. INCEMIC 2008. 10th International Conference on 2008, pp. 81-86.
- Dungan RC, Mcgranaghan MF, Wayne BH (1996) Electrical Power Systems Quality, MCGRAW-HILL.
- (1995) IEEE Recommended Practice for Monitoring Electric Power Quality, IEEE, p. 70.
- Huang SJ, Hsieh CT, Huang CL (1998) Application of wavelet to classify power system disturbances. Electric Power Systems research 47(2): 87-93.
- Daubechies I (1992) Ten lectures on wavelets. Philadelphia: Society for Industrial and Applied Mathematics
- Velho L, Carvalho PC (2000) Image processing and wavelets. Rio de Janeiro: Instituto de Matemática Pura e Aplicada.
- Sherlock B, Monro D (1998) On the space of orthonormal wavelets. Signal Processing, IEEE Transactions on 46(6): 1716-1720
- Vaidyanathan P (1993) Multirate Systems and Filter Banks. Upper Saddle River, NJ, USA: Prentice-Hall, Inc.
- Strang G, Nguyen T (2006) Wavlets and filter banks. Wellesley: Cambridge Press.
- Paiva H et al. (2009) On the space of orthonormal wavelets: Additional constraints to ensure two vanishing moments. Signal Processing Letters, IEEE 16(2): 101-104.
- Uzinski JC, et al. (2013) Additional constraints to ensure three vanishing moments for orthonormal wavelet filter banks. CMAC-CO, Cuiabá- MT 1: 16-19.
- Uzinski JC (2013) Vanishing moments and wavelet regularity in the fault detection of signals. (In Portuguese)Ilha Solteira, SP, Brazil.
- Uzinski JC, Paivaf HM, Villarealm F, Duarter MAQ, Galvão RKH (2015) Additional constraints to ensure three vanishing moments for orthonormal wavelet filter banks and transient detection. TEMA (São Carlos) 16(1): 17-29
- Mallat SA (1998) wavelet tour of signal processing. San Diego: Academic Press.


