Digital Mapping of Soil Types at Various Depth Based on CPT and SPT Da
Muhammad Afief Maruf*, Rusliansyah and Agil Arief Rachman
Department of Civil Engineering, University of Lambung Mangkurat, Indonesia
Submission: November 16, 2021; Published: November 30, 2021
*Corresponding author: Muhammad Afief Maruf, Department of Civil Engineering, University of Lambung Mangkurat, Indonesia
How to cite this article: Muhammad A M, Rusliansyah, Agil Arief R. Digital Mapping of Soil Types at Various Depth Based on CPT and SPT Data. Trends Tech Sci Res. 2021; 5(3): 555663. DOI: 10.19080/TTSR.2021.05.555663
Abstract
Digital mapping is the process by which a data set is compiled and formatted into a digital image. The main function is to produce maps that provide an accurate representation of a specific area. In the city of Banjarmasin, a lot of test data have been obtained which have a description of the type of soil at each testing depth. However, there is no information that summarizes the data, especially in the form of a digital map. Therefore, it is necessary to make a digital map which later can be used as a reference. With the help of a geographic information system (GIS), information such as field test results can be combined with other information such as laboratory soil test results. This research was conducted by compiling all data from soil testing results and making a map of soil types at each depth in Banjarmasin. The map produced show that the soil layer in Banjarmasin is predominantly clay up to 4m depth followed by a silty sand layer until 32m depth and a silty clay layer until 40m depth. This means that the soil surface conditions of Banjarmasin City are not suitable for the application of foundation construction with shallow foundation types, because the bearing capacity of soft soil is relatively small. In addition, with a soft soil depth of up to 4 m, the possibility of land subsidence that occurs is very large so it must be a concern when implementing construction in Banjarmasin City.
Keywords:Digital mapping; Geographic Information System; Soil type; Soil depth; Soil layer; Banjarmasin
Abbreviations:GIS: Geographical Information System; SPT: Standard Penetration Test; CPT: Cone Penetration Test; SBT: Soil Behavior Type; GPS: Global Positioning System
Introduction
Digital mapping (also called digital cartography) is the process by which a collection of data is compiled and formatted into a digital image. The main function of this technology is to generate maps that provide an accurate representation of a particular area, detailing main roads and other points of interest. Although digital mapping can be found in a variety of computer applications, such as Google Earth, the primary use of these maps is with the Global Positioning System, or GPS satellite network, which is used in standard automotive navigation systems.
In the current era, where the development of information technology is very rapid, many ways have been developed to display information to make it more attractive. Also, the information must be accurate and precise and integrated with the tabular information system, images, and graphics so that it is more informative. However, information systems are not geographically integrated. A geographic coordinate system is needed to find out the actual location on the earth’s surface from the source or result of that information. Therefore, an integrated information system with a coordinate system such as GIS (Geographic Information System) is needed.
Geographical Information System (GIS) is an integration of computer hardware and software to process, analyze, and manipulate data bound by geographic coordinates. GIS integrates all information on the earth’s surface. The information can be in the form of physical parameters such as soil surface elevation, soil moisture level, land use classification and others. In addition, other parameters such as the location of natural disasters or potential disasters can also be integrated. In GIS, this information is referred to as an attribute that expresses quality or character. To be integrated into a GIS, the information must have coordinates that refer to the shape of the earth’s surface [1].
With the help of GIS, information such as the results of soil testing in the field can be combined with other information such as groundwater levels, soil test results in the laboratory and other test results. In addition, the test location can be known in the format of geographic coordinates. The integrated information can be referred to as a database. Information on the results of soil testing in the field from a database can be modeled to produce a profile shape from the test results parameters such as a soil layer profile map. The results of the GIS are in the form of a digital map database and data in tabular form. Also in GIS, digital maps and table data can be linked and/or combined to form new maps. With GIS, almost all types of data can be computerized and integrated with other data.
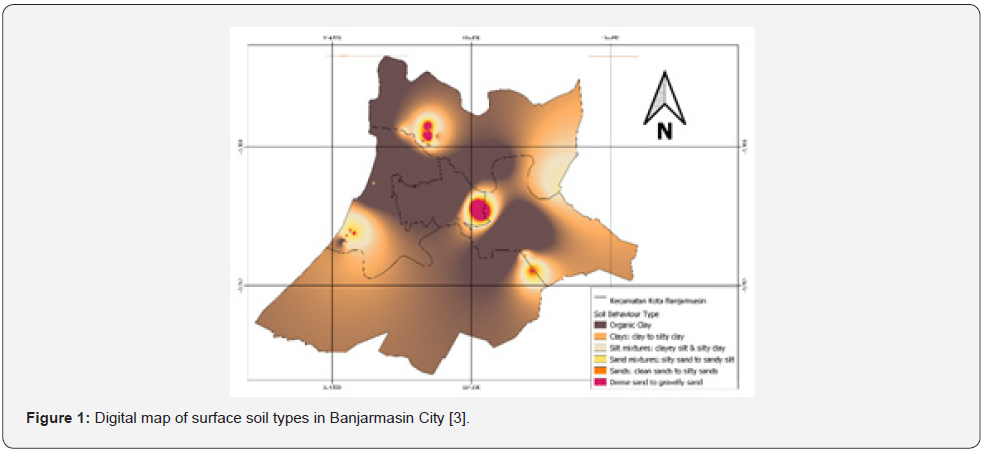
In a digital mapping study of the depth of hard soil in Banjarmasin City conducted by Maruf et al. [2] a map of the depth of hard soil in Banjarmasin City was obtained which provides information that the variation in the depth of hard soil in the city of Banjarmasin ranges from 28m to 42.4m. For the soil type of Banjarmasin City itself, Maruf et al. [3] have succeeded in mapping the type of soil on the surface layer which provides an overview of the type of soil on the surface of the City of Banjarmasin, as shown in Figure 1. This study continues the previous research by mapping the types of layers. soil at each depth variation throughout the city of Banjarmasin. This research was conducted by compiling all the data from soil testing and making a soil profile along the Banjarmasin city area with the help of GIS in the form of a digital map of the types of surface soil layers in the city of Banjarmasin. The results of the research are expected to be used for construction design purposes, especially foundation construction, in the city of Banjarmasin.
Materials and Methods
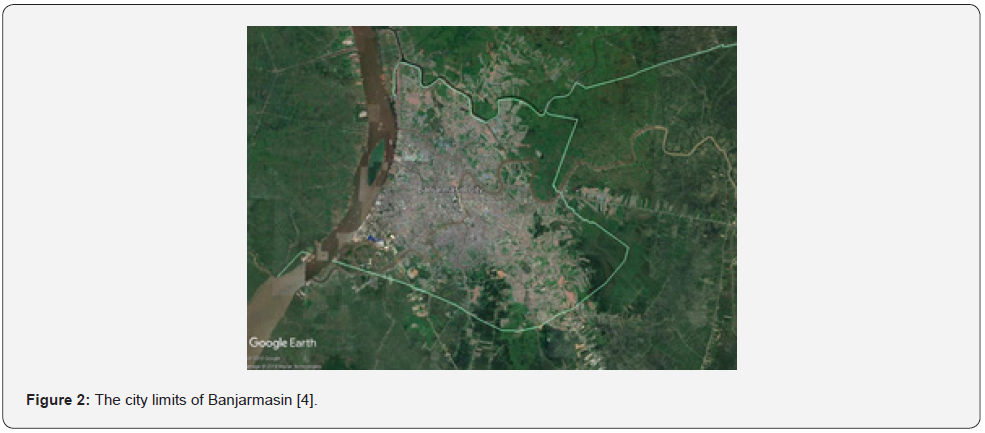
This research was conducted in the city of Banjarmasin which is geographically located between 3°16’46’’ to 3°22’54’’ south latitude and 114°31’40’’ to 114°39’55’’ east longitude. Banjarmasin City is bordered by Banjar Regency in the east and south and Barito Kuala Regency in the west and north. Banjarmasin City area is 98.46 sq km or 0.26% of the total area of South Kalimantan Province [4]. The city limits of Banjarmasin (Figure 2) are depicted by green lines.
The study was conducted based on research from Maruf et al. [3] by compiling all the data from soil testing and making a map of surface soil types along the city of Banjarmasin with the help of GIS. A total of 37 Standard Penetration Test (SPT) test points and 45 Dutch Cone Penetration Test (CPT) test points in the city of Banjarmasin were integrated with GIS in the form of a map of the types of soil layers in various depth. Both the SPT and CPT are the most common soil tests in the city of Banjarmasin. With these two tests, soil mechanical parameters can be found which are used to determine the type of soil behavior of each soil layer. The data on the results of soil testing used were obtained from the Soil Mechanics Laboratory, Faculty of Engineering, Lambung Mangkurat University and other sources.
The results of the SPT and CPT tests are linked by the equation (qc/Pa)/N60 to determine the type of soil and its behavior. This is based on the correlation of Robertson et al. [5,6] correlated the ratio (qc/Pa)/N60 with the mean grain size, D50 (varied from 0.001mm to 1mm). The N value in the SPT test results used corresponds to an average energy ratio of about 60%. Therefore, the ratio holds for N60, as shown in Figure 3.
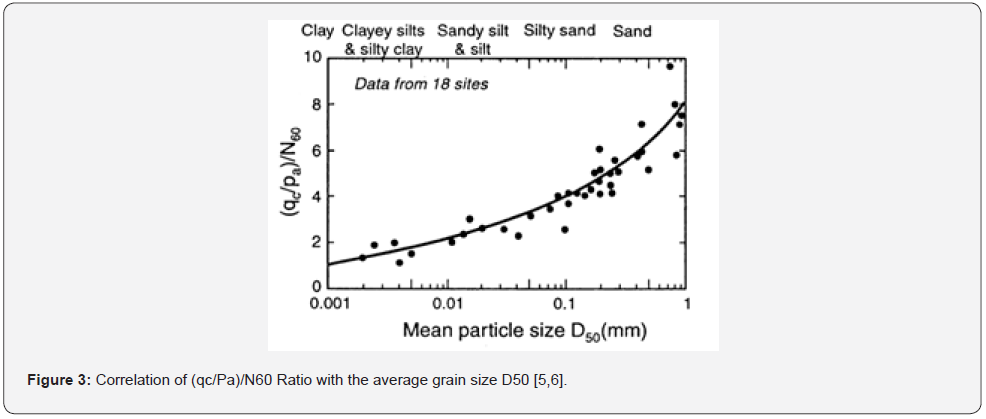
The value of qc is made dimensionless when dividing by atmospheric pressure (Pa) in the same units as qc. Robertson et al. [5,6] suggested the ratio (qc/Pa)/N60 for each zone of soil behavior type using a non-normalized CPT graph. The recommended ratio (qc/Pa)/N60 for each type of soil behavior is given as shown in Table 1. These values provide a reasonable estimate of the SPT N60 value from the CPT data. CPT data used in the form of qc where cone penetration is not corrected for soil pore pressure. This correlation itself has been proven to be quite effective for soil types in Indonesia, referring to research by Wahyudi et al. [7].

Results and Discussion
The data from the soil test results used were 37 Standard Penetration Test (SPT) test points and 45 Dutch Cone Penetration Test (CPT) test points scattered in the City of Banjarmasin and recapitulated and inputted the coordinates of the points of each test location. In this case, coordinate information is the most important parameter in GIS so that it can be plotted into GIS software. Coordinate data obtained in the soil test report is used as an absolute location indicator. If no coordinates are obtained, a relative location pointer is used, such as the name of the location or the name of the project. With the name of the location or the name of the project, the coordinates of the soil test are then estimated using Google Earth Pro software. Information obtained through soil test reports or Google Earth software is taken in decimal degree angle units [7].
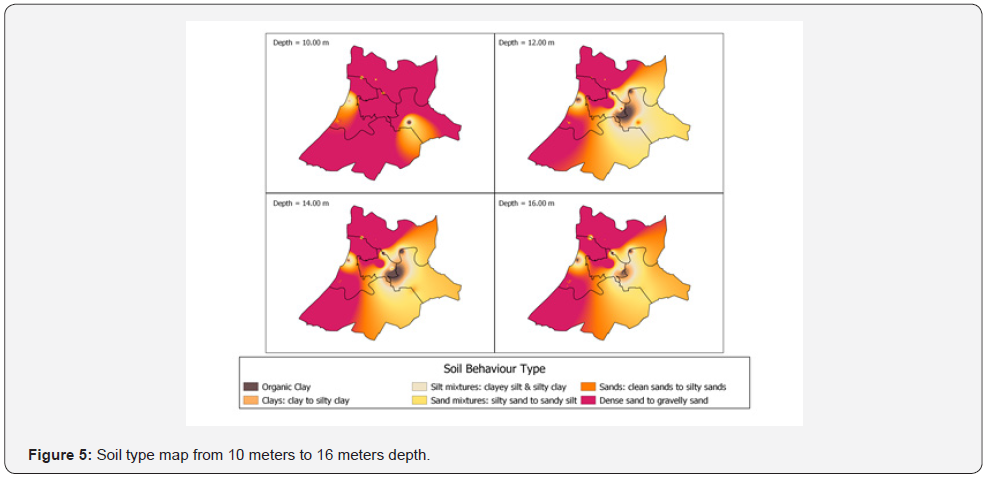
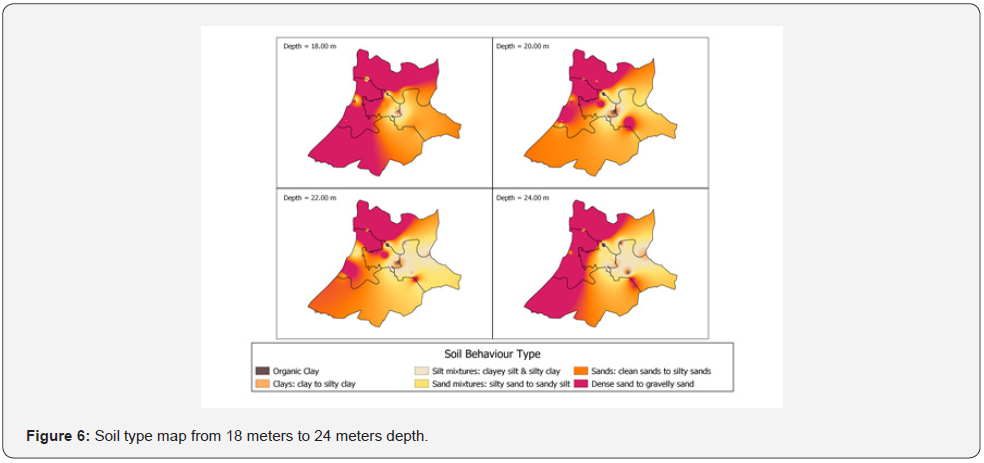
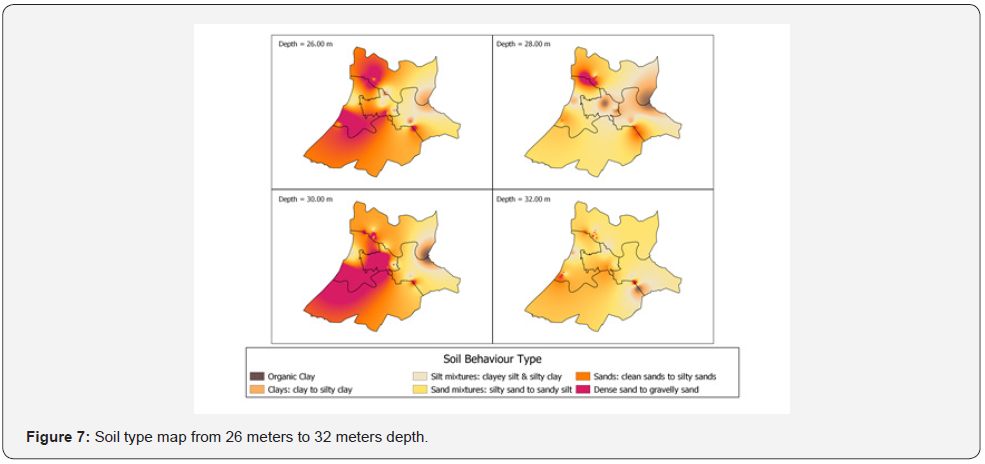
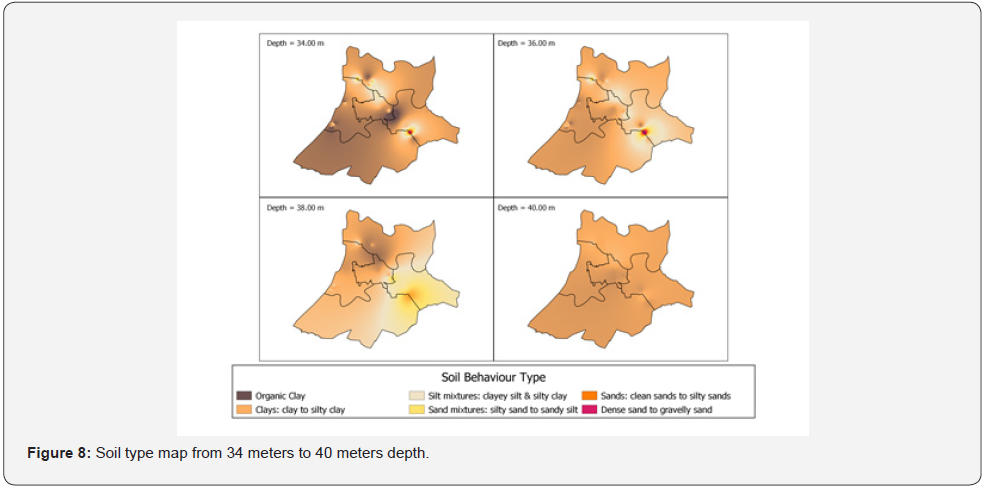
In determining the type of soil, the information taken from the soil test report using the SPT method is the N-SPT resistance value and the soil character according to the soil description. The information taken from the soil test report using the CPT method is the value of the cone resistance qc and the friction resistance fs. Cone resistance values qc and friction resistance fs are made in two different tables. This is necessary for convenience in the plotting and overlay stages in GIS software. This separation is necessary because in determining the type of soil based on the correlation (qc/Pa)/N60, the only data needed is cone resistance data qc. In making the N-SPT and qc data models, Quantum GIS (QGIS) is used with the IDW (Inverse Distance Weight) model as a spatial interpolation model to make the map. Furthermore, in determining the type of soil on the soil surface of Banjarmasin City, a correlation analysis (qc/Pa)/N60 was carried out spatially. The spatially calculated N-SPT and qc values using the IDW model are used as inputs in calculating (qc/Pa)/ N60. In the calculation of (qc/Pa)/N60, the cone resistance qc is used without correction to the pore pressure and the atmospheric pressure value is 1 atm or 1.03323 kg/cm2. The model is made based on the depth interval of every 2 meters below the ground surface to describe the type of soil at various depth in Banjarmasin City. The results of making a soil type map based on the Soil Behavior Type (SBT) correlation at each depth in Banjarmasin City can then be seen in (Figures 4-8).

f48
Based on the results of spatial data processing in Figures 4-8, it can be seen that the soil layer in Banjarmasin City is predominantly clay to a depth of 4m, followed by a layer of silty sand to a depth of 32m and a layer of silty clay to a depth of 40m. If the soil description is re-checked on the NSPT test report, then based on the soil description data from one of the soil tests, it states that at a depth of 2 meters it has a Soil Behavior Type (SBT) silty clay or clayey silt. This is reasonable because the cone resistance qc is not corrected for pore pressure for fine-grained soft soil at a depth of 2 meters. This shows that the map made can be used as a reference in planning construction in the City of Banjarmasin.
The results of this study provide information that the dominant soil layer in the surface layer in Banjarmasin City is clay to a depth of 4m, which is included in the category of soft soil. This means that the soil surface conditions of Banjarmasin City are not suitable for the application of foundation construction with shallow foundation types, because the bearing capacity of soft soil is relatively small. In addition, with a soft soil depth of up to 4m, the possibility of land subsidence that occurs is very large so it must be a concern when implementing construction in Banjarmasin City.
Conclusion
From the mapping results, it was found that the soil layer in Banjarmasin City is dominantly clay to a depth of 4 m followed by a layer of silty sand to a depth of 32m and a layer of silty clay to a depth of 40m. The results of this study provide information that the dominant soil layer in the surface layer in Banjarmasin City is clay to a depth of 4m, which is included in the category of soft soil. This means that the soil surface conditions of Banjarmasin City are not suitable for the application of foundation construction with shallow foundation types, because the bearing capacity of soft soil is relatively small. In addition, with a soft soil depth of up to 4 m, the possibility of land subsidence that occurs is very large so it must be a concern when implementing construction in Banjarmasin City. This shows that the map made can be used as a reference in planning construction in Banjarmasin City.
Acknowledgment
Acknowledgments are given to the University of Lambung Mangkurat for supporting this research by providing grants through the Institute for Research and Community Service under the Compulsory Research Scholarship Program for Lecturers. Acknowledgments are also given to the Soil Mechanics Laboratory, Faculty of Engineering, Lambung Mangkurat University, as well as construction partners in the City of Banjarmasin who have helped provide soil testing data for the implementation of this research.
References
- Fazal S (2008) GIS Basics. New Delhi: New Age International Publishers. New Delhi, India.
- Maruf MA, Rusliansyah FU, Rachman AA (2019) Digital Mapping of Hard Soil Depth in Banjarmasin City. International Journal of Engineering and Technology 11(5): 316-320.
- Maruf MA, Rusliansyah RAA (2021) Pemetaan Digital Jenis Lapisan Tanah Permukaan Kota Banjarmasin. AGREGAT 6(1): 487-492.
- Banjarmasin City Statistics Center (2020) Banjarmasin City in Figures 2020. Banjarmasin City Statistics Center. Banjarmasin, Indonesia.
- Robertson PK, Campanella RG (1983) Interpretation of cone penetration tests - Part I (sand). Canadian Geotechnical Journal 20(4): 718-733.
- Robertson PK, Campanella RG (1983) Interpretation of cone penetration tests - Part II (clay). Canadian Geotechnical Journal 20(4): 734-745.
- Wahyudi HD, Mutia D (2018) Interpretation of Static Cone Penetration Test (CPT/Sondir) Results at Fatmawati Soekarno Airport, Bengkulu. Aggregate 3(2): 229-234.


