


Investigation of Sedimentation Patterns of Amirabad Port (Caspian Sea) using a Coupled Hydrodynamic and Sediment Transport Model
Farhad Sakhaee1* and Mohammad Hossein Niksokhan2
1Department of Civil Engineering, Saint Louis University, USA
2School of Environment, University of Tehran, Iran
Submission: October 04, 2021; Published: November 01, 2021
*Corresponding author: Farhad Sakhaee, Department of Civil Engineering, Parks College of Engineering, Aviation and Technology, Saint Louis University, USA
How to cite this article: Farhad S, Mohammad H N. Investigation of Sedimentation Patterns of Amirabad Port (Caspian Sea) using a Coupled Hydrodynamic and Sediment Transport Model. Trends Tech Sci Res. 2021; 5(3): 555662. DOI: 10.19080/TTSR.2021.05.555662
Abstract
Aggradation and degradation within coastal areas occur frequently thus study such processes helps us in making pragmatic decisions to protect these areas against waves and currents. Waves and currents interactions degrades downstream side of coastal structures also results in sedimentation at the upstream side and makes offshore structures such as breakwaters, groins, and jetties less effective or useless.
In this research pool of the Amirabad port and some eastern and western parts were modeled with MIKE 21 software. Hydrodynamic module (HD), Spectral Wave module (SW) and Sand Transport module (ST) have been used in this study. Wind and wave data, water surface elevation, and hydrographic points from the bathymetric surveys have been used in hydrodynamic module of Mike 21 wherein the output of HD were used as an input of ST. Radiational stresses which are the output from SW module introduced to the HD model. Sediment transport direction was compatible with the counterclockwise circulation of the Sothern part of Caspian Sea. The result of ST module showed that the direction of sediment transport varies with the direction of approaching waves, but the main direction considering dominant waves is from northwest of the Caspian Sea to the southeast. Also, net rate of sediment transport is from west to east. By approaching the main breakwater arm from the west side sediment transport rate decreases which implies deposition occurs behind the western arm, and by moving further to the east erosion occurs.
Keywords:Numerical simulation; Sediment pattern; Wave and currents; Erosion; Amirabad port
Abbreviations:WSE: Water Surface Elevation; ST: Sediment Module; HD: Hydrodynamic Module; SW: Spectral Wave Module; ST: Sand transport
Introduction
Ports play crucial role in daily activities. They are mainly used for navigation channels, as well as transportation of goods and people. By the industrial revolution, marine transportation became much more important than before thus, the need for creating a calm and safe place for ship anchorage was inevitable. In this study, sediment pattern of Amirabad Port was modeled, and the sediment transport behavior was deciphered regarding to the counterclockwise circulation for southern part of Caspian Sea.
Model objective
The main objective of this research was to develop a hybrid hydrodynamic and sediment transport model to investigate sediment transport pattern at Amirabad in which results showed compatibility with counterclockwise current direction available at the southern part of Caspian Sea [1]. The result of this study may suggest an annual dredging program to avoid sedimentation in the area.
Background information
Industrial zone of Amirabad port located at east side of the Mazandaran province at 51km to the city of Sari. Initial constructional plan for this port goes back to 1987 which includes a breakwater and a small fishing platform. Construction began in 1996 after the design phase and, opened to facilitate navigational purpose in 2001. The bed martial of the coastal areas for the Amirabad domain mainly include fine sand with few silts. Based on the collected samples from the seabed within the domain of the area, bed materials are well graded sand SW with d50 = 0.22 mm.
Currents of the Caspian Sea are induced by winds and irregularities of bed morphology and divided into three main branches
a) Northern currents
b) Central currents
c) Southern currents
The direction of these currents is counterclockwise. Amirabad is influenced by the southern current and the direction is from west to the east.
Study area
Amirabad is located at southeast of Caspian Sea, with the longitude of 36.51 North and Latitude of 22.53 East which is shown in Figure 1. Amirabad is one of the northern ports at the south-east part of the Caspian Sea and its distance to the nearest breakwater is almost 10km (Figure 2).


Materials and Methods
Hydrodynamic processes can be simulated with different models such as Mike, Delft etc. In this study Mike by DHI (Danish Hydraulic Institute) has been applied to develop a hybrid hydrodynamic and sediment transport model. Mike 21 is a comprehensive model which can mimic hydrodynamics processes. Mike 21 is based on flexible mesh approach within the coastal areas and deltas of rivers. Sediment pattern of Amirabad was studied due to interactions between waves and currents. Simultaneously applying HD and ST modules of Mike 21 results in hybrid models in which HD and SW modules are the foundations for ST module. The output of SW is introduced into HD module and the output of the HD are the initial input for ST module [2].
MIKE 21 and its governing equations
Mike 21 solves two/three-dimensional incompressible Reynolds averaged Navier-Stokes equations which are subjected to assumptions of Boussinesq and of hydrostatic pressure. Hydrodynamic module (HD) can be coupled to sediment Module (ST) to investigates sediment pattern. Non-cohesive and cohesive sediments can be simulated by sand transport module and mud transport module, respectively. The choice between 2D and 3D model depends on several factors. For example, in shallow waters, wind and tidal current are often sufficient to keep the water column well-mixed, i.e., homogeneous in salinity and temperature. In such cases a 2D model is sufficient [3]. Shallow water equation is obtained directly from the Naiver-Stocks equations by considering these assumptions
a) density is considered constant
b) Turbulence represents by eddy viscosity
c) Hydrostatic pressure distribution is taken constant over the depth
Governing equations
a) conservation of mass
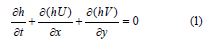
b) conservation of momentum
Inertia/momentum, gravity, Coriolis, bed, and surface friction as well as eddy viscosity considered as dominant equations. Modeling procedure consists of three major parts: Part-1: data gathering from both Maritime organization and National Cartographic Center including wind and wave data, water surface elevation (WSE), and hydrographic points. Part-2: Mesh creation for Amirabad port and some areas to the east and west. Part-3, by considering current’s parameters and applying the sediment gradation, hydrodynamic and sediment transport modules of Mike by DHI were coupled together, ran simultaneously and the results presented as the outcome of this research.
Model input
Available information to develop a conceptual model for sediment transport of the area include Bathymetric maps of the area, statistical of wave and wind data in the area for a specific time, water level elevation data as well as gradation of bed materials, which are all provided from maritime organization. This information presented as below:
a) bathymetric map
b) Wave data, including significant wave height and period
c) Wind data: (3 hours’ collection intervals)
d) Water surface elevation data (WSE) based on 10-minute increments over a 1-year timespan
e) Sediment gradation including D50 = 0.22 mm (based on ASSHTO. Soil of the area is Silty sand (SM).
By delineating the boundary of the model based on the bathymetric data water surface elevation and the boundary condition assigned to the model. Three open boundaries to the sea assigned to the model by the water surface elevation which is constant in time and varying in domain. Boundary delineation is shown in Figure 3. A triangular mesh created and assigned to the domain including 1053 nodes and 1195 mesh elements as presented in Figure 4.
Two months’ period was applied to the model, and for having a sufficient coverage a time interval of 30 minutes considered as a time step. First the boundary was delineated in google earth based on the available hydrographic data (Figure 5a) and a TIN was created as mesh for the domain, then the boundary divided into three water boundaries (red) and one land boundary (green) (Figure 4) and finally by applying the WSE and the hydrographic data the bathymetric model of the domain was created (Figure 5b). 3D mesh of Amirabad was plotted both with MIKE animator and MATLAB which are shown in Figure 6a & 6b respectively.
Model setup
Convergence of the model is a controlling parameter. In Mike by DHI the stability controlled by CFL Number which is also called Courant Number and defined as below:
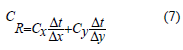
cx and cy are velocities in x and y directions. Δt is time interval and Δx and Δy are the spatial increments for a tidal wave velocity which comes from below equation:
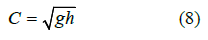
where g is gravity and h stand for water depth.


The model is stable when the CFL<1.
In this study time step considered to be 1800 seconds for the coupled HD and ST model to comply with Courant–Friedrichs– Lewy (CFL) criteria. By delineating the boundary and setting time step, various parameters for each module have been introduced to the model. Hydrodynamic, Spectral Wave as well as Sand Transport modules were described separately in details.
HD module
Most pragmatic approach in currents pattern observation is field investigation, unfortunately for large domains over a long period of time it is not achievable. HD Module is the base for many other modules such as ST. HD module can estimate water surface elevation and available currents in the area with respect to speed and direction. For model creation firstly based on the bathymetric data from maritime organization which includes 773 collected data points a boundary has been developed on google earth which is presented in Figure 3. Modeling area consists of 705389108.19 ft2 = 6553.28 hectare including the port and large areas to the east and west of it to observe the currents not only inside Amirabad pool but some further areas to the seas results in having a better estimation of sediment pattern. For HD module [4-15] tidal and wind data as well as boundary condition should be considered. Data which has been fed into the model are:
Wind data: includes one-year data 08/2002 -08/2003 by the time interval of 3 hours which will produces 365×8=2920 records.
Calibration
Eddy viscosity and bed resistance considered as the most influential parameters in model calibration. Eddy viscosity plays a crucial role in the stability of model which considered to be 5m2/s after some trial-and-error cycles. Bed resistance considered to be 50 and shallow water equation were used in the model to estimate the currents due to waves. In general Courant Number, less than one guarantees model stability.
SW module
Waves characteristics including height, period and length were calculated through computational cycles based on deep water information but for observation of offshore structure characteristic of nearshore waves should be considered. SW module [4-18] is a sufficient tool which includes nearshore activities such as shoaling and diffraction. Waves production, growth, and translation can be simulated due to SW module of Mike. Two approaches for wave modeling are
a) Directionally decoupled parametric formulation
b) Fully spectral formulation. Both are based on the wave power continuity equation
The first method is based on a finite difference approach by applying Alternating Direction Implicit (ADI) [19]. The second formula solved by Koman (1994) and Young (1999).
In this study, directionally decoupled parametric formulation was used. Two-month period with 30 minutes’ time steps considered to have a good coverage of the simulation interval.
(2×30×24×60)/30 = 2880 (Number of time steps)
30×60 = 1800 sec: Time step duration.
Constant for wave breaking are Gamma (ɣ) and Alpha (α) considered to be equal to 0.8 [20]. Bottom friction considered to be 0.002 for Nikuradse roughness value. The spectral discretization part the frequency is in the logarithmic scale with the minimum frequency of 0.055 Hz and frequency factor =1.1. Discretization was done in 15 directions, and each include 60o.
Directional discretization
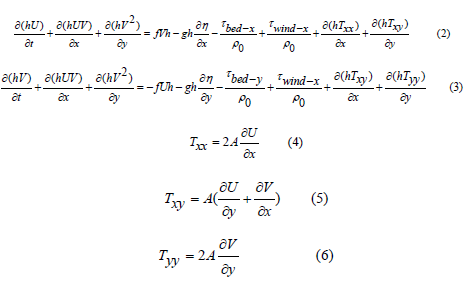
Spectral wave distribution may include an entire circle or a portion of circle. Due wave rose of the maritime organization discretization considered to be a ¼ of a circle (a 900 arc) which has been divided into 15 smaller part each represents for a 60 arc. The result of SW module is the radiational stresses (Sxx, Syy, Sxy) which replaced in the HD module and coupled to the ST module considering significant wave height and period to predict the sediment pattern as the outcome of ST module. Table 1 shows some of the SW module specifications.

Wave rose and wind rose were created from the wind and wave data and, presented in Figure 7a & 7b respectively which are used in hydrodynamic and sand transport modules.
ST module
Only bed material transport is considered in morphological development of alluvial environments hence bed load and part of suspended load will be considered. The interaction between bed load and alluvial bed is one of the fundamental aspects of morphological behavior of the channel [21-30]. In contrast with suspended load, it is assumed that bed load responds immediately to changes in local hydraulic conditions.
HD and ST modules y be run simultaneously in which the output of HD will be the input of ST module. Hybrid models are strong tools in bed level changes prediction considering on waves and currents interactions. In general, there are two sets of processes which mainly affect the sedimentation and erosion at the coastal areas. First are currents and the other is waves. Current study applies a coupled model which simulates the sediment pattern at Amir Abad port at the southern part of Caspian Sea.
ST module set up
Most important parameters for ST module are eddy viscosity, bed resistance, porosity and D50 and specific gravity of sediment particle. Eddy viscosity and bed resistance assumed to be 5 and 50 respectively, Specific gravity of the particles = 2.65, the porosity = 0.4 and, D50 = 0.22mm from the gradation results which is resented in Figure 8. ST module domain is the same domain for HD.


Results and Discussion
Figure 9a Shows Caspian Sea from a satellite image. Counterclockwise current of Caspian Sea presented below (Figure 9b). Figure 10a Shows the currents pattern from the simulation which is compatible with the counterclockwise current’s direction from PARKEA. Dickey results for the southern part of the Caspian Sea (Figure 10b).
Figure 11 complies with Figure 10 which is a good indicator of the erosion and sedimentation pattern within the modeling area. Maximum bed level changes shown in dark orange and red colors (Figure 11) Which happens inside the pool of Amirabad port and around the breakwater arms, either related to aggradation behind the western arm or degradation behind the eastern arm as well as some areas to the east.
Conclusion
Based on the results of the ST module the direction of the sediment transport is highly dependent to the direction of the waves introducing to the shore, but the main direction is from west to east due to dominant wave direction which is from northwest to the southeast of the Caspian Sea, also presented in Figure 7a (wave rose). Based on Figure 11. The total sediment transport rate is from west to the east. By approaching the breakwater from west sediment transport rate reduces which means the sedimentation occurs behind the western arm, and by going further from the eastern arm the rate of sediment transport increases which is an indicator of erosion at the outer side of the eastern arm and some areas to the east. For the western arm, to avoid the accumulation of sediment within decades which ends up with reducing the structural functionality of the arm, annual or semi-annual dredging program is needed. Eastern arm area needs to be studied further due to stability investigation and if needed the protection must be done. Another important fact is the rate of sediment transport which is higher near the shore due to two major reasons, first, near-shore currents have higher speed in comparison with further currents due to breaking effects of the waves by entering the shallow water areas. Second is mutual interaction of waves and suspended sediment in near-shore areas. Different options would be suggested to improve the efficiency of Amirabad port are briefly suggested as extending the western arm of the main breakwater, expanding the current entrance of the port as an entrance to the port to facilitate the transit of larger ships as well as regular annual or semi-annual dredging program to increase the depth of anchorage. Developing bypass channels or tunnels from the main arm (western arm) to the downstream side (eastern arm) to avoid the sediment accumulation at upstream from the source of sedimentation at upstream section, or as a controlling element during the emergencies and water crises events. Sediment accumulation estimation is also a key to effective design of head and truck of breakwaters encountering tidal currents [31].


Acknowledgment
Special thanks to Danish Hydraulic Institute for providing the license of the software and, thanks to Mikkel Andersen regarding his helps and considerations. Special thanks to Maritime Organization of Iran for providing the data for the current study.
References
- Dickey PA (1968) Contemporary nonmarine sedimentation in Soviet central Asia. AAPG Bulletin 52(12): 2396-2421.
- Sakhaee F, Khalili F (2021) Sediment pattern & rate of bathymetric changes due to construction of breakwater extension at Nowshahr port. Journal of Ocean Engineering and Science 6(1): 70-84.
- Sharbaty S (2012) Two-dimensional simulation of seasonal flow patterns in the Gorgan Bay. J Basic Appl Sci Res 2(5): 4382-4391.
- (2007) Institute DH, MIKE 21 flow model: Hydrodynamic module user guide p. 1-89.
- (2008) DHI MIKE 21/MIKE 3 flow model FM: Hydrodynamic and transport module scientific documentation. DHI Horsholm, Denmark.
- (2015) Module DMFMH Scientific documentation. DHI: Hørsholm, Denmark.
- (2011) DHI, MIKE 21. Spectral Wave Module. Scientific Documentation. DHI Water & Environment Hørsholm, Denmark.
- (2017) Institute DH, MIKE 21, MIKE 21 Flow Model, Hydrodynamic Module, User Guide, pp. 144.
- (2017) Institute DH, MIKE 21, MIKE 21 Flow Model, Hydrodynamic Module, Step-by-Step Training Guide, p. 42.
- (2017) Institute DH, MIKE 21, MIKE 21 Flow Model, Hydrodynamic Module, Scientific Documentation, p. 53.
- (2002) Engineers UACO, Coastal Engineering Manual. Engineer Manual 1110-2-1100. US Army Corps of Engineers, Washington, DC, USA.
- Valizadeh D, Kolahdoozan M (2011) Reducing sedimentation in riverine harbors using current deflecting wall. International Journal of Maritime Technology 6(12): 1-15.
- Dibajnia M, Mohsen S, FreydoonV, Seyed MH, Alireza K (2012) A shoreline management plan for Iranian coastlines. Ocean & coastal management 63: 1-15.
- Warren I, Bach HK (1992) MIKE 21: a modelling system for estuaries, coastal waters and seas. Environmental Software 7(4): 229-240.
- Ren M (1986) Comprehensive investigation of the coastal zone and tidal land resources of Jiangsu Province. Beijing: China Ocean Press 5.
- (2017) Institute DH, MIKE 21, MIKE 21 SW, Spectral Waves FM Module, User Guide, pp. 120.
- (2017) Institute DH, MIKE 21, MIKE 21, Spectral Wave module, Scientific Documentation, p. 56.
- Jose F, Stone GW (2006) Forecast of nearshore wave parameters using MIKE-21 Spectral wave model.
- Holthuijsen L, Booij N, Herbers T (1989) A prediction model for stationary, short-crested waves in shallow water with ambient currents. Coastal engineering 13(1): 23-54.
- Battjes JA, Janssen J (1978) Energy loss and set-up due to breaking of random waves. Coastal Engineering Proceedings. 1(16).
- Struiksma N, Olesen KW, Flokstra C, De Vriend HJ (1985) Bed deformation in curved alluvial channels. Journal of Hydraulic Research 23(1): 57-79.
- (2017) Institute DH, MIKE 21, MIKE 21 & MIKE 3 Flow Model FM, Sand Transport Module, Scientific Documentation p. 78.
- (2017) Institute DH, MIKE 21, MIKE 21 Flow Model FM, Sand Transport Module, incl. Shoreline Morphology, User Guide p. 88.
- (2017) Institute DH, MIKE 21, MIKE 21 Flow Model FM, Sand Transport Module, Step-by-Step Training Guide: Coastal Application p. 44.
- Engelund FA, Fredsøe J (1974) Transition from dunes to plane bed in alluvial channels. Institute of Hydrodynamics and Hydraulic Engineering, Technical University.
- Leo CVR (1984) Sediment Transport, Part I: Bed Load Transport.
- Davies A, Villaret C (1999) Sand transport by waves and currents: predictions of research and engineering models. J Geophys Res (C1), p. 1465-1488.
- Papanicolaou AN, Mohamed E, George K, Shwet P (2008) Sediment transport modeling review - current and future developments. Journal of Hydraulic Engineering 134(1): 1-14.
- Appendini CM, Paulo S, Tonatiuh ME, José L, Alec TF (2012) Longshore sediment transport on the northern coast of the Yucatan Peninsula. Journal of Coastal Research 28(6): 1404-1417.
- Langendoen EJ (1994) Flow patterns and transport of dissolved matter in tidal harbors.
- Sakhaee F (2021) Wave Runup for Nowshahr Breakwater at Tide and Ebb Scenarios. Journal of Brilliant Engineering 4: 10-14.


