


Optimization of Raw Material Yield Using Data Mining
Trung Pham1*, Teresita Hernández Toledo2 and Karla Moraga Correa2
1Information Technology Research Center, University of Talca, Chile
2School of Business Informatics Engineering, University of Talca, Chile
Submission: November 3, 2020;Published: December 03, 2020
*Corresponding author: Trung Pham, Information Technology Research Center, University of Talca, Chile
How to cite this article: Trung P, Teresita H T, Karla M C. Optimization of Raw Material Yield Using Data Mining. Trends Tech Sci Res. 2020; 4(4): 555643 10.19080/TTSR.2020.04.555643
Abstract
This project uses data mining to group the operational data of the dehydration process of the Granny Smith apple at the Agroindustrial Surfrut company so that an optimal point in the operation can be identified. This approach is selected because the operational data is so complex that it is not possible to model it in a mathematical expression necessary to identify an optimal point through mathematically solving an optimization problem. The optimal point identified in the data mining will be used by the company Agroindustrial Surfrut to lower operating costs while maintaining the quality of its products, allowing a competitive advantage in the national market.
Keywords: Data mining; K-means method; Dehydration process; Statistical method
Introduction
A food production process [1] is a process that takes edible material and prepares it to a point of sale to consumers. Preparation steps can usually be tailored according to the type of food, the salable point of preparation, consumer expectations, consumer demand, etc. Specifically, in the context of this work, the dehydration process [2] for the Granny Smith apple [3] is considered, where a flow of hot air evaporates and removes the water content in the fruit. The hot air temperature will scale the temperature of the fruit and evaporate its water content into air, and the air flow will remove this water vapor. These variables are adjusted to achieve the quality of the final dried fruit product. An important factor that must be considered to operate this process is the energy consumption that proportionally affects the cost of the operation.
In a company, the operating cost must be optimized [4] in a common routine to increase its competitive advantage [5] through better work efficiency [6] , better profit margin [7] , low price of the products offered, etc. In dehydrating apple fruit, the use of energy to scale the air temperature and move the hot air flow significantly contributes to the cost of the operation. Therefore, this energy cost must be minimized in a constraint [8,9] to maintain the good quality of the final product (dried apple). If a company can minimize its cost of operation, the Agroindustrial Surfrut company, the sponsor of this project, which produces dried apple through the dehydration process, already maintains a set of historical data during its existence. Due to the fact that there is no mathematical model relating precisely the variables independent and observable with the quality of the final product and energy to solve an optimization problem that maximize the quality of the dried fruit while that minimize energy consumption, The use of data mining is proposed to discover the values of the independent and observable variables that provide the optimality [10,11] of the operation of the dehydration process of the Granny Smith apple.
In this work, the data mining process [12,13] is applied to a large data set in many dimensions, with each dimension representing an observable variable of the dehydration process. This set is divided into multiple clusters through the K-means method [14,15] based s on the similarity of the data in the data grouping step. Each cluster is analyzed to extract a set of parameters that represents the cluster. All the clusters are compared with each other to determine the cluster that delivers the best performance in terms of quality dried fruit and energy consumption. The parameters that this cluster represents are considered the optimal values for the independent and observable variables of the dehydration process.
Background
In the optimization of a process, said process must be modeled in a mathematical expression representing it. This expression is formulated in an objective function that must be optimized in the sense that a minimum point of the objective function is found. Figure 1 shows three steps in this process with an arbitrary threedimensional example. In this example, the x and y dimensions represent the independent variables, and the z dimension represents the cost dependent variable. C hen data is formable a function analytic is constructed in the form of a mathematical expression as a model representing the data. With this model, an optimal point can be calculated analytically in a systematic and precise way. However, data is not always modellable, and the approach of modeling it with mathematical expression cannot always be used.
In the first step of Figure 1, data is collected for various scenarios during the operation of a process. When these data can sufficiently represent the process, they can be modeled in a mathematical expression with calculated parameters based on minimizing the error between the mathematical expression and the collected data. This minimization is formulated in an error optimization problem where the error is minimized without constraint as in the following:
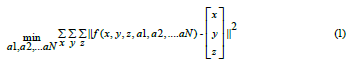
where a1, a2, ..., a N are parameters and x, y, z are variables of the function f (·), and the operator || · || is the norm operator that calculates the magnitude of a vector. Minimize the objective function in (1) is a routine task ria to solve a system of equations
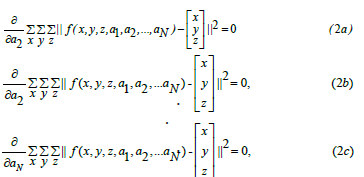


as shown in Figure 1 (c).
When the data are not formable s as shown in Figure 2 (a), look for another approach to determine the optimum point in these data. In this case, the use of data mining is recommended to discover the desired solution. In general, examining each data point can yield a point that contains the minimum value of the z component in the number sense, but this point could not represent the optimal point when there are many fluctuations in the data. For this reason, it is better to determine the sweet spot in a collective effort based on the data in a data cluster of a similar nature. Therefore, it is required to identify data clusters in which each cluster only contains data of a similar nature.
Figure 2 shows the case of non-modeling data with the use of the data mining approach to determine an optimal point. In this approach, clusters of data are identified in the segmentation step, with case results shown in Figure 2 (b). For each cluster identified in the segmentation step, its data is analyzed to find a representation of that cluster. In this rendering step, there are two methods: statistical method and deterministic method. Statistical method requires establishing a statistical model with a density distribution function where this function must be determined. The mean of the data is calculated according to its density distribution function. Deterministic method is simpler with the mean of the data being calculated according to the averaging function with an implication that the density of the data is uniformly distributed. Figure 2 (c) shows the cluster medium that represents the sweet spot.

Methodology
In this work, the data mining methodology is selected to determine the optimal point of a data set of the Granny Smith apple dehydration operation at the Agroindustrial Surfrut company, which is the sponsor of this project. Although the data mining methodology normally consists of four steps: segmentation, representation, compaction, and classification [12,13] In the context of determining the sweet spot, only the first two steps are required of segmentation (to determine clusters of data of a similar nature) and rendering (to determine the sweet spot in each of the clusters).
Due to the statistical nature of the data not known at the beginning of the project, the K-mean method [15] was selected, which is deterministic for data segmentation in clusters. This method has a computational advantage over the other deterministic method, hierarchical method [16], for segmentation. The K-medi method or is based on the distance formula to measure the similarity between two numeric data points. If this distance is small, these two numerical data points are said to be similar. When two data points are similar, they are assigned to the same cluster. Due to the use of the distance formula, the shape of each cluster tends to be a circle, a sphere, or a hypersphere [17,18].
The K-mean method begins with a set of data, and the assumption that there are N clusters in this set. Initially, the centers of these N clusters are assigned with arbitrary data (commonly with random numbers s). With this initial condition, the K-mean method is performed in iterations, with each iteration consisting of the following steps:
a) for each data point, the distance from this point to each center of the N clusters is calculated
b) the minimum distance is selected, and the point is assigned to the cluster that has the minimum distance to this data point
c) after all data points are assigned to the clusters, the center of each cluster is recalculated, and
d) if there are changes in the centers of the clusters, repeat steps (a) to (d)
e) if there are no changes the iterations are terminated and the assignments of the points to the clusters are the final result
Figure 3 shows the algorithm of the K-mean method. In Figure 3 (a), a data set is considered for segmentation through the K-mean method. In Figure 3 (b), it is assumed that there are 3 clusters in the dataset, and the centers of these clusters start with arbitrary numbers (-10, 10) for the red cluster, (-5, -5) for the blue cluster, and (10, -10 ) for the green cluster. In Figure 3 (c), the data point (-9, -9) is considered with respect to the centers of the three clusters, with the distances from this point to the centers calculated. In Figure 3 (d), the distance from the point (-9, -9) to the center ( -5, -5) of the blue cluster is selected because it is the minimum distance between the three distances calculated in Figure 3 (c) , and the point ( -9, -9) is assigned to the blue cluster. In Figure 3 (e), all other data points are assigned to the clusters in a similar way, and then the centers of the clusters are recalculated. In Figure 3 (e), the termination condition is examined.
It is important to note that a guess of how many clusters exist within the dataset is required at the start of the K-mean method. In Figure 3 of 2-dimensional data, it is easy to verify the riddle with visual inspection. However, the purpose of using 2-dimensional data is to illustrate the concept of the K-mean method in which each step can be visualized and verified by visual inspection. In reality, when data is in many dimensions, it is not possible to verify through visual inspection whether the guess of how many clusters there are is correct. In this case, another verification technique must be developed. Considering the case of 2-dimensional data in Figure 4 (c). By visual inspection, it is clear that there are three clusters in the dataset. However, if the initial guess is wrong, there will be some overlapping clusters as shown in Figure 4 (d) and Figure 4 (f). When the initial guess is correct as in Figure 4 (e), there will be no overlapping clusters.

To detect whether the initial guess is correct or incorrect, the number of overlapping clusters must be considered in the results of segmenting a dataset. In Figures 4 (a) and 4 (b), these two overlapping and non-overlapping cluster scenarios are demonstrated. While these two scenarios are easy to verify with human eyes in cases of 2-dimensional or 3-dimensional data, it is much more difficult to do so in cases of 4 or more- dimensional data. For this reason, a simple method is developed to detect overlapping clusters through numerical analysis: for each cluster with its center and radius already determined, it is drawn a circle around said cluster as a boundary separating it from other clusters. In Figure 4 (a), when there is no overlap between two clusters, the distance between their centers is more than the sum of their radii. In Figure 4 (b), when there is overlap between two clusters, the distance between their centers is less than the sum of their radii. These descriptions are converted into mathematical expressions in the following:
Rule 1: D (C1, C2) ≥R1 + R2 ⇒there is no overlap, (5)
Rule 2: D (C1, C2) < R1 + R2 ⇒there is overlapping, (6)
Where D (·, ·) is the distance function between its two inputs, C1 and C2 are the centers of cluster 1 and cluster 2, and R1 and R2 are the radii of cluster 1 and cluster 2. Converting (5) and (6) in simple expressions that are implementable in computers, we obtain:

Rule 1a: D (C1, C2) -R1 -R2 ≥0 ⇒there is no overlap, (7)
Rule 2b: D (C1, C2) -R1 -R2 <0 ⇒there is overlap, (8)
The examples in Figures 4 (d), 4 (e), and 4 (f) can be analyzed by overlapping by examining the value of θ1,2 = D (C1, C2) -R1 -R2. By this approach it is necessary to calculate the value θn,m for each pair of clusters n , m possible , and then identify the values of θn,m, m that represent overlapping.
In Tables 1-3, the values of θn,m are calculated for three scenarios shown in Figures 4 (d), 4 (e), and 4 (4), respectively. In Table 1, there is overlap between cluster 1 and cluster 2. In Table 2, there is no overlap between the three clusters 1, 2, and 3. In Table 3, there is overlap between cluster 3 and cluster 4. Therefore, it is easy to conclude that the initial 3 cluster guess is correct because it results in no overlap between the resulting clusters. Considering the examples of the initial riddles to satisfy the requirement of the K-means method of knowing the cluster number, it is possible to arrive at the correct riddle by performing many segmentations, with each segmentation corresponding to a riddle and analyzing the values of θn,m of each segmentation to identify overlaps between the resulting clusters. The segmentation that contains no overlap or minimal overlaps is said to be the preferable segmentation because the initial guess is more likely to be correct than other segmentations.


Numerical Results
In this section, the actual data from the Agroindustrial Surfrut company are analyzed in the context of data mining described in the previous methodology section. This data has 13 fields for each record. Table 4 shows the names of the fields and their respective descriptions.

Due to the requirement to know the number of clusters in the K-mean method of segmentation, this number has to be guessed. However, a divination is not true a correct divination. Therefore, segmentation is performed with many guesses, and segmentation is evaluated with minimal overlap between clusters results. In this work, the segmentation is done with five guesses of 2 clusters, 3 clusters, 4 clusters, 5 clusters, and 6 clusters. Overall, these numbers are commonly encountered in making segmentation: If a data set has more than 6 clusters, it is said that the whole is too fragmented and should not analyze it.
In the first case of 2 clusters, the results are shown in Table 5, with the cluster analysis shown in Table 6. Table 5 shows the centers of two clusters, where the values of the components X5, X6, ..., X12 represent the characteristic of a cluster. This characteristic is discussed later if the segmentation of the dataset into 2 clusters is evaluated to be the best representation. Table 6 shows the result of the normalized data on the scale from 0 to 100 for each component. In this table, the values of the centers of the clusters are shown in the normalized scale, and the analysis of overlaps is carried out in the calculation of the matrix of indicators In,m = D ( Cn , Cm ) - Rn - Rm , where D ( Cn , Cm ) is the distance between the center of cluster Cn and the center of cluster Cm , Rn is the radius of cluster Cn , and Rm is the radius of cluster Cm . When In,m (separation between cluster Cn and Cm ) is negative, it means that there is an overlap between cluster Cn and cluster Cm . The segmentation with the least overlap is selected for the best guess on the number of clusters. Table 6 shows two clusters with order of magnitude spacing of 2 units. In this table, the separation of two clusters is (7-dimensional) is projected in the 3-dimensional environment for display.


The s Tables 7 & 8 show results for segmentation-based divination 3 cluster. Again, the gaps between the clusters are projected into the 3-dimensional environment for display. These separations are in the order of magnitude of 20 to 75 units, much better than the case of 2 clusters. Tables 9 & 10 show results for segmentation based on guessing of 4 clusters. In this case, there is an overlap between cluster 1 and cluster 2, as indicated numerically in the matrix of gaps indicators, and in the graph of their projections in the 3-dimensional environment. Tables 11-13 show results for the 5-cluster guess-based segmentation. In case of 5 or more clusters, the separations cannot be projected in the 3-dimensional environment for display. However, the C5 cluster in this case has no data, meaning that there are only 4 possible clusters, and the result is the same as the result of the 4-cluster case, with overlap between cluster C1 and cluster C2. Similarly, in the case of 6 clusters in Tables 14-16, clusters C5 and C6 have no data, meaning that there are only 4 possible clusters, and the result is the same as the result of the case of 4 clusters, with overlapped between cluster C1 and cluster C2.


Comparing the results between cases of 2 clusters, 3 clusters, 4 clusters, 5 clusters, and 6 clusters, the case of 3 clusters reaches the best separations between clusters (highest separations, and no overlaps). Therefore, it is concluded that the 3-cluster guess is appropriate, and the centers of the clusters can be analyzed in the context of identifying the cluster with the best operational performance.
Discussion
The centers of the three clusters extracted in the segmentation of the data set of the Agroindustrial Surfrut company on its operation of the apple dehydration process are summarized again in Table 17:
In this table, it is important to consider the variables X5 (amount in kg of dehydrated product), X6 (amount in kg of raw material processed), and X7 (number of hours required for production) to evaluate the operation. Because there are three variables under consideration, to determine the best cluster in terms of its operation, it is necessary to develop a formula that transforms these three variables into a scalar quantity for the purpose of comparing between these three clusters. To achieve efficiency, the number of hours per unit of processed fruit must be minimized, and the amount of water removed must be maximized. It is easy to calculate the number of hours per kg. of processed fruit by dividing the number of hours by the number of kilograms of processed fruit. Similarly, it is easy to calculate the amount of water removed by dividing the difference between the amount of fruit processed and the amount of dehydrated fruit by the amount of fruit processed, and the result is the percent mass of water removed. To combine the maximization of the amount of water removed and the minimization of the number of processing hours per kilogram of fruit, a linear combination with different weights is performed:
where α y β are weights representing the importance of these two criteria, y and J is the objective function to be optimized. Table 18 shows several scenarios with different sets of α y β to analyze the three clusters characterized by their centers shown in Table 17.


In Table 18, it is concluded that cluster C3 has the value of J optimized for α= 0.3 and β= 0.7, and also for α= 0.7 and β= 0.3. However, for α= 0.5 and β= 0.5, cluster C1 has the value of J optimized. Well, the selection of the weights α and β with emphasis on various criteria will determine the optimized solution. The products in optimized solution are related to their respective data in another data file with more operational information for the company to use to achieve its efficiency. This operating information will be used in the future to achieve similar efficiency.
Conclusion
In conclusion, data mining is effective in finding a solution to an optimization problem when there is an existing data set that represents the performance of a process, and this process cannot be modeled in a mathematical expression to formulate an optimization problem. in which its solution can be derived analytically. This approach is applied to the dehydration process of the fruit, with numerical results that will benefit the Agroindustrial Surfrut company that sponsors this project to optimize its operating cost.
References
- MooreCA (2012)Automation in the Food Industry. New York, NY: Springer.
- Torreggiani D (1993) Osmotic dehydration in fruit and vegetable processing. Food Research International 26(1): 59-68.
- AbbottJA, SaftnerRA, GrossKC, VinyardBT, Janick J(2003) Consumer evaluation and quality measurement of fresh-cut slices of 'Fuji,' 'Golden Delicious,'GoldRush,' and 'Granny Smith' apples”. Postharvest Biology and Technology 33(2): 127-140.
- Shrouf F, Ordieres MJ, García SA, Ortega MM (2014) Optimizing the production scheduling of a single machine to minimize total energy consumption costs. Journal of Cleaner Production 67(15): 197-207.
- BarneyJ(2014)Gaining and sustaining competitive advantage. Essex, UK: Pearson.
- EmrouznejadA, CabandaE(2014)Managing Service Productivity: Using Frontier Efficiency Methodologies and Multicriteria Decision Making for Improving Service Performance. New York, NY: Springer.
- Alifah A (2017) Analysis of Liquidity, Leverage and Profitability in Assessing Financial Performance with Good Corporate Governance as Intervening Variables. Journal of Management 3(3).
- MorganP(2015)An Explanation of Constrained Optimization for Economists. Toronto, Canada: University of Toronto Press.
- Birgin EG,MartínezJM (2014)Practical Augmented Lagrangian Methods for Constrained Optimization. Philadelphia, PA: Society for Industrial & Applied Mathematics.
- YongJ(2018)Optimization Theory: A Concise Introduction. Hackensack, NJ: World Scientific Publishing Company.
- Lasdon LS (2011)Optimization Theory for Large Systems. Mineola, NY: Dover Publications.
- AggarwalCC (2015)Data Mining: The Textbook. New York, NY: Springer.
- HanJ, KamberM, PeiJ(2011)Data Mining: Concepts and Techniques. Burlington, MA: Morgan Kaufmann.
- Wang J, Wang J, Song J, Xu XS, Shen HT, et al. (2015) Optimized Cartesian K-means. IEEE Transactions on Knowledge and Data Engineering 27(1): 180-192.
- Wu J(2012)Advances in K-means Clustering: A Data Mining Thinking. Berlin, Germany: Springer- Verlag.
- Devaraj S (2017) A Proposed New Algorithm for analysis of Hierarchical Clustering. Saarbrücken, Germany: Lap Lambert Academic Publishing.
- KirkDE (2004)Optimal Control Theory: An Introduction. Mineola, NY: Dover Publications.
- NiseNS (2015)Control Systems Engineering. Hoboken, NJ: John Wiley & Sons.


