Using Data Science to Establish Relationships between Key Railroad Engineering Parameters and Behavior
Allan M Zarembski*
*Department of Civil and Environmental Engineering, University of Delaware, Newark, Delaware, USA
Submission: February 12, 2018; Published: February 20, 2018
*Corresponding author: Allan M Zarembski, Department of Civil and Environmental Engineering, University of Delaware, Newark, Delaware, USA, Email: dramz@udel.edu
How to cite this article: Allan M Zarembski. Using Data Science to Establish Relationships between Key Railroad Engineering Parameters and Behavior. Trends Tech Sci Res. 2018; 1(1): 555552. DOI: 10.19080/TTSR.2018.01.555552
Abstract
The railroad industry is an infrastructure intensive industry that has found itself collecting large volumes of data due in part to the implementation of a new generation of sophisticated inspection and monitoring systems. These systems, which are being utilized to monitor infrastructure condition, optimize and plan maintenance, and improve safety, have resulted in an exponential growth in data collected. While traditional analysis of data, particularly "threshold” based analysis, are still being used, there is a growing awareness of and use of "Data Science” to provide new and innovative insights and an improved understanding of maintenance and safety issues [1,2].
Keywords: Data science; Railroad engineering; Infrastructure intensive industry; Big data
Introduction
Data Science is an interdisciplinary field using evolving analysis tools and techniques to extract knowledge or insights from data in various forms, either structured or unstructured. Data Science provides ways (and tools) to deal with and benefit from "Big Data”, to include ways to see patterns, discover relationships, and develop predictive analytic capabilities and to make sense of varied images, data streams and information. Data Science in railway engineering applications attempts to represent the complexities of huge volumes of both structured and unstructured data collected by the full range of inspection and management systems with the goal of obtaining new and useful insights into such phenomenon as track and equipment component degradation and failure.
Recent studies looking at the relationship between several key track measurement and failure parameters have provided such insights [3-6]. Two such studies will be briefly discussed here as examples of how Big Data can lead to not just insights, but actually predictive relationships that have direct and practical application in railroad engineering.
One such study examined the relationship between track geometry defects and rail defects, two separate and distinct classes of defects associated with different parts of the railroad track structure [3,4]. Rail defects are associated with failure in the rail itself, while track geometry defects, which represent degradation of the track geometry in either the vertical or lateral planes, are most commonly associated with failure in the rail supporting structure, such as the cross-ties, ballast or sub grade (soil).
In order to examine this relationship, the study correlated multiple years of track geometry with a data base of several years of rail defects obtained from a major US railroad. The railroad system data represented more than 35,000 track km, and included three years of rail defect data, representing approximately 50,000 defect records (which was subsequently narrowed to approximately 26,000 defects of "interest”), five years of track geometry data representing approximately 335,000 defect records, and traffic/tonnage data (in annual Million Gross Tonnes or MGT) [3,4].
Correlation and statistical analyses were performed and two sets of analyses relationships were developed. The first was a relationship between the life of rail (in cumulative MGT) and the presence of geometry defect(s). The second was a relationship between the probability of a rail defect occurring at a given location and the presence of one of more geometry defects at that location.
Initial correlation analysis showed that 11% of all rail defects were preceded by one or more track geometry defects. In contrast, if the relationship between rail defects and geometry defects were purely random the probability of a match at a given location was calculated to be 1.4% on curves; the results were even more dramatic, with 21% of all rail defects preceded by one or more geometry defects. Thus, the actual percentages of matches were of the order of 7 to 20 times that which would occur purely by random chance.
A series of statistical analyses, using Multivariate Adaptive Regressive Splines (MARS) analysis, were performed examining the relationship between the 'age” of the rail, at the time of defect occurrence and the presence of track geometry defects. The results showed a reduction in the time it took a rail defect to develop of between 20% and 44%, if a track geometry defect was present.
In addition to this reduction in "life” of the rail, a second series of analyses were performed looking at the probability of a rail defect occurring given a geometry defect preceding it. The Probability analysis approaches used included Random Analysis and Conditional Probability Analysis (Bayes' Theorem probability analysis, Naive Bayes probability analysis, and Bayesian network analysis). Figure 1 illustrates the Bayesian network model structure. The presence of four geometry defects (though not necessarily at the same time) prior to the development of the rail defect results in a probability of a rail defect occurring of 88.6% (about 500 times random).

The results of the analysis showed that the presence of a geometry defect has a strong and well-defined effect, with the probability of a rail defect occurring at the location where there was one of more preceding geometry defects being strong and significant. Thus, a single geometry defect increases the probability of a rail defect (from random) by 6 to 13 times, while multiple geometry defects will increase the probability of a rail defect (from random) by factors of up to 600 times. Thus 2 geometry defects increase the probability of a rail defect to approximately 10 to 20% depending on defect type, 3 geometry defects increase probability of a rail defect to approximately 40 to 50%, and 4 geometry defects increase probability of a rail defect to approximately 80 to 90%.
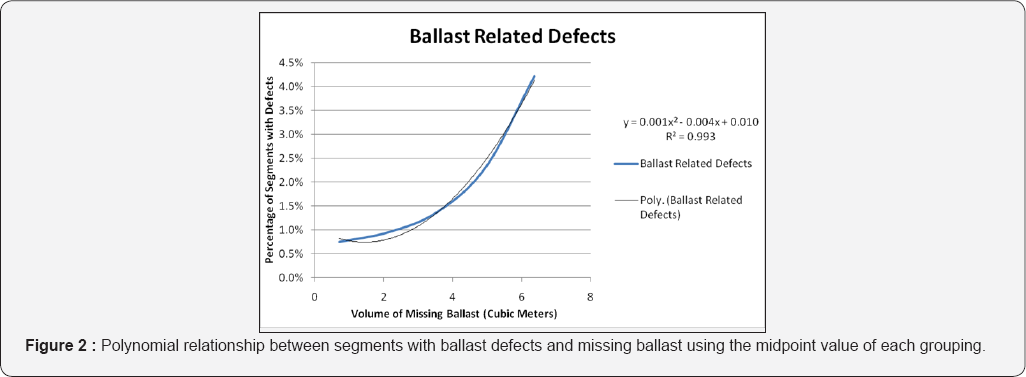
The second analysis looked at the relationship between missing ballast and the development of track geometry defects. This was a two-phase analysis with the initial phase [5] looking at ballast data taken from a major US railroad consisting of 187,025 segments, each approximately 15 meters in length, for a total length of approximately 2800 km of track. A total of 5440 geometry defects were reported within that stretch of track, distributed over 2278 segments, with many segments having multiple reported geometry defects. The second phase [6] broadened the analysis, looking at missing ballast volume data on 105,416 segments of data. The length of the segments had an average and median value of 5.6m (18.74 feet) and 15m (49.98 feet) respectively. A total of 22,919 track geometry exceptions were included in the data set.

Figure 2 shows the results of the first phase analysis, where the rate of development of ballast-related defects is positively correlated to the volume of missing ballast in a non-linear relationship Thus, this data strongly supports the idea that missing ballast section (specifically shoulder ballast) will contribute to the development of ballast related track geometry defects).
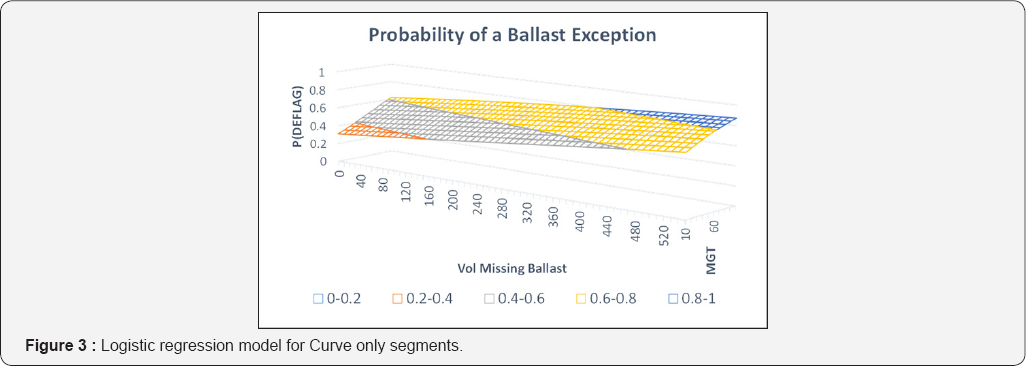
Figure 3 presents the results of the second phase analysis where a Logistics Regression Model is used to define the probability that a ballast related geometry exception or defect will develop in a given segment as a function of the volume of missing ballast and the annual traffic level (in MGT). Note that as a segment has increased volume of missing ballast, the probability the segment will contain a ballast related exception increases. This is also the case as annual traffic increases.

Thus, the second study shows that increasing volumes of missing ballast results in increases in the occurrence of track geometry defects, and in particular the ballast related track geometry defects, in those segments that have the missing ballast. The results provide a quantifiable relationship, in form of first a quadratic equation, and then a Logistics Regression model between missing ballast and the rate of development of segments with geometry defects.
These are but two examples of the increasing use of Data Science in the analysis of railroad inspection and condition data. They illustrate how "Big Data' analysis techniques are effective in dealing with large volumes and with large scale data bases where relationships between parameters are not always intuitively obvious. As such these "data science” tools (e.g. MARS, Bayesian analysis, Logistic Regression, etc.) within the Big Data paradigm can be applied to other areas where large scale data bases are available but have not been used for anything but the most basic exception reporting and data base uses.
Furthermore, the results presented here show that Data Science can be used to provide models to predict the probability that a given track segment will generate defects or exceptions as a function of key independent variables such as currently obtained by railroad inspection vehicles. This methodology shows real promise in its potential for development of "practical” tools that can be used by railroads in their maintenance planning and management processes. Such "practical” models would allow railways to plan and prioritize maintenance based on a number of factors, such as component condition, annual tonnage, curvature and other data to be explored. This allows for proper prioritization by considering interactivity of predictors which is inherent to Data Science models, and not just looking at simple threshold exceedances.
References
- Zarembski AM (2014) Big Data in Railroad Engineering. IEEE Big Data Conference, Washington DC, USA.
- Zarembski AM, Attoh-Okine N (2017) Big Data in Railroad Engineering: The Challenge of Vast Amounts of Data. Railway Track & Structures pp. 28-30.
- Zarembski AM, Attoh-Okine N, Einbinder D (2016) On the Relationship between Track Geometry Defects and Development of Internal Rail Defects. World Congress on Railway Research, Milan, Italy.
- Zarembski AM, Attoh-Okine N, Einbinder D, Thompson H, Sussman T (2016) How Track Geometry Defects Affect the Development of Rail Defects. American Railway Engineering Association Annual Conference, Orlando, FL.
- Zarembski AM, Grissom GT, Euston TE, Cronon JJ (2015) Relationship Between Missing Ballast and Development of Track Geometry Defects. Journal of Transportation Infrastructure Geotechnology 2(4): 167-176.
- Zarembski AM, Palese JW, Euston TE (2017) Correlating Ballast Volume Deficit with the Development of Track Geometry Exceptions Utilizing Data Science Algorithm. Journal of Transportation Infrastructure Geotechnology 4(2-3): 37-51.


