The Effect of User-Generated Image Pixel Quality on User Experience: A Scenario-Based Experiment in Social Media
Lu Zhao1* and Jialing Li2
1Beihang University, School of Economics and Management, China
2Baidu Inc, China
Submission: September 29, 2021; Published: October 06, 2021
*Corresponding author: Lu Zhao, Beihang University, School of Economics and Management, China
How to cite this article: Lu Zhao, Jialing Li. The Effect of User-Generated Image Pixel Quality on User Experience: A Scenario-Based Experiment in Social Media. Psychol Behav Sci Int J .2021; 17(5): 555971 DOI: 10.19080/PBSIJ.2021.17.555971.
Abstract
The study investigates the influence of the pixel quality of user-generated images on user experience of watching pictures posted on social media. We identify the pixel quality as the dimensions of image quality, and aesthetic feelings, emotion, purchase, continued search and recommendation as the sub-dimensions of user experience measurement. We design scenario-based experiment to investigate the relationship between pixel quality and user experience. This paper can offer a new theoretical and practical perspective on user experience, image quality and user generated image field.
Introduction
The proliferation of social media platform greatly transforms the way people interact with physical products. Among all kinds of social media content, one type of information is worthy of further research: image. Consumers are inclined to view photograph to get the first impression of products for a short period, which is an effective avenue of tangibilizing intangible experience [1]. Users share them in social media to self-projecting and self-branding [1-15]. The implication of UGI not only facilitate other users to comprehend product-related experience, but also help marketer to unlock users’ intangible, subjective and ultimately personal user experience [2,16]. Accordingly, UGI can be critical or even precious in terms of user real experience.
Nevertheless, as some UGI are taken under a specific circumstance and with a certain emotion, it is not simple for other viewers to appreciate these pictures [3] and poor user experience can occur [4]. In addition, the quality of UGC images posted is varied, for there is no quality criterion required for UGI display, such as the angle change, insufficient light, and low resolution. This phenomenon may provide viewers with a mediocre or even horrible experience.
In particular, we pay attention to the resolution of the image. Image resolution is a vital parameter to represent the quality of an image [5]. All the image processing relies on the image pixel. As information is carried within the pixel, thus a higher resolution image will possibly give us greater vision impetus for it has more abundant information compared with the lower one. However, whether a greater pixel quality can increase all the user experience dimension is still not thoroughly researched. Therefore, we aim to investigate the relationship between the user-generated image pixel quality and user experience. Moreover, we highlight the user experience issue in this paper. User experience can be classified into emotional, aesthetic and behavioral dimensions. The emotion dimension is concerned with how we feel and react with the external stimulus [6,17]. It reflects the deeper psychological state of the holder [7,18,19]. Besides, aesthetic experience is multifaceted, diverse, complex, and associated with manifold subjective perceptions [8,20]. Different from emotion which is user-centered, the aesthetic feeling is product-centered [9,21]. Moreover, behavioral experience can be measured by continued search, purchase willingness and recommendation (Table 1).
Methods
Our study is designed to investigate whether the image pixel level’s quality has an influence on user experience. We have hypothesized the elevated image pixel quality, which is resolution factor in our research, can increase the user experience from both the emotion, aesthetic, search, purchase and recommendation experience.
Environment
Our study is carried within the environment of classroom. The experiment materials are displayed on monitors, allowing several subjects to do the experiments simultaneously. Temperature is controlled at 25 degree Celsius. During the experiment time, subjected are not allowed to talk to each other to avoid unnecessary interference.
Participants
One hundred and thirteen students from the various universities are enrolled in our study, in exchange for credit in their course. All participants are native Chinese speakers. They major in business (29.2%), management (31.0%) and accountant (39.8%). Three subjects’ answers are not included because they do not fill in the form completely. Of the remaining 110 students (Mage = 21.6, 42% male), 72.7% are the undergraduate students, and the others are the postgraduates.
The university students are chosen for the following reasons: On one hand, the students are early adopters to search the Internet for fun or information [22]. Lee and Shin’s research [23] acknowledge that university students are the major participator in product-related community online. On the other hand, university students have more free time and energy to be engaged in the community. Therefore, we select university students as our subjects.
Procedure
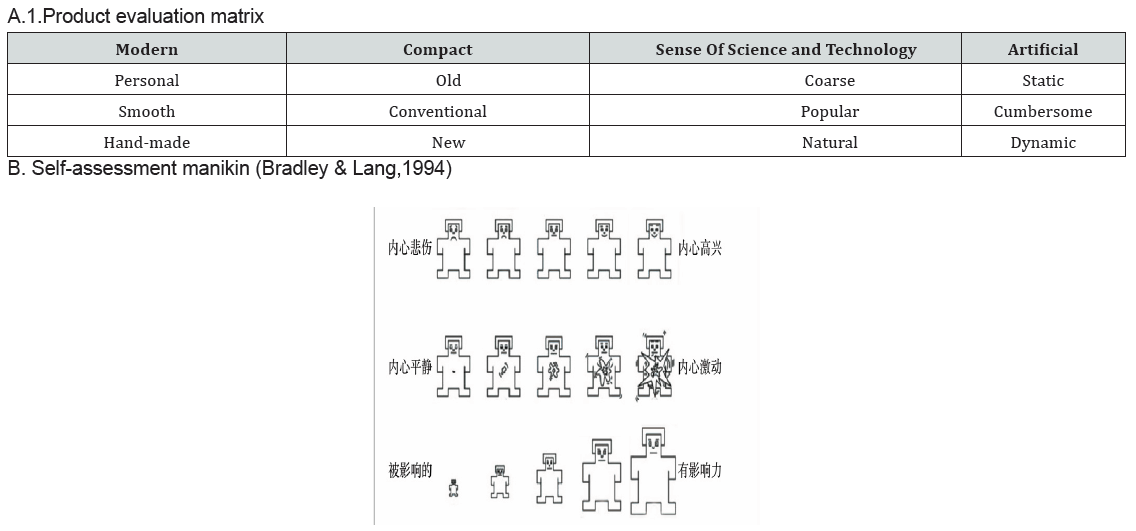
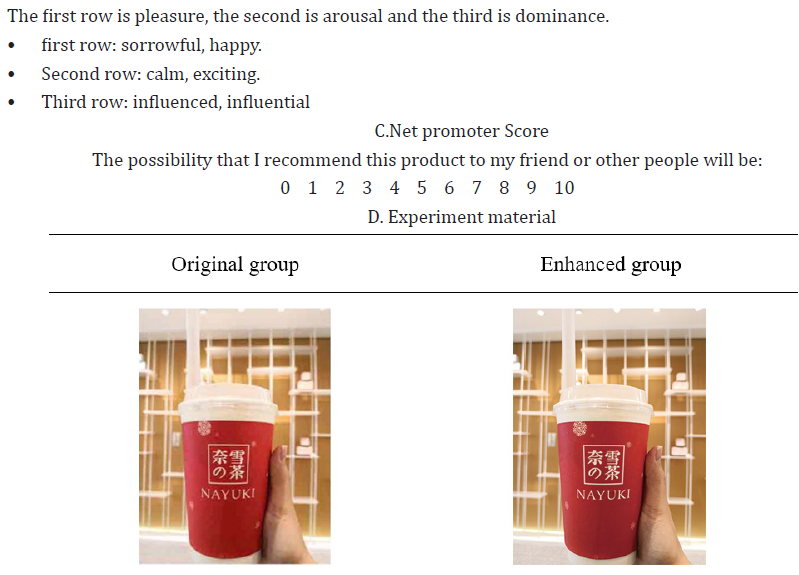
Our study is a one (resolution: original image vs enhanced image) factor between-subject design. We manipulate the resolution by increasing the pixel to a remarkable degree. The authors invite one marketing professor, who is very experienced in this major, and three senior social media users, spending almost two hours on social media each day for several years, to guarantee the quality of image converting process. Participants are asked to imagine they are surfing the social network application and watch the user-generated photographs. After viewing the stimulus image, the subjects are required to fill in the questionnaire, which is composed of the product description words, SAE, NPS and other scales (Table 1). The image is shown randomized, and it is not labeled as the original or enhanced one. The presentation time is ten seconds. We set the goods category as the beverage, for the subjects are accustomed to this everyday commodity (Table 2 & 3).


Result
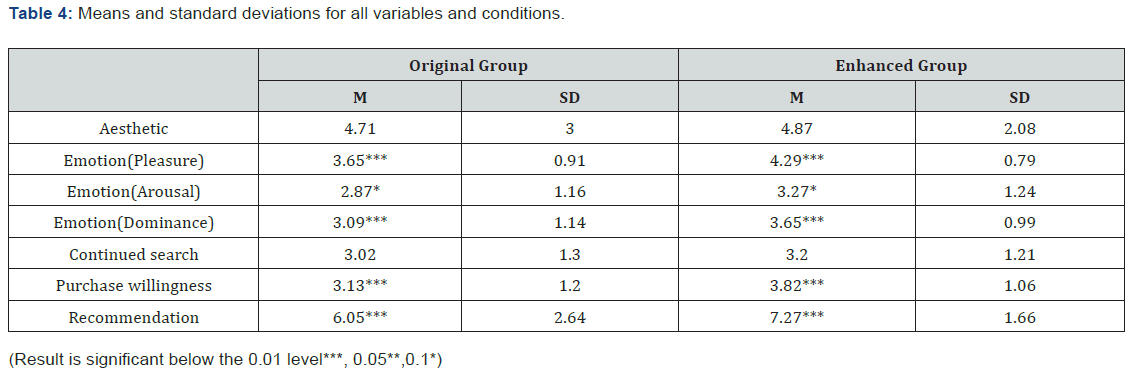
To test the multicollinearity issue, we conduct the VIF analysis. The outcomes are all below 10. Therefore it is not a major problem. All the correlation data can be seen in table 2. Table 4 reveals the preliminary results of our study. By using independent sample t-test, we can find the participants who view the enhanced image have higher scores than those who see the original ones on emotional pleasure (t=3.93, p<0.001), emotion dominance (t=2.77,p=.007),purchase willingness (t=3.20,p=0.002) and recommendation (t=2.90, p=0.005). Besides, in terms of the aesthetic adjective matrix, two different groups show almost the same pattern (Figure 1).


To further investigate the contribution of different variables to behavior dimension, we also carry out ordinal regression analysis. Moreover, we select the ordinal regression model to measure the relationship between the behavior dimension and other variables, which can be demonstrated by the equation coefficients. The reason is that the dependent variables are categorical and ordinal variables. From the results, we can obtain the information that purchase and recommendation has a significant connection with pleasure in all groups. Besides, dominance has a positive relationship with recommendation behavior (Table 4 & 5, Figure 1).

Discussion
From the findings of the results section, we can conclude that the user experience increases as a result of the elevated image pixel quality generally. The higher the resolution is, the greater the user emotion pleasure, dominance, purchase willingness and recommendation experience will be. However, in terms of the aesthetic word number, emotion arousal, and continued search, there are no (or marginal) significant differences between two groups. The aesthetic word numbers tend to have low correlation with image quality, indicating that subjects’ perception towards this product is similar. Also from figure 1, we identify the similar adjective trend, both featuring the warm, aromatic, popular, which is the common description word for the beverage.
One point added to our conclusion is that through the regression model, we can know the pleasure factor contribute significantly to search, purchase and recommendation behavior. Moreover, the recommendation willingness increases with the rise of dominance, showing that affective plays a critical role in the formation of recommendation behavior, which can be a vital heuristic finding for product-related marketing.
Conclusion
Despite the fact the user-generated content has increased at an unprecedented speed, the image quality-related research under the social media context is still scarce. The image quality’s effect on the user experience is not thoroughly studied. To bridge this knowledge gap, this paper put forward the image quality (resolution) and user experience sub-dimensions (aesthetic, emotion, continued search, purchase and recommendation behavior). Besides, we conduct scenario-based study to investigate the influence of user-generated image quality on the user experience. The findings can provide a new insight for the academics and practitioners to understand the user-generated image quality’s influence on consumers perceived product and brand (Appendix).


References
- Bakri M, Krisjanous J, Richard JE (2018) Decoding service brand image through user-generated images. Journal of Services Marketing.
- Bapat D (2017) Impact of brand familiarity on brands experience dimensions for financial services brands. International Journal of Bank Marketing 35(4): 637-648.
- Lux M, Taschwer M, Marques O (2012) Classification of Photos based on Good Feelings. ACMMM’12, Nara, Japan, pp. 1367-1368.
- Sonka M, Hlavac V, Boyle R (2015) Image processing, analysis and machine vision. In: (4th ), Cengage learning.
- Shrirao AS, Zaveri R, Patil MS (2017) Image Resolution Enhancement using Discrete Curvelet Transform and Discrete Wavelet transform. International Conference on Current Trends in Computer, Electrical, Electronics and Communication (ICCTCEEC-2017).
- Preece J, Rogers Y, Sharp H (2015) Interaction design-beyond human-computer interaction. John Wiley & Sons Ltd, United Kingdom, pp. 12-33.
- Hovy EH (2015) What Are Sentiment, Affect, and Emotion? Applying the Methodology of Michael Zock to Sentiment Analysis. Language Production, Cognition, and the Lexicon, 48, Springer International Publishing, USA, p. 13–24.
- Nuutinen M, Virtanen T, Leisti T, Mustonen T, Radun J, et al. (2016) A new method for evaluating the subjective image quality of photographs: dynamic reference. Multimed Tools Appl 75: 2367-2391.
- Caroll N (2001) Beyond Aesthetics: Philosophical Essays. Cambridge University Press, Cambridge.
- Lang PJ (1980) Behavioral treatment and bio-behavioral assessment: Computer applications. In: JB Sidowski, JH Johnson, TA Williams (Eds.), Technology in mental health care delivery systems, Ablex Publishing, USA, pp. 119-137.
- Benedek J, Miner T (2002) Measuring desirability: new methods for evaluating desirability in a usability lab setting. Usability professionals association 2002 conference, Orlando, USA, pp. 8-12.
- Grisaffe DB (2007) Questions about the ultimate question: conceptual considerations in evaluating Reichheld’s net promoter score (NPS). J Consum Satisf Dissatisf Complain. Behav, p. 20-36.
- Belk RW (2013) Extended self in a digital world. Journal of Consumer Research 40(3): 477-500.
- Keller KL (2003) Brand synthesis: the multidimensionality of brand knowledge. Journal of Consumer Research 29(4): 595-600.
- Sung Y, Kim E, Choi SM (2018) #me and brands: understanding brand-selfie posters on social media. International Journal of Advertising 37(1): 14-28.
- Vilnai-Yavetz I, Tifferet S (2009) Images in academic web pages as marketing tools: meeting the challenge of service intangibility. Journal of Relationship Marketing 8(2): 148-164.
- Hockenbury DH, Hockenbury SE, Nolan SA (2007) Discovering Psychology. In: (7th), Worth Publishers, USA.
- Bechara A, Damasio AR (2005) The Somatic Marker Hypothesis: A Neural Theory of Economic Decision. Games and Economic Behavior 52(2): 336-372.
- Septianto F, Chiew TM (2018) The effects of different, discrete positive emotions on electronic word-of- mouth. Journal of retailing and consumer services 44: 1-10.
- Barwich AS (2017) Up the nose of the beholder? Aesthetic perception in olfaction as a decision-making process. New Ideas in Psychology 47: 157-165.
- Pelowski M, Markey PS, Lauring JO, Leder H (2016) Visualizing the impact of art: An update and comparison of current psychological models of art experience. Frontiers in Human Neuroscience 10: 160.
- Quan-Haase A, Young AL (2010) Uses and gratifications of social media: A comparison of Facebook and instant messaging. Bulletin of Science, Technology & Society 30(5): 350-361.
- Lee EJ, Shin SY (2014) When do consumers buy online product reviews? Effects of review quality, product type, and reviewer’s photo. Computers in Human Behavior 31: 356-366.


