




 OFOAJ Home



Abstract
Xuwen Port is located at the southernmost tip of mainland China and serves as a critical corridor connecting the Guangdong-Hong Kong-Macao Greater Bay Area with the Hainan Free Trade Port. With the port’s continuous development and increasing passenger/cargo flows, congestion has become increasingly severe, demanding urgent solutions. This paper first applies the GM (1,1) model to prediction the overall traffic flow at Xuwen Port over the next three years. The prediction results indicate that congestion at Xuwen Port will continue to intensify in the coming years. Subsequently, a structural equation model (SEM) is employed to collect data through questionnaires and analyze the weight of influencing factors across five dimensions affecting port congestion, thereby formulating effective solutions. Finally, we suggest ways to improve port infrastructure, traffic management, and the development of smart ports to deal with congestion.
Keywords:Port Traffic; Congestion; GM (1,1); SEM; Cause analysis; Coping strategies
Abbreviations: SEM: Structural Equation Modeling; GM (1,1): Grey Model; 1-AGO: first-order accumulation generation; CR: Consistency Ratio; AVE: Average Variance Extracted; CMIN/DF: Chi-square/Degrees of Freedom Ratio; RMSEA: Root Mean Square Error of Approximation; IFI: Incremental Fit Index; TLI Tucker-Lewis Index; CFI: Comparative Fit Index; CFA: Confirmatory Factor Analysis; EE: External Environment; ME: Management Efficiency TF: Traffic Flow; IO: Infrastructure
Introduction
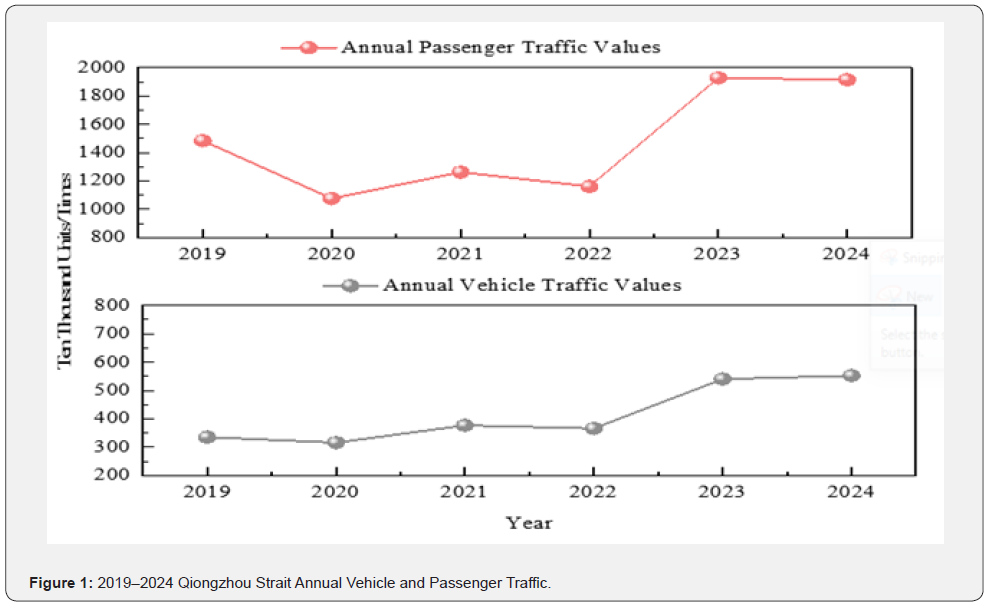
Port traffic congestion refers to a phenomenon where, within the port area, due to excessive traffic elements such as ships, vehicles, and personnel, the efficiency of port traffic is reduced, and the port’s functions are limited. Port congestion has negative impacts such as reducing the efficiency of the goods supply chain and deteriorating the travel experience of passengers. In the event of sudden severe weather or poor staff performance, causing severe congestion, if the port leadership fails to take timely measures, the congestion will intensify, leading to very adverse consequences. According to the “2019 Summary of the Spring Festival Travel Rush Work in the Pearl River Water System” released by the Pearl River Navigation Administration: During the 40-day Spring Festival travel rush (from January 21st to February 9th), Qiongzhou Strait completed 3.24 million passenger transports and 2.16 million tons of cargo transportation; the number of vehicles transported by roll-on/roll-off ships was approximately 123,000 times (average 3,075 per day). And according to the data of Qiongzhou Strait ferry transportation, during the Spring Festival travel rush in 2019, there was a transportation peak, breaking historical records, with the highest single-day passenger flow reaching 98,000 people, an increase of 6.2% compared to the previous year. On the 10th day of the Spring Festival travel rush, the vehicle transportation volume exceeded 30,000 times, and it continued for 11 days. During the 2023 Spring Festival travel rush, Qiongzhou Strait’s passenger ferry transportation rebounded strongly, with a total of 9,450 flights dispatched and 3.97 million passengers and 1.01 million vehicles transported, compared with the same period of the 2022 Spring Festival travel rush, they increased by 13.9%, 55.1%, and 44.8% respectively; compared with the same period of the 2019 Spring Festival travel rush, they increased by 32.4%, 10.2%, and 34.7% respectively. Qiongzhou Strait’s passenger ferry transportation during the Spring Festival travel rush has become the “main battlefield” of the national waterway Spring Festival travel, accounting for onefifth of the national waterway passenger transportation. The peak of transportation occurs early and lasts for a long time. Except during the Spring Festival travel rush, holidays such as May Day and National Day are also peak periods for entering and leaving the island. During the May Day holiday in 2024, the passenger flow and vehicle traffic in the Qiongzhou Strait reached 470,000 people and 115,000 vehicles respectively, with year-on-year growth of approximately 15%. From October 1st to 6th, 2024, the vehicle and passenger throughput at Xiuying Port (including Haian New Port operation area) was approximately 102,000 vehicles and 342,000 passengers. Compared to the holiday period, during non-holiday periods, the traffic and passenger flow peaks at Xiuying Port and the Qiongzhou Strait decreased significantly, and congestion was relatively less severe. However, congestion may still occur due to weather, emergencies, or short-term peak passenger flows. The Qiongzhou Strait is affected by fog for about 60 days throughout the year. Whether during holidays or non-holiday periods, when the navigation is suspended and then resumed, congestion is very likely to occur. For example, in mid-January 2023 (not during the Spring Festival peak), due to fog, severe congestion occurred outside Xiuying Port, with queues exceeding 10 hours. In the 12 days before the Spring Festival in 2025, the Qiongzhou Strait had a total of 3,728 ferry transportation departures, transporting 1.287 million passengers and 337,000 vehicles. Due to weather conditions such as fog, the Qiongzhou Strait will be suspended, which led to a significant increase in waiting vehicles [1]. The excessive traffic volume and the impact of bad weather suspension of navigation have led to a backlog of passenger traffic. Ensuring smooth traffic and providing safe travel is very important. The data of vehicle and passenger traffic in Qiongzhou Strait in the past six years is shown in Figure 1.
Most previous studies have primarily used AIS data to analyze port congestion issues. AIS system data is singular in nature and involves a lot of computational workloads. Fundamentally, AIS is a vessel navigation safety monitoring device whose core functions are to collect basic navigational parameters such as vessel position, speed, heading, and draft depth. These data do not directly reflect the many causes of port congestion. Also, AIS data is very big (more than 30 million entries per hour), which makes it hard to analyze. This means that it takes a lot of computing power to analyze the data in real time or to study large port networks. Xiaofei Guo, Jishuang Zhu and Weiwei Qiu (2023) proposed a port congestion index model and algorithm based on AIS data [2], which considers scenarios where vessels wait anchored outside ports or drift at sea, thereby more comprehensively and objectively assessing port congestion levels; Zhen Li [3] conducted research on port congestion evaluation methods for container ports based on AIS data, integrating container ship AIS data with port geographic information data to extract port congestion indicators from multiple perspectives. This study is different from most studies that only use vessel dwell time to measure port congestion. The study looks at different ways ships are anchored, like when they are loading or unloading, waiting in the channel, or in other situations where they are stuck. This helps us understand how bad the congestion is. But AIS data only tells us what is happening in the moment. It doesn’t show long-term trends or external disturbances, like infrastructure upgrades, seasonal changes in cargo, or pandemics, extreme weather [4]. Relying solely on historical AIS data may not capture these changes. For example, Shenzhen Port experienced a sudden surge in congestion indices in March 2022 due to pandemic-related disruptions. This is a type of short-term shock that requires integration with external data (e.g., pandemic policies, throughput statistics) for more accurate interpretation. Also, AIS data only records what vessels are doing and doesn’t show other important factors like how many berths are available, how well the port is managed, or external disturbances (like weather or accidents).
This study employs a time-series approach, incorporating the impacts of the COVID-19 pandemic [5], and utilizes the GM (1,1) model to predict port traffic volume, thereby obtaining relatively long-term congestion trends. This addresses the limitation of most studies in reflecting dynamic changes in port congestion. Meanwhile, by employing the Structural Equation Model (SEM) to introduce latent variables, the research integrates multivariate relationships, verifies theoretical hypotheses, and handles measurement errors. This approach effectively addresses the shortcoming of AIS data in directly quantifying external factors, thereby providing a robust analytical framework for investigating latent causes of port congestion.
Research Methods
GM (1,1) prediction model
The GM (1,1) model, also known as the grey model, is a mathbased forecasting model specifically designed for time series analysis. This model is particularly effective for addressing the inherent unpredictability and nonlinear characteristics exhibited in port congestion datasets, even when there is limited data availability, uncertainty, and ambiguity. The fundamental principle of the GM (1,1) model lies in its innovative “data generation” processing mechanism. It does this by systematically changing raw data so that it can find hidden patterns and relationships in complex systems. This helps to make reliable short-term predictions by capturing the important dynamics of the system through a process of optimizing parameter estimation and using differential equation-based modeling [6].
Data Source and Processing of GM (1,1): On September 26, 2020, the official website of the Ministry of Transport of China published the announcement “Guangdong Xuwen Port Officially Opens for Operation,” formally establishing it as the new hub for roll-on/rolloff passenger and freight transport across the Qiongzhou Strait. The newly-commissioned Comprehensive Transportation Hub Building of Xuwen Port was officially put into operation. Despite its operational history spanning only four years, data scarcity at Xuwen Port necessitates the use of Qiongzhou Strait-wide traffic data as a proxy for analyzing port operations. Xuwen Port serves as a critical gateway in the Qiongzhou Strait, handling over 90% of Hainan’s daily necessities and one-third of cross-strait passenger traffic, with its vehicular and pedestrian flows exhibiting strong positive correlation with the overall transportation demand in the Qiongzhou Strait.
Synchronized growth of transportation demand: The traffic volume of vehicles and the number of passengers at Xuwen Port are positively correlated with the transportation demand across the Qiongzhou Strait. When the transportation demand across the Qiongzhou Strait increases, the traffic volume of vehicles and the number of passengers at Xuwen Port will also increase accordingly. For instance, during the 2025 Spring Festival holiday from January 28th to February 4th (8 days), the Qiongzhou Strait transported a total of 960,000 passengers and 233,000 vehicles, representing year-on-year growths of 3% and 5% respectively. Xuwen Port also witnessed a peak in traffic volume and passenger flow. From January 28th to February 2nd (6 days), it handled 520,000 outbound passengers and 135,000 vehicles, showing year-on-year growths of 7.4% and 5% respectively. The transportation demand and capacity of the Qiongzhou Strait are growing in tandem with Xuwen Port. This growth trend is closely related to the overall tourism and travel demands of the Qiongzhou Strait.
Collaboration between port and strait: Xuwen Port is working in concert to promote the integration of port and shipping resources across the Qiongzhou Strait. Its operational efficiency directly affects the smoothness of traffic across the strait. For instance, Xuwen Port has enhanced transportation efficiency by optimizing vessel scheduling and increasing the frequency of dedicated services for new energy vehicles, ensuring the strait’s unimpeded flow. Meanwhile, the navigational conditions of the Qiongzhou Strait, such as weather and sea conditions, also have an impact on the volume of vehicles and passengers at Xuwen Port. For example, during adverse weather conditions like heavy fog, the strait may suspend navigation, leading to a backlog of vehicles and passengers at Xuwen Port and causing extensive and prolonged congestion.
In conclusion, the traffic volume and passenger flow of Xuwen Port are highly consistent with the overall flow of the Qiongzhou Strait. Therefore, we can use the data of the traffic volume and passenger flow of the Qiongzhou Strait to approximately represent those of Xuwen Port. By using the GM (1,1) model to predict the traffic volume and passenger flow of Xuwen Port in the next three years the specific data are shown in Table 1, we can provide a scientific basis for the planning and operation of the port to alleviate the current congestion situation of Xuwen Port.
With the onset of the COVID-19 pandemic at the end of 2019 and its full-scale outbreak in early 2020, global economic activities rapidly slowed down, leading to suppressed production and sales [7]. As a result, the overall traffic and throughput of ports experienced a significant decline. To more accurately predict the overall traffic data of Xuwen Port over the next two years, we aim to use an indicator to approximate the vehicle and passenger flow data of the Qiongzhou Strait, offsetting the impact of the pandemic. The recovery coefficient method is a technique used to assess and predict the recovery of a specific indicator after an external shock, such as a pandemic. It involves setting a “recovery coefficient” to adjust data from the affected period, thereby simulating the normal levels that would have been achieved without the shock.
This is the adjusted traffic volume (Padjusted ) of equation

where:
Pepi goes pandemic-era traffic volume (2020–2022).
R goes recovery coefficient, determined by historical data
comparison:
This is the recovery coefficient of equation

Ppre : goes baseline traffic volume before the pandemic
(2019).
Prec : goes post-pandemic recovery traffic volume (2023–
2024).
Due to uncontrollable factors, the excessive temporal span between pre-pandemic port traffic data and post-pandemic observations has led to substantial fluctuations in traffic volume. Specifically, the interval between 2019 (pre-pandemic baseline) and 2023 (post-pandemic recovery phase) exhibits excessive variability in port traffic patterns. This significant temporal displacement has resulted in calculated recovery coefficients exceeding the actual recovery capacity of the port system. To address this limitation, we selected 2021 as a critical breakpoint to divide the pandemic period into two segments - 2020: Peak pandemic impact phase & 2022: Post-pandemic recovery phase.
This segmentation mitigates the overestimation of recovery coefficients caused by excessive temporal variability between 2019 and 2023. According to the National Center for Disease Control and Prevention (NCDP), China’s effective pandemic control measures led to gradual economic recovery and stabilized port traffic flows. Notably, Qiongzhou Strait traffic volume in 2023 rebounded sharply compared to 2020 and 2022, justifying the selection of 2021 as a transitional year. Applying the recovery coefficient method: Padjusted=Pepi×Prec/Ppre This approach yields adjusted traffic values for 2020 and 2022 (controlling for pandemic effects) and post-pandemic vehicle traffic data for 2022.The processed results are shown in Table 2.
Model Principles & Application: The GM (1,1) model is a fundamental prediction tool in grey system theory, primarily used for forecasting time series data with exponential growth trends. Its core principle involves transforming irregular raw data into a quasi-exponential sequence through first-order accumulation generation (1-AGO), then establishing a first-order differential equation to describe the sequence’s evolution, ultimately deriving the prediction model. The detailed steps are as follows:
a) Data accumulation generation - Let the original dataset br ( X(0) ) This is the original dataset( X(0) )of equation?

Apply first-order accumulation generation to obtain a new sequence, This is the new sequence of equation

b) Construction of data matrix - Compute the adjacent mean generation sequence,
This is the adjacent mean generation sequence of equation

Then construct the data matrix B and data vector Y , This is the data matrix B and data vector Y of equation

c) Parameter estimation - Use the least squares method to estimate parameters a and b:
This is the parameters a and b of equation

d) Prediction model establishment - Derive the time response function for the GM(1,1) model
This is the time response function of equation

Then obtain the predicted values, This is the predicted values of equation

In the step of Level Ratio Test for GM (1,1) Model, the paper uses to verify whether the model residuals satisfy the white noise assumption. By analyzing the adjacent ratios of the residual sequence, it determines whether the model has sufficiently extracted the data patterns and whether the remaining errors are random and devoid of any pattern. Before making predictions with the GM (1,1) model, it is necessary to conduct a level ratio test on the original data to assess its suitability for model [8]. If the level ratio test is not passed, a translation transformation can be applied to preprocess the data by adding or subtracting a constant c to each data point to adjust the non-negativity, trend, or distribution characteristics of the data, ensuring it meets the model’s assumptions (such as non-negative data and growth trends). After translation, the level ratio test must be conducted again.
This is the level ratio test of equation

Annual Vehicle Traffic - Calculate level ratios (λk) for vehicle traffic (2019–2024):

Annual Passenger Traffic - Calculate level ratios (λk) for passenger traffic (2019–2024):

Check if all (λk) values fall within the acceptable range:
 It is evident that if the sequence fails to pass the level ratio test, a “translation
transformation” must be applied to the sequence. The translation
constant c is typically chosen as the minimum value in the original
data plus one, thereby generating a new sequence, which is then
subjected to the level ratio test anew.
It is evident that if the sequence fails to pass the level ratio test, a “translation
transformation” must be applied to the sequence. The translation
constant c is typically chosen as the minimum value in the original
data plus one, thereby generating a new sequence, which is then
subjected to the level ratio test anew.
This is the translation constant c of equation

where xk(0) denotes the original time-series data. Generate the translated sequence,
This is t the translated sequence of equation

The analysis of the Table 3 demonstrates that all posttranslation level ratios of the sequence fall within the acceptable range of (0.779, 1.284). This indicates that the translated sequence satisfies the assumptions for constructing a Grey Model (1,1), confirming its validity for subsequent predictions.
Smoothing test and param in the GM (1,1) model, the smoothing ratio is a core metric used to measure the smoothness of the data, directly influencing the model’s applicability and prediction performance. The more concentrated the distribution of the smoothing ratio, the more stable the parameter estimation of the model, the smaller the prediction error, and the higher the accuracy. As shown in Table 4, the smoothing ratios of most data points in the sequence are less than 0.5, indicating small data fluctuations, which makes the data suitable for direct use in the GM (1,1) model. Additionally, the concentrated distribution of the smoothing ratios suggests that the model has a good fitting effect and high prediction accuracy & estimation.
In the GM (1,1) model, the smoothing ratio
 is a core metric used to measure the smoothness of the data, directly
influencing the model’s applicability and prediction performance.
The more concentrated the distribution of the smoothing ratio, the
more stable the parameter estimation of the model, the smaller the
prediction error, and the higher the accuracy. As shown in Table
4, the smoothing ratios of most data points in the sequence are
less than 0.5, indicating small data fluctuations, which makes the
data suitable for direct use in the GM (1,1) model. Additionally, the
concentrated distribution of the smoothing ratios suggests that
the model has a good fitting effect and high prediction accuracy.
is a core metric used to measure the smoothness of the data, directly
influencing the model’s applicability and prediction performance.
The more concentrated the distribution of the smoothing ratio, the
more stable the parameter estimation of the model, the smaller the
prediction error, and the higher the accuracy. As shown in Table
4, the smoothing ratios of most data points in the sequence are
less than 0.5, indicating small data fluctuations, which makes the
data suitable for direct use in the GM (1,1) model. Additionally, the
concentrated distribution of the smoothing ratios suggests that
the model has a good fitting effect and high prediction accuracy.
As the analysis of model calculation results in Table 5.
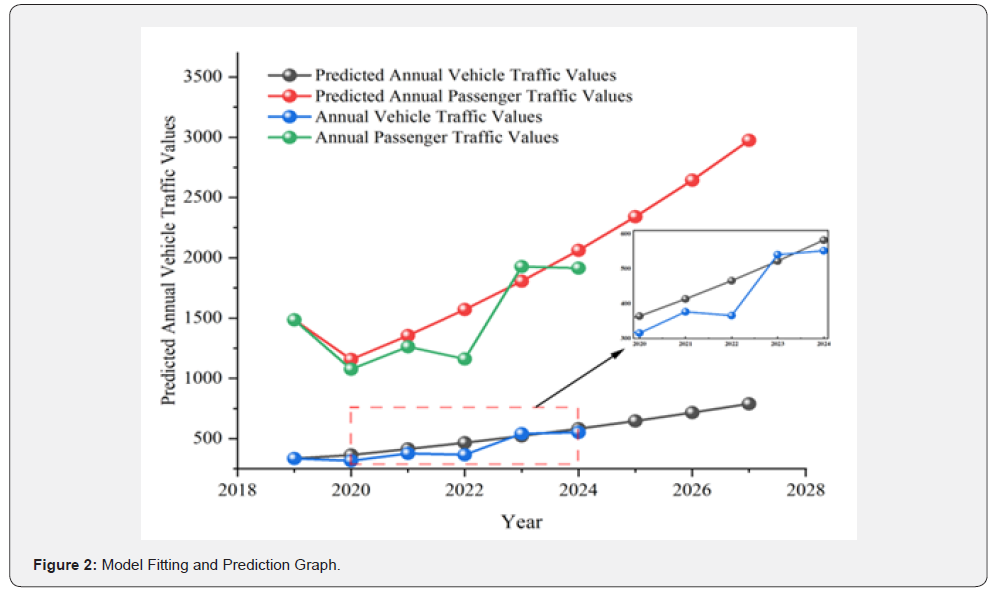
From the results presented in Figure 2 and Table 5 above, it can be seen that the relative error values of the model are all less than 10%, indicating that the model’s fitting effect is very good, and the fitting accuracy is high. Therefore, this paper further predicts the vehicle and passenger traffic data for the Qiongzhou Strait from 2025 to 2027, and the results are shown in Table 6.
Based on the GM (1,1) model forecasts (2025–2027), Xuwen
Port’s annual vehicle and passenger traffic volumes will continue
to grow steadily. This trend implies:
a) Increasing operational complexity: Port management
will face escalating challenges in coordinating vessel scheduling,
cargo handling, and emergency responses.
b) Worsening congestion risks: The port’s existing
infrastructure and traffic management systems will be
increasingly strained, potentially exacerbating bottlenecks during
peak seasons (e.g., Spring Festival).
Data Application Based on Structural Equation Modeling
Structural Equation Modeling (SEM) is a multivariate statistical analysis technique used to analyze complex multivariate relationships, simultaneously handling multiple dependent and independent variables, and examining both direct and indirect effects among variables. Its core lies in indirectly measuring latent variables through observed variables and analyzing the causal relationships between these latent variables. Through SEM, we can analyze the multifunctional causal relationships of port congestion and quantify the impact weights of various factors on port congestion [9].
Questionnaire Design & Collection: According to relevant traffic management regulations, combined with the current traffic situation at Xuwen Port and related academic research findings, a survey questionnaire on the influencing factors of traffic congestion at Xuwen Port was designed. The questionnaire consists of 18 questions, including 2 demographic variables, 14 core scale questions, and 2 multiple-choice open-ended questions. The core scale questions use a four-point Likert scale [10], eliminating a neutral option, which is a simplified version of the classic scale design. Respondents choose from options ranging from “very important” to “very unimportant” or “very reasonable” to “very unreasonable.” The questionnaire is targeted at passengers, staff, truck drivers, and other relevant personnel at Xuwen Port. A total of 450 questionnaires were distributed, and 352 valid questionnaires were collected. The sample coverage is precise, and the sample size is sufficient.
Analysis Process: Analysis process-description of sample characteristics, as can be seen from the Table7, the proportion of cargo transportation accounts for 44%, which confirms Xuwen Port’s status as a regional freight hub and also reflects the pressure on its throughput, particularly the tendency for congestion to occur during vehicle waiting periods for ferry crossings.
Analysis process - reliability analysis, as key factors in this study were measured using scales, verifying data quality is crucial to ensure the validity of subsequent analyses. Internal consistency across dimensions was first examined using Cronbach’s alpha coefficient, which ranges from 0 to 1. Higher values indicate greater reliability: coefficients below 0.6 suggest unacceptable reliability (requiring questionnaire redesign or data recollection), 0.6-0.7 denote acceptable reliability, 0.7-0.8 indicate good reliability, and 0.9-1 represent excellent reliability. From Table 8, it can be seen that the data reliability in this study meets the required standards.
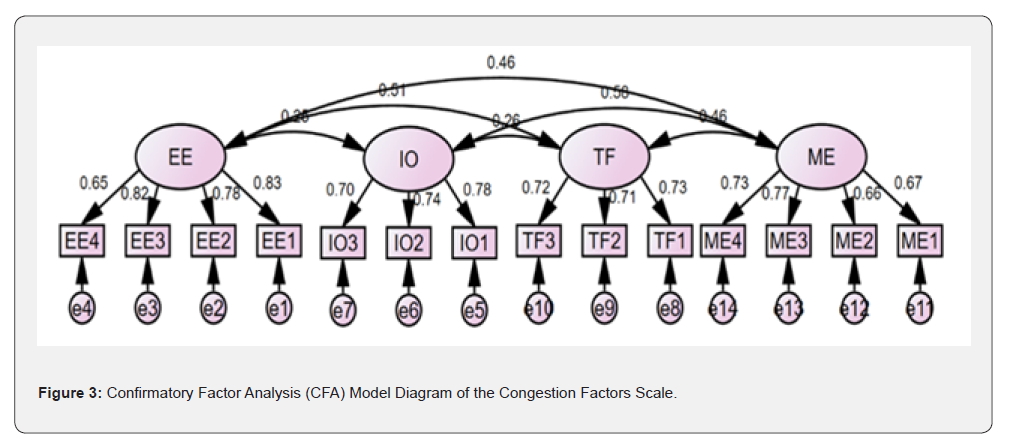
Analysis process - validity analysis, from the model fit test results presented in Table 9, it can be observed that CMIN / DF (Chi-square/Degrees of Freedom Ratio) = 1.561 (optimal range 1-3), RMSEA (Root Mean Square Error of Approximation) = 0.04 (excellent <0.05). Additional indices including IFI, TLI, and CFI all exceeded 0.9, achieving benchmark excellence. These results collectively confirm satisfactory goodness-of-fit for the Congestion Factor Confirmatory Factor Analysis (CFA) model.
With confirmed goodness-of-fit of the Congestion Factor CFA model, convergent validity (Average Variance Extracted, AVE) and composite reliability (CR) were further examined. Standardized factor loadings were derived from the CFA model, followed by AVE / CR calculations using established formulas. Meeting thresholds (AVE ≥0.5, CR ≥0.7) confirms validity and reliability. From the analysis results in Table 10, it can be observed that results demonstrate all dimensions exceeded minimum criteria (AVE >0.5, CR >0.7), indicating robust convergent validity and composite reliability for the Congestion Factor Scale.


where, “***” indicates that the parameter estimate is statistically significant at the 0.1% level(P<0.001), meaning the parameter is extremely unlikely to be zero and demonstrates very strong statistical significance**.
All pairwise standardized correlation coefficients between dimensions were lower than the square roots of their corresponding Average Variance Extracted (AVE) values are shown in Table 11. This confirms distinctiveness among latent dimensions in the Congestion Factor Scale. The specific results are shown in Figure 3 and Table 11.
Analysis process - Descriptive statistics and normality test, the following presents the descriptive statistical analysis and normality test results for the factors examined in this study. Based on the descriptive statistics, the mean scores of all variables ranged between 2 and 4 (on a 1–4 positively scored scale), indicating that the influence of each factor on congestion at Xuwen Port was at a moderate to high level. The normality of the measurement items was evaluated using skewness and kurtosis coefficients. According to the criteria proposed by Kline (1998), data can be considered approximately normally distributed if the absolute values of skewness are less than 3 and kurtosis are less than 8. The analysis results Table 12 show that the absolute values of both skewness and kurtosis coefficients for all measurement items in this study fell within the acceptable thresholds. Therefore, the data for all measurement items met the criteria for approximate normality.
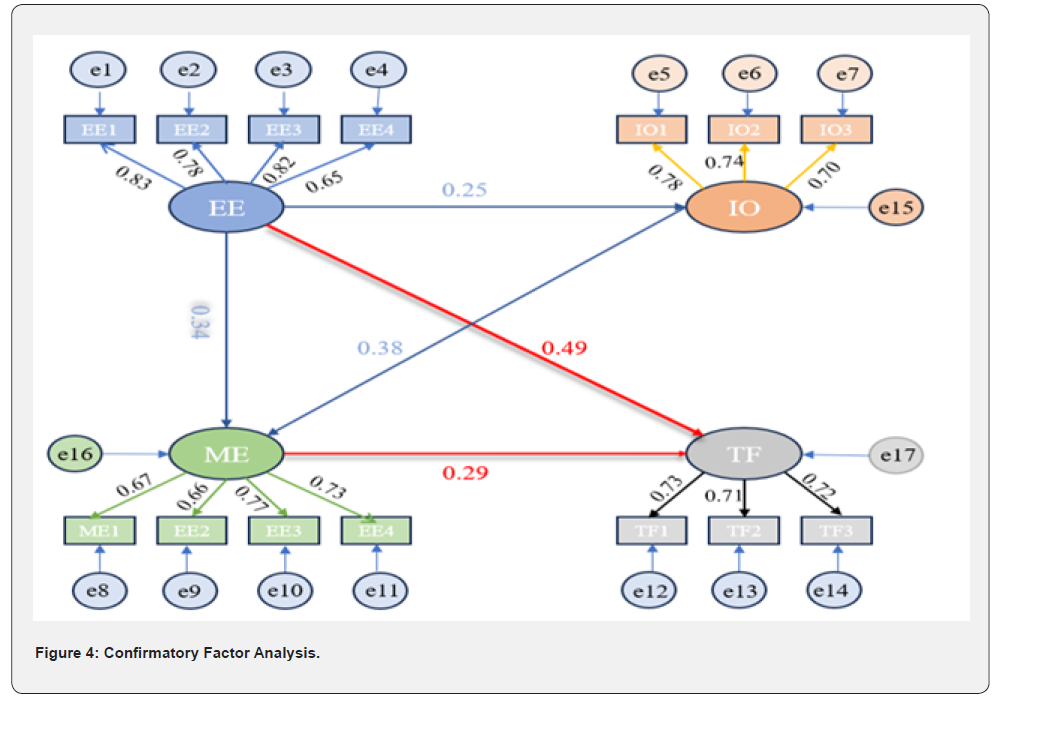
Analysis of Results: As illustrated in Figure 4 and Table 13, within the hypothesis testing of path relationships in this study, both External Environment (EE) and Management Efficiency (ME) have a positive influence on Traffic Flow (TF); Infrastructure (IO) and External Environment (EE) both positively affect Management Efficiency (ME); and External Environment (EE) positively impacts the development of Infrastructure (IO). Although some of these paths exhibit relatively weak correlations, they remain within reasonable bounds. In summary, all the path hypotheses proposed in this study are substantiated.
Based on the analysis results of the Structural Equation Model
(SEM), the path relationships and weights of the five core factors
(External Environment, Infrastructure, Management Efficiency,
Traffic Flow) influencing traffic congestion at Xuwen Port have
been validated through Confirmatory Factor Analysis (CFA) and
model fit tests. The specific analysis is as follows:
a) External environment (highest weight): Contains natural
conditions (e.g. weather, channel curvature) and geographic
factors (e.g. channel crossing condition), and the standardize
factor loadings show that channel width (EE1=0.831) and
curvature (EE3=0.821) have a significant impact on congestion.
Combined with the empirical results in Figure 2-1, the channel
curvature and crossing condition of Xuwen Port scored low
and need to be improved by optimizing the channel layout (e.g.,
changing to a straight channel) and expanding the water area.
b) Management efficiency: Pilot-age management
(ME3=0.766) and pilot-age facilities (ME4=0.734) are key
variables. When the scores of the former pilot-age and navigation
facilities are not up to the average level, it is recommended to
introduce electronic navigational markers, real-time information
interaction systems, and to strengthen the supervision of ship
navigation to eliminate risky behaviors.
c) Traffic flow: The higher loadings of traffic flow
(TF1=0.728) and people flow (TF3=0.717) are consistent with the
trend of traffic growth predicted by the GM (1,1) model (7,887,800
units/trip in 2027), which verifies the direct effect of the surge in
traffic flow on congestion.
d) Infrastructure: Port hardware facilities (IO2=0.783)
and scheduling capacity (IO4=0.701) need to be upgraded. It is
recommended to increase the number of berth, optimize ship
scheduling algorithms and promote the construction of new
energy ship lines.
e) Multi-factor synergistic effects: The high correlation
coefficient between external environment and management
efficiency (0.464) suggests that congestion will be further
exacerbated by lagging management response during inclement
weather. For example, if information is not disseminated in a timely
manner (insufficient navigational aids) during fog stoppages,
the problem of backlogs of vehicles waiting to be ferried will be
exacerbated. In addition, the interaction effect between traffic
flow and infrastructure (correlation coefficient 0.264) suggests
that existing facilities will not be able to cope with future growth
in traffic and will need to be expanded.
Measures to Alleviate Congestion Issues: Based on the
quantitative analysis results of the GM (1,1) model prediction and
Structural Equation Modeling (SEM), the vehicle and passenger
traffic at Xuwen Port are expected to continue growing over the
next three years (reaching 7.8878 million vehicles and 29.7455
million passengers by 2027). Congestion issues will worsen as
transportation demand increases. Considering the significant
impact of natural conditions (weight 0.602), traffic flow (weight
0.518), infrastructure (weight 0.549), and management efficiency
(weight 0.503) on congestion in the SEM model, this study
proposes the following systematic solutions:
a) Infrastructure expansion and functional optimization:
This is the foundational support for alleviating congestion. To
address the shortage of berths and weak collection and distribution
capacity, priority should be given to advancing wharf expansion
projects, adding dedicated passenger and cargo roll-on/rolloff
berths, and optimizing ship scheduling processes to reduce
docking and departure times, thereby improving throughput
efficiency. Additionally, the design of peripheral diversion
roads and main access roads should be enhanced, and railway
lines should be connected to the port to achieve multimodal
transportation (road-rail-water). Furthermore, considering the
growing demand for new energy transportation (e.g., dedicated
routes for new energy vehicles across the Qiongzhou Strait),
charging stations and battery swap facilities should be added to
the port area to prevent vehicle backups caused by insufficient
infrastructure.
b) Empowerment through intelligent technology: This is
the core path to improving operational efficiency. Leveraging big
data, the Internet of Things (IoT), and artificial intelligence (AI), a
smart port platform integrating ship dynamic scheduling, vehicle
reservations, weather warnings, and real-time traffic data should
be established [11]. AI algorithms can achieve precise matching
of vehicle flow and ship schedules, dynamically adjusting shifts
and berth allocation, such as adding temporary routes during
peak travel seasons to meet surging demand. Pilot applications
of autonomous trucks and shuttle buses within the port area can
reduce human operational errors and enhance transportation
continuity. Meanwhile, a real-time traffic guidance system based
on electronic displays and mobile apps can provide drivers
with updates on waiting times, optimal routes, and sudden
weather warnings, alleviating congestion caused by information
asymmetry.
c) Dynamic management strategies and emergency
mechanisms: These should be tailored to traffic flow
characteristics and natural condition risks. Based on the SEM
analysis, which highlights the significant weight of traffic flow, a
time-based differential pricing policy is recommended to guide
vehicles to travel during off-peak hours, balancing day and night
traffic distribution [12]. For adverse weather conditions (e.g.,
fog-induced suspensions), a cross-departmental emergency
response mechanism should be established [13], including the
use of temporary parking lots and coordination with surrounding
areas to divert waiting vehicles. Real-time suspension information
and alternative routes should be disseminated through the smart
platform. Additionally, driver behavior should be regulated by
adding electronic monitoring equipment and strengthening law
enforcement to strictly penalize violations such as queue-jumping
and speeding. Regular safety training can also enhance drivers’
awareness of order, reducing human factors that interfere with
traffic efficiency.
d) Management coordination and policy support: These
are key to long-term sustainable development. Promoting
the sharing of ship capacity and berth information between
ports on both sides of the Qiongzhou Strait (Xuwen Port and
Hainan’s Xinhaigang Port) can reduce ship’s empty loading
rate and waiting times. Introducing professional management
teams to optimize processes and enhance internal collaboration
efficiency through ERP systems is essential [14]. Establishing a
multi-stakeholder communication platform to regularly collect
feedback from passengers, drivers, and cargo owners will enable
dynamic adjustment of management strategies. At the policy
level, the expansion of Xuwen Port should be integrated into the
coordinated development plans of the Guangdong-Hong Kong-
Macao Greater Bay Area and the Hainan Free Trade Port, securing
national funding and policy support. Simultaneously, clean energy
ships and low-carbon transportation models should be promoted
to facilitate the transition to a green port.
e) Data-driven continuous optimization: This ensures
the closed-loop implementation of the solutions. A datasharing
platform should be established in collaboration with
meteorological, transportation, and maritime departments to
integrate traffic flow predictions, weather warnings, and Vessel
dynamic information, providing real-time decision-making
support [15]. The accuracy of the GM (1,1) model predictions
should be regularly reviewed, and the effectiveness of measures
should be validated against actual operational data, such as
evaluating the impact of infrastructure upgrades by comparing
congestion indices and vehicle turnover rates. In the future,
5G and blockchain technologies can be introduced to enhance
the real-time performance and data security of intelligent
scheduling systems, providing technological support for Xuwen
Port to become an efficient, intelligent, and sustainable regional
transportation hub.
In summary, the measures proposed in this study are grounded in empirical analysis, covering the entire chain of “facility expansion—technology empowerment—management innovation - policy coordination.” They address both shortterm emergency responses and long-term strategic planning. By systematically optimizing the port’s operational ecosystem, these measures not only alleviate current congestion pressures but also provide a practical model for the efficient operation of passenger and cargo transportation across the Qiongzhou Strait and the integrated development of the regional economy, propelling Xuwen Port toward becoming a smart and green next-generation hub port.
Conclusion and Future Prospects
With the continuous development of the economy, the increasing passenger and cargo flow at Xuwen Port, and the growing transportation demand, alleviating port congestion has become an urgent issue. This paper addresses this problem by using the GM (1,1) model to predict the port’s traffic over the next three years and combines it with SEM analysis to identify factors influencing congestion, thereby proposing solutions. In the GM (1,1) model, the recovery coefficient method is employed to adjust data from the period affected by the pandemic, simulating normal levels without the impact of the pandemic, thereby enhancing the model’s prediction accuracy. The results indicate that congestion at Xuwen Port is likely to continue increasing over the next three years. To effectively mitigate this issue, we analyzed the weights of various dimensions affecting port congestion using the SEM structural equation model and the main influencing factors include the external environment, traffic flow, infrastructure and operation, and management efficiency. Therefore, this paper proposes a solution covering the whole chain of “Facility Expansion-Technology Enabling-Management Innovation-Policy Synergy”.
However, there are still some limitations in this study. Firstly, the data source in making the GM (1, 1) prediction mainly relies on the overall flow data of the Qiongzhou Strait, and in the future, the detailed operation data of Xuwen Port or even the detailed flow data of each time period can be further obtained to improve the accuracy and relevance of the prediction. Secondly, the analysis of structural equation modelling is mainly based on questionnaire surveys with a relatively limited sample size, which can be expanded in the future to enhance the reliability of the analysis. In the future, with the further development of the Guangdong-Hong Kong-Macao Greater Bay Area and Hainan Free Trade Port as well as the continuous growth of market demand, the traffic pressure on Xuwen Port will further increase. Therefore, continuous monitoring of the port’s operating conditions and timely adjustment of management strategies will be the key to ensuring the long-term and efficient operation of Xuwen Port. On the other hand, with the continuous advancement of technology, port traffic management will usher in new development opportunities. The application of technologies such as automatic driving technology, intelligent scheduling system and big data analysis will greatly improve the operational efficiency and smoothness of traffic in the port. At the same time, the government and enterprises should strengthen cooperation to promote the modernization and intelligent construction of ports and provide strong support for regional economic development.
Acknowledgment
In the process of writing this thesis, I sincerely appreciate all those who have supported and helped me. First and foremost, I would like to extend my special thanks to my teachers - Dr. Wei Wang, Professor Lijun Wang, and Captain Zhaobin Fu. From the selection of the topic and the design of the framework to the finalization of the manuscript, my teachers have provided meticulous guidance and selfless assistance.
Funding
The authors gratefully acknowledge the support from The Key Area Project of Ordinary Universities in Guangdong Province (Grant NO. 2024ZDZX3054), the Fund of Guangdong Provincial Key Laboratory of Intelligent Equipment for South China Sea Marine Ranching(Grant NO. 2023B1212030003), Comprehensive Evaluation of Risks of Calling and Departure of Ultra-large Vessels in Xiashan Port Area of Zhanjiang Port(Grant NO. 2020B01235),Research on Key Technology of Safety Guarantee for Ultra-large Ships Entering and Leaving Port Based on AIS Data(Grant NO. R20071), Zhanjiang Science and Technology Tackling Topic (Unsubsidized), VR System for Vessel Operation in the Water Area of Zhongke Refining and Chemical (Zhanjiang) Terminal Berth based on FVCOM Flow Field(Grant NO.2020B01393).
References
- Zhang J, Yan O, Huang S (2018) Concerns over Fog-Related Suspension of Navigation in Qiongzhou Strait. Pearl River Water Transport 4: 6-8.
- Guo X, Zhu J, Qiu W (2023) Northern Navigation Service Center, Maritime Safety Administration, People′s Republic of China; China Waterborne Transport Research Institute; Modeling and calculation of AIS-based port congestion index. Navigation of China 46(4): 154-162.
- Li Z (2023) Research on Container Port Congestion Evaluation Method Based on AIS Data. Dalian Maritime University.
- Huang Y, Zeng P, Shi C (2022) Study on Classification of High-Impact Weather Grades for Port Industry in Guangxi Beibu Gulf. Journal of Meteorological Research and Application 43(4): 85-90.
- Gui D (2022) Research on Risk Assessment of Port Congestion Under the COVID-19 Pandemic. Wuhan University of Technology.
- Zhou X, Zhao Y, Zhu J (2024) Freight Volume Prediction Based on GM (1,1)-SVM Model. Journal of Guangzhou Maritime University 32(4): 53-58.
- Feng Y, Xu X (2022) Production and Development of International Container Ports Under the COVID-19 Pandemic. China Water Transport 19: 43-45.
- Liu S, Deng J (2000) Applicability Scope of the GM (1,1) Model. Systems Engineering - Theory & Practice 5: 121-124.
- Sun L (2005) Principles and Operation of Structural Equation Modeling (SEM). Journal of Ningbo University (Educational Science Edition) 2: 31-34.
- Zhao Q, Zhao D, Li B (2020) Response Order Effects in Scale Items and Their Influencing Factors: An Analysis Using Likert Scales in Education. China Examinations 4: 22-27.
- Lei Q (2025) Application of Intelligent Technologies in Improving Port Transportation Efficiency. Pearl River Water Transport 2: 43-45.
- Cao L, Chen M (2022) Comprehensive Emergency Management of Port Emergencies. Modern Business Trade Industry, , 43(19): 78-79.
- Liang J (2015) Early Warning System for Severe Weather in Ports. Port Science and Technology 9: 39-41.
- Zhang Q (2024) Research on Collaborative Operation of Shanghai Port Container Logistics System. Dalian Maritime University.
- Li F (2023) Research on the Development Path of Digital Transformation in Modern Ports. Pearl River Water Transport 22: 48-52.

























