Abstract
Container ports are important for global trade because they connect shipping by sea and by land. They help countries work together by making it easier to move goods from one place to another. In this paper, we use the “Regulations on Port Planning and Management” and the results of current academic papers on port siting to build a four-factor evaluation system. The four factors are natural, economic, environmental, and technical. We then use hierarchical analysis and structural equation modeling to determine the importance of these factors. This helps us create a plan for where to build ports. The weight allocation method is based on expert scoring, which is subjective. This paper improves upon the limitations of single models and provides more practical and feasible solutions for port siting.
Keywords:Evaluation; Container port; SEM; AHP; Hybrid model
Keywords:SEM: Stretched Exponential Model; AHP: Analytic Hierarchy Process; CI: Consistency Indicators; RI: Random consistency Indicator; CR: Consistency Ratio; CMIN/DF: Chi-square/Degrees of Freedom Ratio; RMSEA: Root Mean Square Error of Approximation; IFI: Incremental Fit Index; TLI Tucker-Lewis Index; CFI: Comparative Fit Index; CFA: Confirmatory Factor Analysis; AVE: Average Variance Extracted; PR: Regulation Factors; TF: Technical Factors; NF: Natural Factors; EF: Economic Factors; RA: Rationality of the Site Selection
Introduction
With the advent of globalization in manufacturing and marketing, contain-erization has become a much more significant form of freight transportation. A seemingly ever-increasing number of products are shipped by container to and from an increasingly diverse number of places. Within this freight sector, China has become a dominant player since the opening-up of its economy in 1978 and the growth in output that has accompanied its more market-orientated development. A huge amount of investment is being poured into ports and infrastructure to support the growth of the container transport industry [1]. They have very specialized layouts and use automation technology and process optimization more than other ports. Researchers have studied different types of ports and where they are located. Du Hang’s study, “The Study of Port Siting Based on Analytic Hierarchy Process,” looks at how to choose the best place for a 100,000-tonne bulk terminal in the Zhangzhou port area. To do this, he uses a special kind of analysis called a “hierarchical analysis.” This analysis helps him build an evaluation model. The model has three parts: These dimensions are economic rationality, traffic accessibility, and environmental feasibility. The optimal location is found by combining the fuzzy theory with assigning values to qualitative indexes and performing a standard normalization operation on quantitative values. The three alternative port areas considered were Zhaoyin Port, Houshi Port, and Gulei Port. Houshi Port is the optimal location. In the Evaluation Analysis Of Port Site Selection Based On ComAbstract mercial Rights, Ding Xiao and his team created a four-dimensional index system of natural conditions, technical conditions, urban conditions, and economic conditions for the problem of port site selection. They combined the entropy weight method with TOPSIS to evaluate the four candidate ports and determine the port site closest to the ideal port [2]. In the study entitled “Application of Grey System Correlation Degree in Harbour Siting Selection,” Guochen Li proposes a quantitative decision-making method based on grey correlation theory. This method evaluates the natural conditions, technical conditions, economic and social impacts comprehensively, eliminates the differences in the quantitative scales, and obtains the optimal port by calculating the correlation coefficients of the ports to be selected with the ideal ports. The study also carries out the application of examples to obtain the maximum correlation degree of ports located in a finite curved river section [3]. In another study, Guoguang Xu’s “The Application of Multi-Objective Fuzzy Ranking Method in Port Siting” proposes a multi-level evaluation index system, a fuzzy affiliation function to quantify qualitative indexes, an analytic hierarchy process, and information entropy to determine the weights. The study then uses the fuzzy superiority and closeness to evaluate the advantages and disadvantages of the scheme and applies the examples to obtain the optimal scheme for the siting of Shanghai Port at Jin Shan Zui [4].
Compared to the other research methods for choosing a port location, this method is too subjective, too dependent on data, doesn’t consider how the port will change over time, and is too complex and difficult to use. The AHP technique performs pairwise comparisons to measure the relative importance of elements at each level of the hierarchy and evaluates alternatives at the lowest level of the hierarchy in order to make the best decision among multiple alternatives. AHP provides decision makers with a way to transform subjective judgments into objective measures [5]. Structural equation modeling (SEM) is a multivariate statistical framework that is used to model complex relationships between directly and indirectly observed (latent) variables [6]. The AHPAEM hybrid decision-making model, where the AHP provides initial weights and the SEM verifies the reasonableness of the data, forms a closed loop of expert experience, data verification, and model optimization.
Research Methods
The AHP is a multi-objective, multi-criteria theory of measurement. It addresses the issue of how to structure a complex decision problem, identify its criteria (tangible or intangible), measure the interaction among them and finally synthesize all the information to arrive at priorities, which depict preferences [7].
Analytic Hierarchy Process
At first, establish a hierarchical structure-according to the problem, the factors related to decision-making are split into multiple levels, such as the goal level, criterion level, programme level and so on. Next, determine the quantitative criteria - according to the meaning of the rating scale to determine the relative importance of each influence factor, and establish a judgement matrix. The judgment matrix is generally constructed using the ninepoint scale method as shown in Table 1.

The establishment of the two-two judgement matrix: expressed for the element and element j. The judgement matrix A has the following properties: previous level of a certain element, the level of the elements related to it between the relative importance of the two-two comparison. The judgement matrix can be expressed as A = (aij )n×n ,the value aij represents the relative importance value of the element i and element j . The judgement matrix A has the following properties:
1. aij > 0 ;
2. a ji = 1 / aij ;
3. The comparison of each factor on the diagonal of matrix A with itself, that is aij = 1;
4. aij the larger it is, the greater the importance of the influence factor Ai relative to Aj
Calculate the weight of each element: through the operation of the judgement matrix, calculate the weight of all the elements of this level on the relevant elements of the previous level, using the results of the calculation of the weight of a single level, and further derive the weight of the elements of the next higher level, and so on, to carry out the weight ranking.
The judgement matrix is A = (aij )n×n .Product each row of factors in A :

Find the n -th root of the product of all rows:


Normalized:

Obtain the weight of each influencing factor.
Conducting consistency tests: Compute the largest characteristic root of the judgement matrix Aλmax , which ( Aw)i denote the i -th component of the vector Aw:

Calculation of consistency indicators CI. This is the example 5 of equation

where n is the order of the judgement matrix A,λmax is the maximum eigenvalue of A .
Calculation of the consistency ratio A , equation: theoretical note-when CR < 0.1 , the consistency of the
judgement matrix A is generally considered acceptable [8] (Table
2).

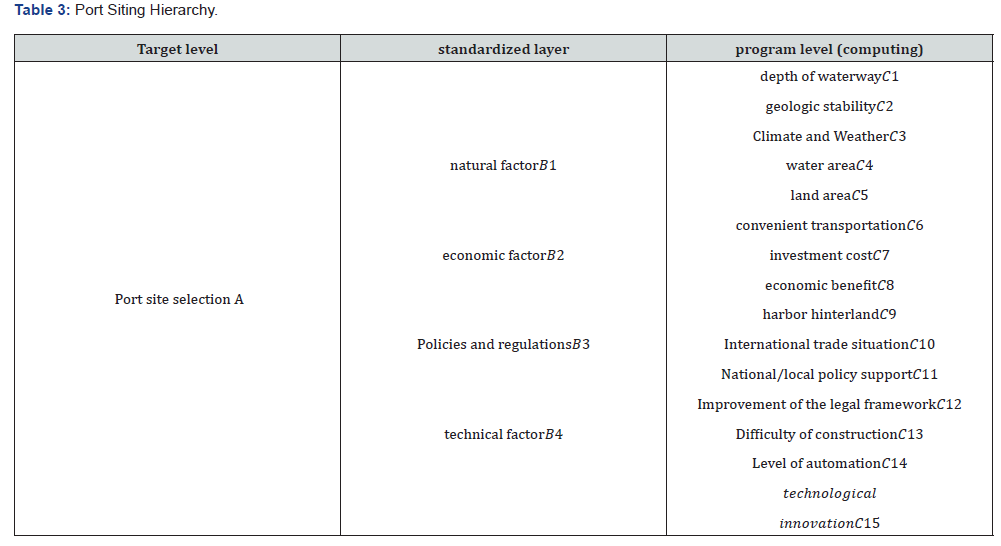
Modeling the hierarchy- According to the results of relevant academic papers on container port siting, understanding the current situation of container port development and future industry prospects, and based on the relevant regulations on port construction, we summarize the 15 indicators affecting port siting, and divide the 15 indicators into 4 aspects of the factors. natural factors (water depth, geological stability, climate and weather, water area, land area), economic factors (accessibility, investment costs, economic benefits), policy and regulatory factors (international situation trade, national/local policy support, legal framework improvement), technical factors (construction difficulty, automation level, technological innovation). , port hinterland), policy and regulatory factors (international situation trade, national/ local policy support, perfect legal framework), and technical factors (construction difficulty, automation level, technological innovation) [9].
The Analytic Hierarchy Process (AHP) is a structured multi-criteria decision-making method. Through this hierarchical structure, it simplifies and systematizes complex systems, enabling decision- makers to clearly grasp the hierarchical relationships and internal connections among various factors. Its core lies in decomposing complex decision-making problems into three progressive levels, the target level, the criterion level, and the alternative level. The criterion level serves as the bridge connecting the target level and the alternative level. As shown in the port location case in the table, the target level is “Port Location”, which is the ultimate decision goal of the entire analysis; the criterion level is subdivided into four categories: natural factors, economic factors, policy regulations, and technical factors. These criteria are the main evaluation dimensions for achieving the goal, further decomposing and specifying the target, and systematically considering the factors influencing port location from four aspects. The alternative level includes 15 specific indicators such as water depth, geological stability, climate and weather, etc., further refining and specifying the indicators of the criterion level, serving as the most basic specific evaluation factors, directly used to construct the judgment matrix and calculate the weights. The hierarchical structure corresponds to that shown in Table 3.
The comparison of various influencing factors for port location is shown in Table 4./p>
The comparison of various indicators of natural factors is shown in Table 5.
The comparison of various economic indicators is shown in Table 6.
The comparison of each indicator of policy and regulation factors is shown in Table 7.
The comparison table of various technical factors is shown in Table 8.
Analysis of results: Further calculations are performed to obtain the combined weights of the scheme layer on the target layer and to rank them. In the process of decision-making, improper consistency may lead to inconsistent results [10]. The C.R. values of the above judgement matrices are all less than 0.1, indicating that the judgement matrices have satisfactory consistency, and their eigenvectors can be used for the quantitative description of the weights. From the eigenvectors of the criterion layer to the target layer, the economic factors have the largest weights, and the regulatory and policy factors have the smallest weights. In terms of the weights of the scenario layer to the objective layer, the weight of economic benefits is the largest, indicating the in fluence of future economic gains of the port on the port location, followed by automation level, and improving the efficiency of the port’s utilization directly affects the core competitiveness.


Application of SEM
Structural Equation Modeling (SEM) is a multivariate statistical analysis technique used to analyze complex multivariate relationships. It is able to deal with multiple dependent and independent variables at the same time and analyze direct and indirect effects between variables. Its core lies in indirectly measuring latent variables through observed variables and analyzing the causal relationships between latent variables. Through SEM, we can analyze the multifactor causal relationship affecting port siting and quantify the influence weight of each factor on container port siting.


According to the relevant management regulations on container port siting and construction, combined with the academic results of related papers, we design a questionnaire about the importance of the factors influencing the siting of ports, and further analyze the influence weights of these factors on the siting of container ports.
Sample analysis: The questionnaire has five dimensions, including natural factors, economic factors, technical factors, policy and regulatory factors, and reasonableness of port site selection, involving 19 questions, and the core scale questions use a fivepoint Likert scale. The Likert scale is commonly used in survey research using primary and secondary data to measure the respondent attitude by asking insofar to which they agree or disagree with a particular question [11]. Respondents choose from options ranging from “very important” to “very unimportant” or “very reasonable” to “very unreasonable.” The questionnaire was sent to the relevant container port site selection and construction personnel across the country. A total of 500 questionnaires were distributed and 406 valid questionnaires were collected. The sample coverage is large, and the sample size is sufficient.
Reliability analysis: In this study, the main factors were measured in the form of scales, so the data quality of the measurement results is an important prerequisite to ensure the significance of the subsequent analyses. The internal consistency of each dimension was first analyzed by means of the Cronbach coefficient reliability test. Cronbach’s coefficient alpha is one of the most frequently used ways of estimating internal consistency of reliability (Dimitrov, 2002). The α coefficient is the most widely used procedure for estimating reliability in applied research [12]. The Cronbach’s coefficient measures whether multiple observed variables (items) in a scale collectively measure an underlying, non-directly observable concept which value ranges from 0 to 1. The higher the coefficient value of the test result, the higher the reliability. A reliability coefficient of less than 0.6 is generally considered unreliable and requires either a redesign of the questionnaire or an attempt to re-collect the data and analyze it again. A reliability coefficient between 0.6 and 0.7 is considered credible, between 0.7 and 0.8 is considered more credible, and between 0.9 and 1 is considered very credible.
In this analysis, the results of the reliability analysis are shown in Table 9, where the reliability coefficients of container port siting as well as each dimension are in the range of 0.8-1. Therefore, the scales used in this study have good internal consistency and good reliability.

Analysis process - validity analysis, from the model fit test results presented in Tab 9, it can be observed that CMIN/DF (Chisquare/ Degrees of Freedom Ratio) = 1.053 (optimal range 1-3), RMSEA (Root Mean Square Error of Approximation) = 0.011 (excellent <0.05). Additional indices including IFI, TLI, and CFI all exceeded 0.9, achieving benchmark excellence. These results collectively confirm satisfactory goodness-of-fit for the Congestion Factor Confirmatory Factor Analysis (CFA) model (Table 10).

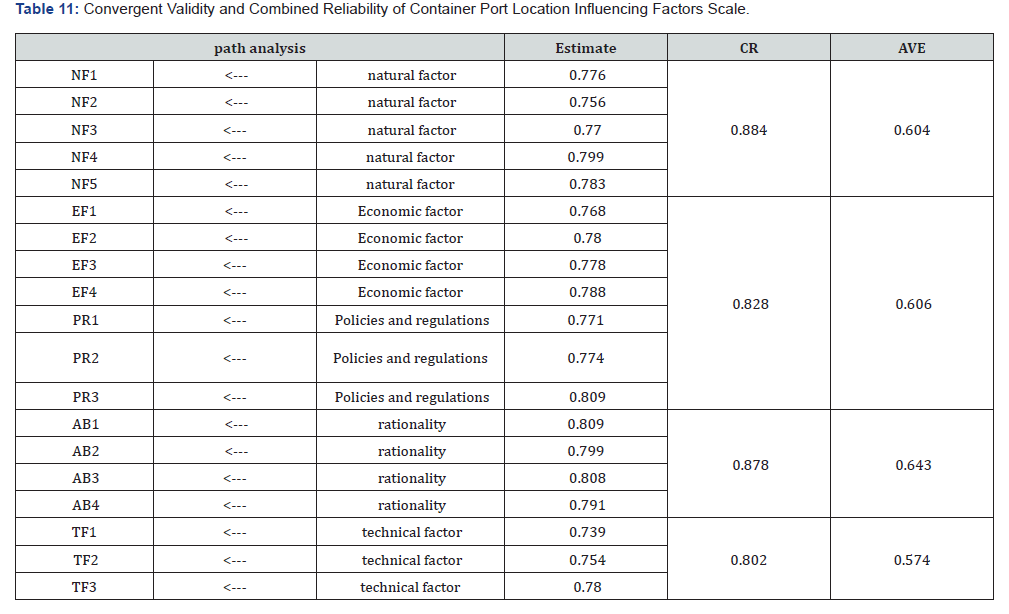
Based on the premise that the CFA model of the factors influencing the siting of congested containers has good fit, the convergent validity (AVE) and combinatorial reliability (CR) of each dimension of the scale will be further examined. Convergent validity is the assessment to measure the level of correlation of multiple indicators of the same construct that are in agreement. To establish convergent validity, the factor loading of the indicator, composite reliability (CR) and the average variance extracted (AVE) have to be considered. The value ranges from 0 to 1. AVE value should exceed 0.5 so that it is adequate for convergent validity [13]. It integrates the effects of factor loadings and error variance. The test procedure calculates the standardized factor loadings of each measurement question item on the corresponding dimension through the established CFA model. Then the convergent validity value and the combined reliability value of each dimension are calculated by the formula of AVE and CR. According to the standard, the AVE value is required to reach a minimum of 0.5,and the CR value is required to reach a minimum of 0.7, in order to show that there is a good convergent validity and combined reliability.
This is the example 6 and 7 of equation

AVE = (Σλ 2 )/ n (6)

n is the number of measures of the factor
CR = (Σλ 2 )/ (Σλ 2 )+ Σδ (7)
According to the results of the analysis, it can be seen that in the validity test of this congestion factor scale, the AVE value of each dimension reaches more than 0.5, and the CR value reaches more than 0.7, which comprehensively can indicate that each dimension has a good convergent validity and combined reliability (Table 11).
According to Fornell and Larker [14], if the AVE for each construct is greater than its shared variance with any other construct, discriminant validity is supported [15] (Table 12).

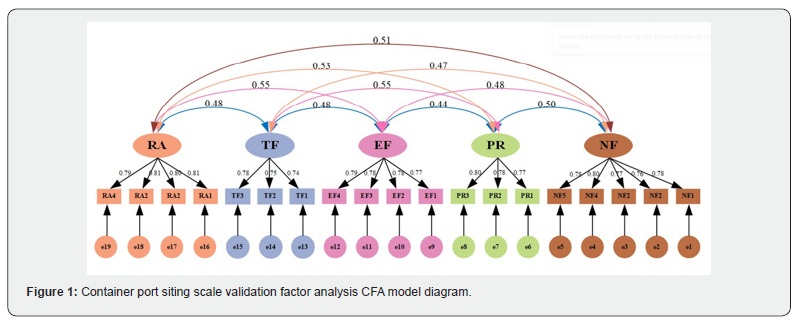
According to the results, we can see that the items can effectively reflect the characteristics of latent variables, and each dimension has good discrimination validity (Figure 1).
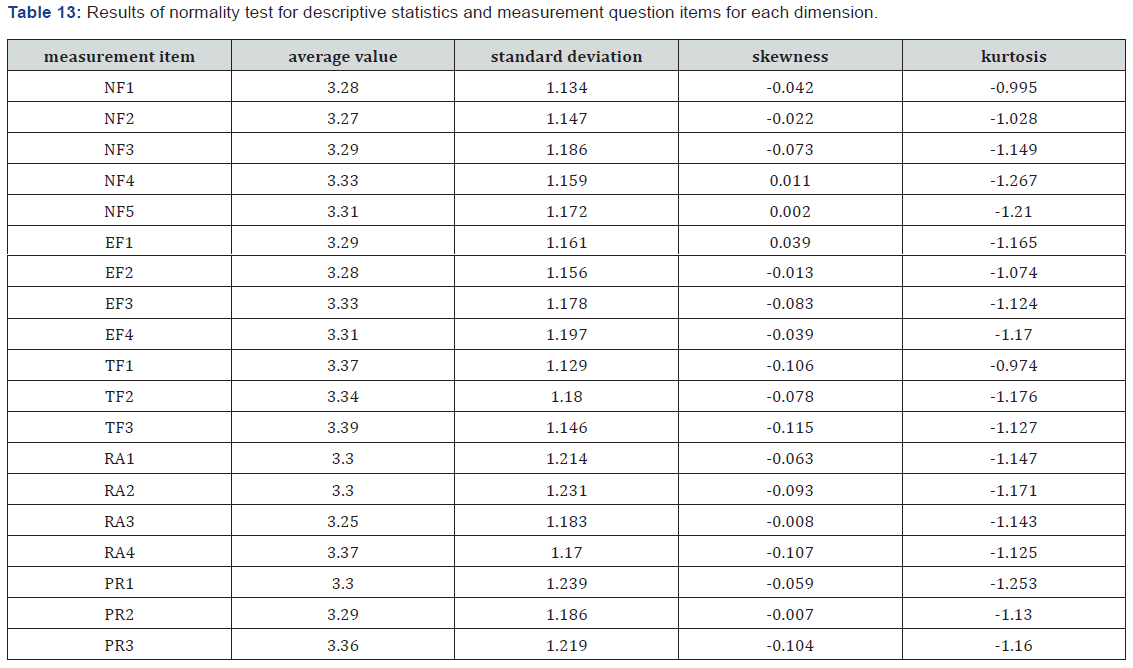
Descriptive statistics and normality test-the following are the results of descriptive statistics analysis and normality test of the current status of factors used in this study. According to the results of the descriptive statistics analysis, it can be seen that the mean scores of each variable are between 2-4, and the scale is scored as 1-4 positive, so it can be seen that the impact of each factor on the location of container ports in this study is above the medium level. The normality of data can be checked also according to skewness and kurtosis. Even though skewness and kurtosis are widely used in practice, there is no general rule defining the values that indicate normality. Some papers reported that up to an absolute value of 1 for skewness and kurtosis might be translated to normality, while other reports suggested much larger values of skewness and kurtosis to test the normality of the data (Şirin et al, 2018) [16]. According to Kline (1998), if the absolute value of skewness coefficient is within 3, and the absolute value of kurtosis coefficient is within 8, the data can be considered as a normal distribution. Based on the results of the analysis in Table 13, it can be seen that the absolute values of the skewness and kurtosis coefficients for each measurement question item in this study are within the standard range. Therefore, it can be stated that the data of each measurement question item satisfies the approximate normal distribution.
SEM model fitness (test for factors influencing container port siting): With the guarantee of significant path coefficients, there are policy and regulation PR affecting natural factor NF, policy and regulation PR affecting technological factor TF, technological factor TF affecting natural factor NF, natural factor NF affecting economic factor EF, technological factor TF affecting economic factor EF, and natural factor affecting reasonableness RA, economic factor EF impact reasonableness RA ,the main influence relationship between latent variables. Economic factor EF influences rationality RA, obtaining the following path relationship.
According to the results of the analysis in Table14, it can be seen that in the path hypothesis relationship test of this study, the policy and regulation factors (PR) are positively correlated with the technical factors (TF) and natural factors (NF), the technical factors (TF) are positively correlated with the natural factors (NF) and the economic factors (EF), the natural factors (NF) and the economic factors (EF) are positively correlated with the rationality of the site selection (RA), and from the Table It can be seen that Estimate are above 0.3 indicating that the correlation is more significant. In conclusion, the hypotheses of this pathway are valid.

Analysis of results-Combining the above structural equation modelling (SEM) analysis results, the path relationships and weights of the four core factors (nature, economy, technology, policies and regulations) affecting container port site selection have been verified through validated factor analysis (CFA) and model fitness test. The specific analyses are as follows:
Direct weighting analysis: From Figure 2, the direct impact weights are ranked with economic factors (EF) being the most critical driver with a standardized estimate of 0.406 (p<0.001), natural factors (NF) are the next most important (0.352, p<0.001).
Mediation effect analysis (technology-led chain reaction, the dual transmission mechanism of policies and regulations): TF→NF forms the transmission path of technology-enabled natural conditions, and the development of technology, TF→EF embodies the technology-enabled economic benefits. It is manifested as technology inputs reduce operating costs and enhance throughput efficiency, thus improving the return on port investment. The total effect size reaches 0.332, indicating the importance of technology- led chain reaction for container port site selection.
The dual transmission mechanism of policies and regulations: The indirect effect of PR→TF suggests that technology drives technological innovation. For example, policies and regulations significantly and positively predict technological factors through institutional incentives (green port certification, technology subsidies). PR→NF indicates that policies and regulations (PR) guide environmental adaptation and significantly positively predict natural factors (NF) through constraints such as ecological red line planning and pollution emissions. The total effect size reaches 0.308, indicating that policies and regulations play a role through the dual channels of technological upgrading (mediation) and environmental adaptation (direct). In summary, the dual-track paths of institution-driven-technology upgrading and institution-constrained- ecological adaptation are formed.
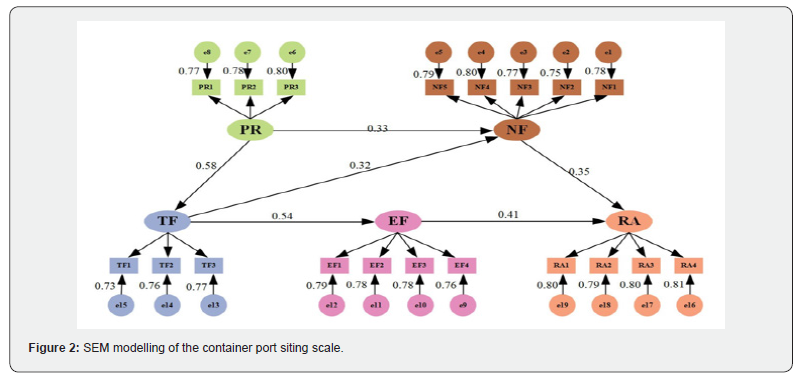
Intermediary hubs: As can be seen from the figure 2, technology, policies and regulations ultimately converge on the intermediary hubs natural factors (NF) and economic factors (EF), which reflect a combination of the port’s long-term environmental stability, operating costs and revenue potential, and ultimately decide on the reasonableness of the site selection.
Comprehensive weighting analysis: In the section of comprehensive weighting analysis, economic factors (EF) through the direct path EF→AB weight share of 0.406 to become the main driving factor. Natural factors (NF) through the path NF →AB weight share of 0.352 and economic factors (TF) through the path TF→EF→AB and TF→NF→AB total effect amount reaches 0.332, the two weights of the balanced, followed by the second policy and regulatory factors.
Taken together, the model reveals the important influence of the “economy-nature-technology-policies and regulations” on the location of container ports.
Discussion & Results
The present study employs a hybrid decision-making framework integrating hierarchical analysis (AHP) and structural equation modeling (SEM) to systematically explore the key influencing factors of container port siting and their functioning mechanisms. The evaluation system encompasses four factors: nature, economy, policies and regulations, and technology. Through expert scoring and empirical data analysis, the study derives the following conclusions.
a) Economic priority: Prioritize the layout of highly automated ports in policy-supported areas (e.g., free trade zones) to compensate for the lack of natural conditions with technological breakthroughs.
b) Policy synergy: Promote the synergies between policies. istic development of technological innovation and ecological adaptation through the design of systems such as green port certification and technological subsidies.
c) Dynamic planning: Establish a dynamic siting model in combination with regional trade fluctuations and climate change to enhance long-term adaptability
Conclusion and Future Prospects
expert experience and empirical data and breaks through the limitations of a single model. AHP quantifies the static weights, and SEM reveals the dynamic path relationships, providing an analytical tool with a subjective and objective perspective for multi-criteria decision-making problems.
Data limitations: The sample focuses on domestic port practitioners and the cross-country universality of the findings needs to be further verified. Dynamic variables such as international trade fluctuations and geopolitics are not included.
Technology frontier expansion in the future: the impact of emerging technologies such as artificial intelligence (e.g., intelligent scheduling algorithms) and blockchain (e.g., supply chain transparency) on port siting can be explored, and a technology-enabled dynamic decision-making framework can be constructed.
Container port siting is a complex systematic project, which needs to consider economic efficiency, technical feasibility, natural constraints and policy orientation. This study reveals the synergistic mechanism of multiple factors through a hybrid model, which provides a scientific basis for the optimization of global supply chains and the sustainable development of ports. The conclusions of this study not only enrich the theory of port planning, but also provide a practical framework for decision makers, which has important academic value and practical significance.
Acknowledgment
The authors gratefully acknowledge the support from: Special Funds for Marine Economic Development of the Guangdong Province (NO GDNRC [2023]51), Zhanjiang Science and Technology Tackling Topic (Unsubsidized), VR System for Vessel Operation in the Water Area of Zhongke Refining and Chemical( Zhanjiang) Terminal Berth based on FVCOM Flow Field(Grant NO.2020B01393),The Key Area Project of Ordinary Universities in Guangdong Province (Grant NO. 2024ZDZX3054), The Fund of Guangdong Provincial Key Laboratory of Intelligent Equipment for South China Sea Marine Ranching(Grant NO. 2023B1212030003),- Comprehensive Evaluation of Risks of Calling and Departure of Ultra-large Vessels in Xiashan Port Area of Zhanjiang Port(Grant NO. 2020B01235),Research on Key Technology of Safety Guarantee for Ultra-large Ships Entering and Leaving Port Based on AIS Data(Grant NO. R20071).
References
- Cullinane K, Fei W T, Cullinane S (2004) Container terminal development in Mainland China and its impact on the competitiveness of the port of Hong Kong. Transport Reviews 24(1): 33-56.
- Xiao D, Zhao J, Zhang YM, Qu HY (2011) Analysis of Assessing the Site Selection of Port Based on Entropy Weight. Ship & Ocean Engineering 40(5): 147-149.
- Guochen Li (1993) Application of Grey System Correlation Degree in Harbour Site Selection. Journal of Hohal University 4: 75-80.
- Guoguang Xu (1990) The Multiobjective Fuzzy Preference Relations Method in Selecting Port Location. Journal of Shanghai Maritime University 2: 42-51.
- Sipahi S, Timor M (2010) The analytic hierarchy process and analytic network process: an overview of applications. Management decision 48(5): 775-808.
- Ugboma C, Ugboma O, Ogwude IC (2006) An analytic hierarchy process (AHP) approach to port selection decisions - empirical evidence from Nigerian ports. Maritime Economics & Logistics 8: 251-266.
- Gao X (2018) Evaluation of Navigation Safety in Port Water Area Based on Fuzzy AHP-DEMATEL Method. Dalian Maritime University.
- Ge X (2022) Study on the Location of Inland Port of Container Port under the Mode of International Transportation. Dalian Maritime University.
- Gyani J, Ahmed A, Haq MA (2022) MCDM and various prioritization methods in AHP for CSS: A comprehensive review. IEEE Access 10: 33492-33511.
- Zainudin A, Asyraf A, Mustafa M (2016) The Likert scale analysis using parametric based Structural Equation Modeling (SEM). Computational Methods in Social Sciences 4: 13-21.
- Kennedy I (2022) Sample size determination in test-retest and Cronbach alpha reliability estimates. British Journal of Contemporary Education 2(1): 17-29.
- Ab Hamid MR, Sami W, Sidek MHM (2017) Discriminant validity assessment: Use of Fornell & Larcker criterion versus HTMT criterion. Journal of physics: Conference series. IOP Publishing 890(1): 012163.
- Fornell C, Larcker DF (1981) Evaluating structural equation models with unobservable variables and measurement error. J Market Res JMR 18(1): 39-50.
- Carter SR (2016) Using confirmatory factor analysis to manage discriminant validity issues in social pharmacy research. International Journal of Clinical Pharmacy 38(3): 731-737.
- Hatem G, Zeidan J, Goossens M, Moreira C (2022) Normality testing methods and the importance of skewness and kurtosis in statistical analysis. BAU Journal-Science and Technology 3(2): 7.


