




 OFOAJ Home



Abstract
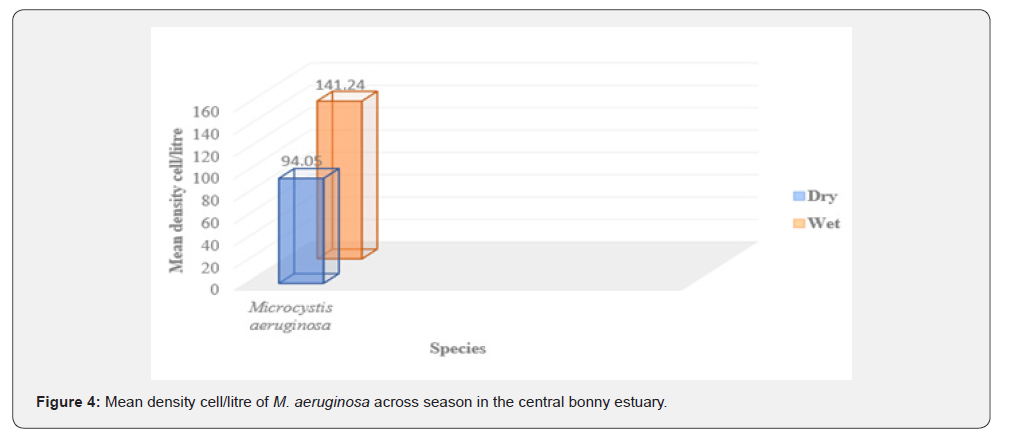
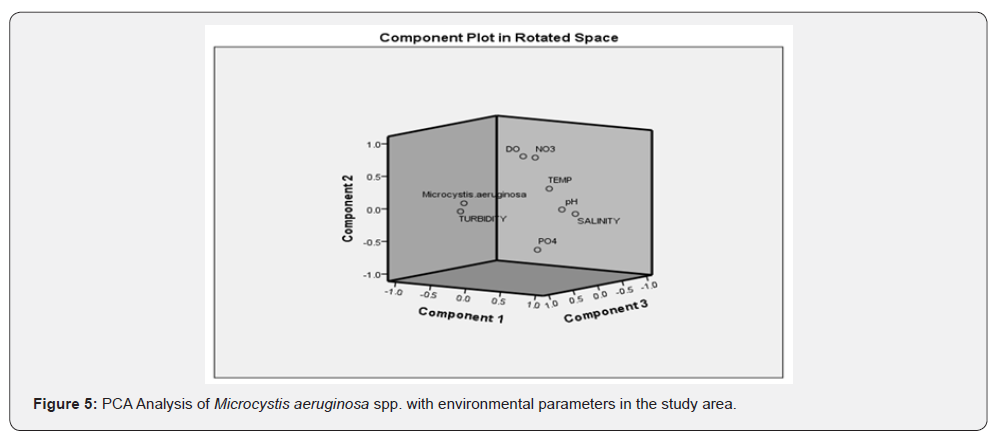
This study examined the seasonal abundance of harmful Microcystis aeruginosa species in the Central Bonny Estuary between December 2019 and November 2020. Four sampling stations were established with the Arc GIS tool. Microalgal species was sampled with 20μm mesh plankton net to provide a quantitative account of the algal species. The nutrients were analysed in the laboratory using the APHA 4500 Method while physico-chemical characteristics were determined in-situ. The physico-chemical and nutrient parameters were within the acceptable range, except for higher values of phosphate. The mean density value per litre of Microcystis aeruginosa species ranged from 2.19 x 10² Cells.L-1 in station 3 to 1.17 x 10² Cells.L-1 at station 2. Seasonal distribution revealed that the species increased across seasons from dry (0.94 x 10² Cells.L-1) to wet (1.41 x 10² Cells.L-1). Principal component analysis revealed that all environmental parameters were positively correlated with the species except turbidity. This study therefore provided information on the seasonal abundance of Microcystis aeruginosa species in the Central Bonny Estuary.
Keywords:Environmental gradient; Variation; Harmful algae; Bonny Estuary
Introduction
Estuarine ecosystems are environmentally unstable, in contrast to freshwater and marine ecosystems [1]. While brackish and estuarine systems have supported CyanoHABs for thousands of years, cyanobacteria species introduced from freshwater environments are increasingly found in coastal waters where they can compete with other phytoplankton species [2]. The blooms of toxin-producing cyanobacteria frequently observed in estuarine and lagoon environments have been registered in various parts of the world and have caused the intoxication and death of domestic and wild animals [3,4]. The occurrence of harmful cyanobacterial blooms is a natural phenomenon that has occurred throughout history with a global problem affecting freshwater, saline, and marine water bodies with aesthetic appearance and also fish production [5]. Eutrophication is the process of adding nutrients to recipient bodies and the effects of this addition. Therefore, it is a phenomenon associated with the nutritive enrichment of these bodies by substances, mainly nitrogenous and phosphorus compounds, that are organic and inorganic [6]. The phytoplankton first responds to these changes in the water body, and one of the main consequences of this response is the formation of blooms.
The genus Microcystis (Lemmermann), class Cyanophyceae and order Chroococcales, is composed of cyanobacteria that potentially form large blooms and possess gaseous vacuoles that give them the ability to disperse rapidly in the water column. The consequences of this state are a reduction in the dissolved oxygen of the water due to the increase in the metabolic activity of the aerobic bacteria responsible for the decomposition of the organic matter and the production of toxins by some species of cyanobacteria [7]. The species M. aeruginosa (Kützing) Kützing 1846, is generally associated with toxicity problems in water, and its occurrence is indicated at several localities in south and southeastern Brazil [8]. Blooms of this species produce toxins and have been implicated in the mass mortality of aquatic animals and the destabilization of food webs [9].
The transfer of freshwater cyanobacteria to estuaries has been observed worldwide [10], in Africa [11], the USA [12], South America [13], Australia [14], Europe [15] and Turkey [16]. The majority of these studies reported on the cyanobacterial transfer being dominated by Microcystis aeruginosa, demonstrating a certain salt tolerance of that species [10]. In particular, MC transfer to the coastal environment resulting from freshwater discharge from an upstream reservoir has only been reported in Italy [17], Japan [18] and recently in France [15].
Reports of CyanoHABs in brackish waters are on the rise [19], yet MCs remain under-investigated in estuarine and marine waters. Since coastal watersheds support more than half of the world’s population [20,21]. It is critical to better understand MC dynamics in saline environments. Other than the review by Vareli et al. [22]. emphasizing MC production by marine phytoplankton, there is little summary literature on MC-producing CyanoHABs in marine and estuarine systems.The present work has the objective of evaluating the seasonal abundance and the distribution of harmful Microcystis aeruginosa cyanobacteria in the central bonny estuary in the Niger delta region of Nigeria.
Materıals and Methods
Study area
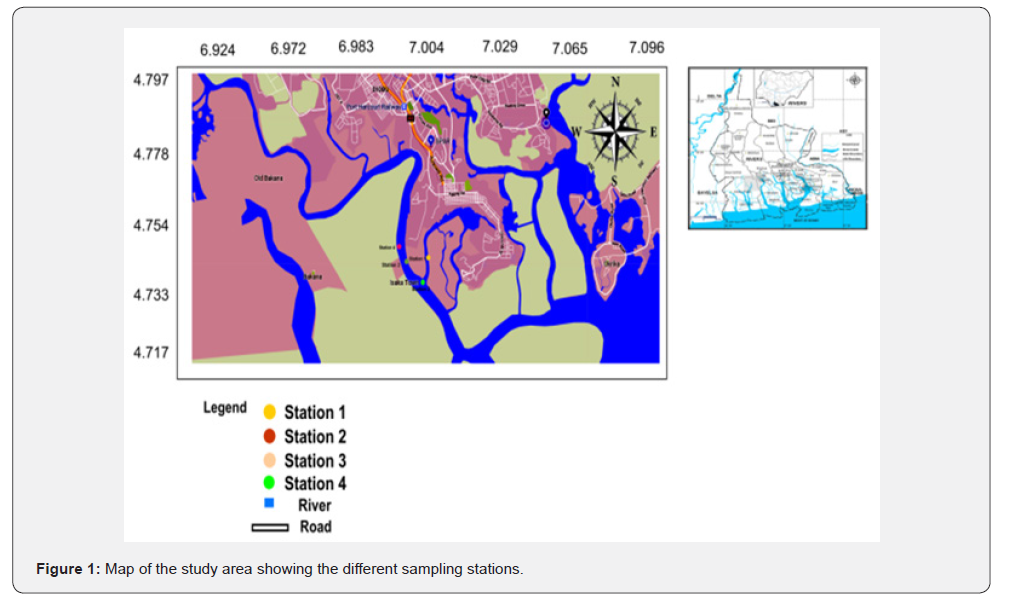
The Bonny Estuary is one of the numerous low land coastal waters of the Niger Delta Complex. It is located between 4° 25’’ and 4° 50’’ N latitude and 7° 0’’ and 7°15’’ E longitude in River State, Nigeria (Figure 1). It is mainly brackish with very little freshwater discharge, mostly from the New Calabar River system. It consists of a main river channel and a large number of associated creeks and creek-lets. The Bonny Estuary is a major shipping route for crude oil and other cargoes, and leads to the Port Harcourt quays, Federal Ocean Terminal, Onne, and the Port Harcourt Refinery terminal jetty, Okirika. The Bonny Estuary (maximum width of 2km and maximum depth of approximately 15m near the mouth) has the largest tidal volume of all river systems in the Niger Delta and it is mostly affected by tidal movement. The salinity fluctuates with the season and the tidal regime is influenced by the Atlantic Ocean [23]. The climate of the study area is tropical and is marked by two distinct seasons, the dry season (November - March) and the wet season (April - October).
Sampling stations
Four sampling stations were established through a reconnaissance preliminary survey of the estuary course at 500m intervals using the ArcGIS Version 10.0. [24]. The sampling stations were established based on ecological settings, vegetation and human activities in the area. The stations chosen included Station 1(Ebetu) Station 2 (Isaka open river), Station 3 (Isaka main town), Station 4 (Back of Ibeto cement) as shown in figure 1.
Collection and assessment of water quality variables
Physico-chemical parameters: Temperature (oC), Salinity (ppt), pH, Dissolved Oxygen (mgl-1) and Turbidity (NTU) were measured in-situ with a Horiba water checker (Model: Extech D0700) at each sampling location. The surface water samples for nutrients (PO4, and NO3) were collected at neap tide at a depth of 5cm with pre-cleaned plastic container. All the samples were collected in triplicate and were kept in ice-chest box and taken to the laboratory for nutrient analysis using [25].
Collection of water samples and algae
Water samples for quantitative analysis of algae were collected monthly from four sampling stations from December ,2019 to, November, 2020 (12months) using a 20-litre bucket for five times into 20μm mesh size plankton net which was held in a vertical position. Net catches were transferred into a 250ml plastic container and preserved with 4% formalin solution which was concentrated to 10ml in the laboratory.
Enumeration of harmful Microcystis aeruginosa spp
Microcystis aeruginosa species of microalgae were enumerated using the Lackey Drop Micro-transect Counting Method [26]. The sample was mixed well before sub-sampling a drip of 0.05ml onto a glass-slide in triplicate with cover-slip. The processed volume and the number of observed microalgae were known in a given volume; their abundance was counted with a low power objective with an inverted microscope (Leica DMIL). Microphotographs of harmful Microcystis aeruginosa species were taken by employing a camera that was fixed to the microscope. Reference materials: [27] and [28] were employed to identify the algae.
Individuals per ml was calculated
(Number (No.) Individuals) ⁄(ml=(C x TA)/(A x S x V))
Where,
C = Number of Organisms Counted; TA = Area of the Cover Slip,
mm2 ; A = Area of One Strip, mm2; S = Number of Strips Counted,
and V = Volume of Sample Under the Cover Slip, ml
Results were converted and expressed as Number (No.) of Cells per litre (Cells.L-1).
Statistical analysis
Statistical analysis was done using the Statistical Package for Social Science (SPSS) 16.0 windows [29]. One-way Analyses of variance (ANOVA) were employed for the statistical interpretation of data to compares the means while Post hoc - Duncan’s test, was used to determine significant difference across the station in the study. Spatial variation of the various environmental parameters and harmful algal species across the season was done using Student’s T-test. Principal component analysis (PCA) was used to analyse the relationship between Microcystis aeruginosa species and significant environmental factors using PAST software [30].
Results
Table 1 shows the mean value of the environmental parameters the Central Bonny estuary. There is a significant a difference across the stations (p<0.05). pH, turbidity and phosphate showed no significant difference for p value. (p<0.01).
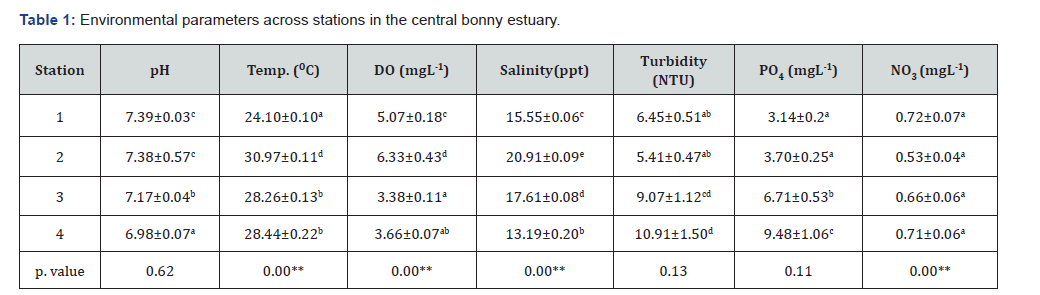
*Superscripts of the same alphabet are not significantly different (P>0.05) **Superscripts of different alphabets are significantly different (P<0.05).
**Significant at p<0.01.
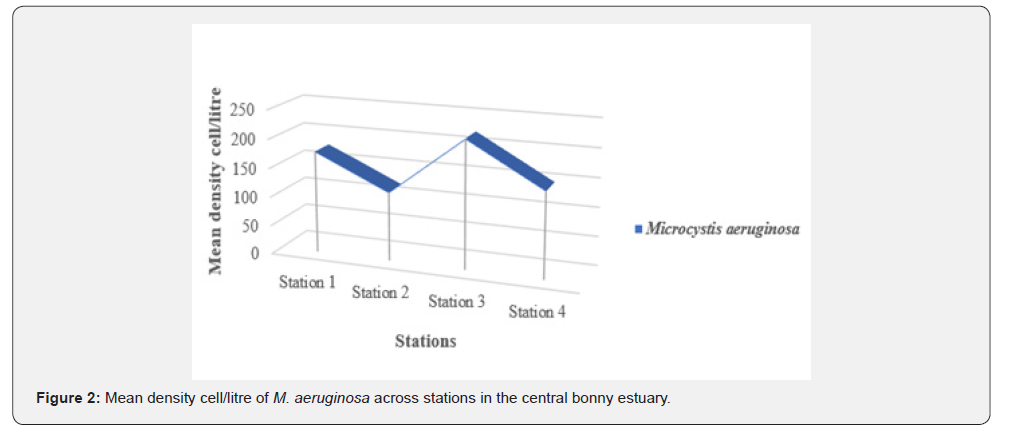
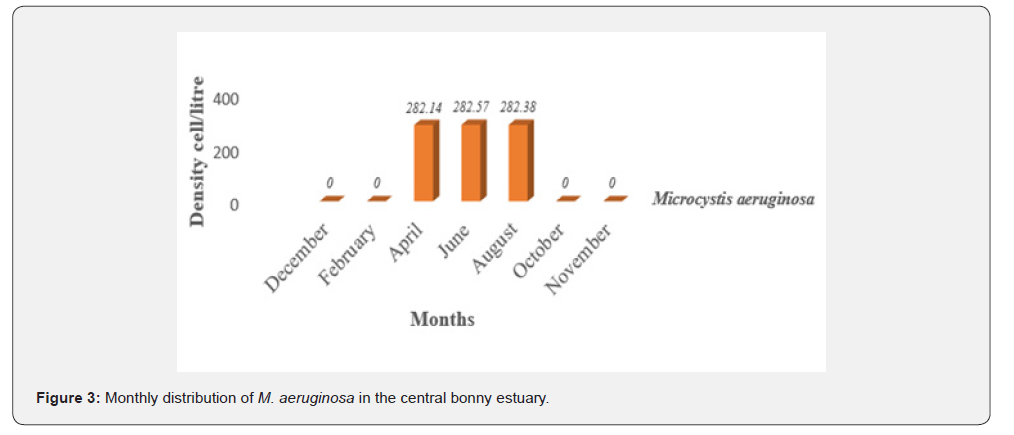
Figure 2 showed the mean density value per litre of M.aeruginosa species. The highest value of 219.10 CellsL-1 was recorded in station 3 followed by 174.9 CellsL-1 in station 1, while the lowest cell density value of 117.0 CellsL-1 was recorded in station 2. The monthly distribution of M.aeruginosa species in figure 3 showed that the highest density value per litre was recorded in the month of June, followed by the month of August, while the least density value per litre was recorded in the month of April. The seasonal distribution of M.aeruginosa species in figure 4 below showed that the species increased across the season from dry to wet, while figure 5 showed the principal component analysis where all environmental parameters were positively correlated with the species except turbidity.
The environmental gradients in this study showed there is spatial variation across the parameters except nitrate across the stations. The pH and temperature values recorded were within the recommended range with reference to the location in the Niger Delta region for aquatic life and World Health Organisation limits [31]. Dissolved oxygen and salinity values showed a slight variation across the stations along the Bonny Estuary, which is in agreement with the report of Clarke [32]. in the estuary. This trend is attributed to effluent water discharge from several industrial establishments carrying out bunkering activities and domestic activities that are prevalent along the estuary. Turbidity slightly varied across the stations, the higher turbidity observed in this study may be attributed to high surface runoff, overland flow as well as the higher release of organic wastes into the estuary, with a similar trend reported by Chindah and Nduaguibe [33,34], both in the lower Bonny estuary. The observed phosphate concentrations in this estuary were higher than the tolerable limit of 0.10mgL-1 in flowing waters recommended by [35]. Falomo [36] reported a mean phosphate of 1.4mgL-1 in Okrika Creek, central Bonny Estuary, while [37] recorded (4.95-14.73 mgL-1) at polluted sites in the upper Bonny estuary. However, natural inputs from decay of organic matter might be a contributor to the high phosphate concentrations in the Bonny Estuary. The range of nitrate recorded in this study was below the statutory limit of 25-50mg/L given by [38] and 20mg/L [39]. Nitrate does not pose a health threat but it is readily reduced to nitrite by the enzyme Nitrate reductase which is widely distributed and abundant in both plants and micro-organisms [40].
Estuaries generally range in salinity between 0.5 and 17 [41] which is within reported salt tolerance ranges for M. aeruginosa. Literature reports generally agree that M. aeruginosa has a salt tolerance of ≤10, but a few studies indicate survival at higher salinities. Verspagen et al. [42] reported that, M. aeruginosa has one of the highest salt tolerances of all cyanophytes and can continue to both grow and produce toxins in saline environments. Thus, with salinity increases in estuaries and nearshore coastal areas that are predicted to accompany climate change, salinities should not be a major inhibitor of Microcystis abundance. Tolar [43] also reported that the specific growth rate of M. aeruginosa was unaffected by salinity up to 10 or approximately 30% of seawater salinity. The colonial form of M. aeruginosa has been shown to survive for extended periods of time in the San Francisco Bay Estuary at salinities from 0.1-18 [2], which is in agreement with the abundance of this species in Station 2, where a salinity of 20.91ppt was the highest in the study area. Higher abundance of cyanobacteria is favoured by an increase in phosphorus, which is in agreement with higher phosphate values recorded in this study. Temporary increases in freshwater flow into estuarine environments, following large storm events, have also caused a massive abundance of Microcystis CyanoHABs to form in Australian, North American, and Turkish estuaries [44,16]. Yunes [45]. reported that toxic M. aeruginosa presence was highest in the Patos Lagoon during the rainy season when high freshwater flows drain into the lagoon, which is in agreement with the hhigher density values for this species which were recorded in the wet season. This could be as a result of the influx of nutrients from adjourning freshwater into the estuary.
The abundance of M. aeruginosa density recorded in the principal component analysis was associated with the environmental parameters and showed a higher interaction with reference to temperature, dissolved oxygen, and nitrite increase. Increases in environmental parameters, shifts in hydrologic patterns, and further enhancement of nutrient concentration as well as light for photosynthesis associated with expanding human populations and climate change are expected to increase M. aeruginosa prevalence in estuarine phytoplankton communities [46,47]. Various environmental parameters may be responsible for the existence of a dominant Microcystis species in an environment [48]. Fluctuations in the salinity, DO, pH and nutrients in the estuarine habitats are due to the influx of freshwater from land run off, caused by monsoon or tidal variations [49]. These results are similar to those found in two reservoirs and two lakes near the Loire River itself [50]. Paldavicien et al. [51] reported that and high nutrients are cited as one of the main reasons for M. aeruginosa proliferation throughout the Baltic Sea, with long residence times and vertical stratification, which makes the waterbody particularly sensitive to eutrophication. Also,in the Río de la Plata estuary, increased nutrients from urban expansion, agriculture, poor wastewater treatment and industry have been correlated to increasing M. aeruginosa abundance [52]. Concentration of nitrogen and phosphorus, as well as light has been considered as determining factors for the Microcystis abundance development [53,54]. Similarly, in the Patos Lagoon, Brazil, eutrophication from agricultural activities and human sewage is the driver of M. aeruginosa blooms [55]. Episodic rainfall events and major storms that mobilize nutrients will increase nutrient enrichment of estuarine receiving waters in the future, promoting bloom potential [56].
Conclusıon
The abundance of M. aeruginosa was determined by various environmental factors such as temperature, DO, salinity, and nutrients (phosphate and nitrite). The presence of this species is considered a potential health risk for the inhabitants and aquatic resources in case of a possible bloom in the study area. Specifically, there is a need for further studies to address how climate change will affect the dynamics of this species in coastal waters. A better understanding of how climate change affects harmful M. aeruginosa in coastal waters in the Niger delta region will help scientists, water managers, and human health officials take the necessary steps to protect environmental and human health. Therefore, there is a need management practice actions or measures.
References
- McLusky DS, Elliott M (2004) The estuarine ecosystem. Oxford University Press, Oxford.
- Lehman PW, Boyer G, Hall C, Waller S, Gehrts K (2005) Distribution and toxicity of a new colonial Microcystis aeruginosa bloom in the San Francisco Bay Estuary, California. Hydrobiologia 541: 87-99.
- Carmichael WW (1992) Cyanobacterial secondary metabolites - the cyanotoxins. J Appl Bacteriol 72(6): 445-459.
- Lawton LA, Cood GA (1991) Cyanobacterial (blue-green algal) toxins and their significance in UK and European water. J IWEN, UK, pp. 460-465.
- Chellappa Sl, Marinho IR, Chellappa NT (2004) Freshwater phytoplankton assemblages and the bloom of toxic Cyanophyceae of Campo Grande reservoir of Rio Grande do Norte State of Brazil. Indian Hydrobiology 7: 151-171
- Molica R, Azevedo S (2009) Ecophysiology of cyanotoxin-producing cyanobacteria. Brazilian ecology 13(2): 229-246.
- Sivonen K, Jones G (1999) Cyanobacterial toxins. In: Chorus I, Bartram J (Eds.), Toxic Cyanobacteria in water - A guide to their public health consequences, monitoring and management. E&FN Spon, London, pp. 55-124.
- Takenaka RA, Dellamano OMJ, Rocha O (2007) Toxicity of extracts of cyanobacterial blooms from reservoirs of the Tietê River, SP, to the daphnids Ceriodaphnia dubia and Ceriodaphnia silvestri (Cladocera, Crustacea). Journal of the Brazilian Society of Ecotoxicology 2: 147-156.
- Oberholster PJ, Botha AM, Grobbelaar JU (2004) Microcystis aeruginosa: source of toxic microcystins in drinking water. African Journal of Biotechnology 3: 159-168.
- Preece EP, Hardy FJ, Moore BC, Bryan M (2017) A review of microcystin detections in Estuarine and Marine waters: Environmental implications and human health risk. Harmful Algae 61: 31-45.
- Ndlela LL, Oberholster PJ, Van Wyk JH, Cheng PH (2016) An overview of cyanobacterial bloom occurrences and research in Africa over the last decade. Harmful Algae 60: 11-26.
- Peacock MB, Gibble CM, Senn DB, Cloern JE, Kudela RM (2018) Blurred lines: Multiple freshwater and marine algal toxins at the land-sea interface of San Francisco Bay, California. Harmful Algae 73: 138-147.
- Dörr FA, Pinto E, Soares RM, Azevedo SMFO (2010) Microcystins in South American aquatic ecosystems: occurrence, toxicity and toxicological assays. Toxicon 56(7): 1247-1256.
- Orr PT, Jones GJ, Douglas GB (2004) Response of cultured Microcystis aeruginosa from the Swan River, Australia, to elevated salt concentration and consequences for bloom and toxin management in estuaries. Mar Freshwater Res 55(3): 277-283.
- Bormans M, Amzil Z, Mineaud E, Brient L, Savar V, et al. (2019) Demonstrated transfer of cyanobacteria and cyanotoxins along a freshwater-marine continuum in France. Harmful Algae 87: 101639.
- Taş S, Okus E, Aslan YA (2006) The blooms of a cyanobacterium, Microcystis cf. aeruginosa in a severely polluted estuary, the Golden Horn, Turkey. Estuary, Coast Shelf Sci 68(3-4): 593-599.
- De Pace R, Vita V, Bucci MS, Gallo P, Bruno M (2014) Microcystin contamination in sea mussel farms from the Italian southern Adriatic coast following cyanobacterial blooms in the artificial reservoir. J of Ecosystems.
- Umehara A, Komorita T, Tai A, Takahashi T, Orita R, et al. (2015) Short-term dynamics of cyanobacterial toxins (microcystins) following a discharge from a coastal reservoir in Isahaya Bay, Japan. Marine Pollution Bulletin 92(1-2): 73-79.
- Paerl HW, Paul VJ (2012) Climate change: Links to global expansion of harmful cyanobacteria. Water Research 46(5): 1349-1363.
- National Oceanic and Atmospheric Administration, [NOAA]. (2012) Spatial Trends in Coastal Socioeconomics Demographic Trends Database. pp. 445-459.
- Ache BW, Crossett KM, Pacheco PA, Adkins JE, Wiley PC (2013) The coast is complicated: a model to consistently describe the nation’s coastal population. Estuaries Coasts p. 1-5.
- Vareli K, Jaeger W, Touka A, Frillingos S, Briasoulis E, et al. (2013) Hepatotoxic seafood poisoning (HSP) due to microcystins: a threat from the Ocean. Mar Drugs 11(8): 2751-2768.
- Dangana LB (1985) Hydro-geomorphological controls of the mangrove environment. In: Proceedings of a Workshop on the mangrove ecosystem of the Niger Delta. University of Port Harcourt, pp. 357.
- Redlands CA (2010) ArcGIS. Version 10.0. Environmental Systems Research Institute, Inc.
- American Public Health Association. (APHA) (2012) Standard methods for the examination of water and wastewater. (22nd), Washington (DC): American Public Health Association (APHA), American Water Works Association (AWWA) and Water Environment Federation (WEF).
- American Public Health Association. (APHA) (1998) Standard methods for the examination of water and wastewater. (20th), Washington (DC): American Public Health Association (APHA), American Water Works Association (AWWA) and Water Environmental Federation (WEF).
- Hallegraeff GM, Anderson DM, Cembella AD (1995) Manual on harmful marine microalgae. UNESCO, pp. 1-22.
- Tomas CR (1997) Identifying marine phytoplankton. Academic Press, London, pp. 858.
- Statistical Package for Social Science (2007) SPSS for Windows, Version 16.0. Chicago, SPSS Inc.
- Leps J, Smilauer P (2003) Multivariate Analysis of Ecological Data Using CANOCO. Cambridge University Press, Cambridge.
- World Health Organization (2011) Guidelines for Drinking-water Quality. (3rd), 1 Recommendations, pp. 210-220.
- Clarke OE (2005) The dynamics of plankton population in Ologe Lagoon, Ph. D Thesis. Dept of Zoology. Lagos State University, Lagos, Nigeria, 29: 343.
- Chindah AC, Nduaguibe U (2003) Effect of tank farm wastewater on water quality and periphyton of Lower Bonny River Niger Delta, Nigeria. Journal of Nig Env Soc 1(2): 206-222.
- Vincent AIF, Nwachukwu LC (2016) Comparative Water Quality Assessment of Nembe, Bonny and Iwofe Ferry terminals in Port Harcourt, Nigeria. IOSR Journal of Environmental Science. Toxicology and Food Technology 10(7): 15-19.
- United States Geological Survey (USGS) (2007) Relation between selected water quality variables and climatic factors.
- RO Falomo (1998) The impact of industrial effluents on the distribution of plankton of the Central Bonny Estuary”. M.Sc. Thesis. Dept. of Biological Sciences. Rivers State University of Science and Technology 14: 107.
- Ebere N (2002) The impact of oil refinery effluents on the distribution, abundance and community structure of macrobenthos in Okrika Creek. Ph.D. Thesis. Dept Biological Sciences. Rivers State University of Science and Technology, pp. 383.
- European Economic Community (EEC) (1979) Council directive on the quality of freshwater needing protection or improvement in order to support fish life. Offshore Journal of European Commununities (L259), pp. 1-10.
- United States Environmental Protection Agency (USEPA) (2006) Sediment pollution.
- Glidewell C (1990) The nitrate/nitrite controversy. Chemical Britanica 26(2): 137-140.
- Martín LB, Sevilla E, Bes MT, Fillat MF, Peleato ML (2015) Variation in the synthesis of microcystin in response to osmotic stress in Microcystis aeruginosa PCC7806. Limnetica 34(1): 205-214.
- Verspagen JMH, Passarge J, Jöhnk KD, Visser PM, Peperzak L, et al. (2006) Water management strategies against toxic Microcystis blooms in the Dutch delta. Ecol Appl 16(1): 313-327.
- Tolar S (2012) Salinity Tolerance in Cyanobacteria and Its Implications for Invasion into Estuaries. UNC-Chapel Hill, Chapel Hill, NC (Undergraduate Honors Thesis).
- Robson BJ, Hamilton DP (2003) Summer flow event induces a cyanobacterial bloom in a seasonal western Australia estuary. Mar Freshw Res 54(2): 139-151.
- Yunes JS (2009) Blooms of microcystis in the patos lagoon and estuary (Rio grande do sul, Brazil): at twenty-year study. Oecol Bras 13(2): 313-318.
- Rabalais NN, Turner RE, Díaz RJ, Justic D (2009) Global change and eutrophication of coastal waters. ICES J Mar Sci 66: 1528-1537.
- Fulweiler RW, Rabalais NN, Heiskanen AS (2012) The eutrophication commandments. Mar Pollut Bull 64(10): 1997-1999.
- Takamura N (1988) Ecology of water-blooms of blue-green algae, with special reference to Microcystis. Jpn J Phycol 36: 65-79.
- Rajkumar M, Perumal P, Ashok PV, Vengadesh N, Rajasekar TK (2009) Phytoplankton diversity in Pichavaram mangrove waters from south-east coast of India. Journal Environmental Biology 30(3): 489-498.
- Sabart M, Pobel D, Briand E, Combourieu B, Salençon MJ, et al. (2010) Spatiotemporal variations in microcystin concentrations and in the proportions of microcystin-producing cells in several Microcystis aeruginosa populations. Appl Environ Microbiol 76(14): 4750-4759.
- Paldavicien A, Zaiko A, Marzec HM, Razinkovas BA (2015) Bioaccumulation of microcystins in invasive bivalves: a case study from the boreal lagoon ecosystem. Oceanologia 57(1): 93-101.
- Giannuzzi L, Carvajal G, Corradini MG, Andrade CA, Echenique R, et al. (2012) Occurrence of toxic cyanobacterial blooms in Rio de la Plata estuary, Argentina: field study and data analysis. J Toxicol 9: 1-15.
- Geoffrey PH, Sarnelle O, White JD, Hamilton SK, Kaul RB, et al. (2014) Nitrogen availability increases the toxin quota of a harmful cyanobacterium Microcystis aeruginosa. Water Res 54: 188-198.
- Lee T, Rollwagen BG, Bollens SM, Faber HJJ (2015) Environmental influence on cyanobacteria abundance and microcystin toxin production in a shallow temperate lake. Ecotox Environ Safe 25: 114:318.
- Matthiensen A, Yunes JS, Codd GA (1999) Occurrence, distribution and toxicity of cyanobacteria from the Patos Lagoon estuary, Southern Brazil. Rev Brasil Biol 59(3): 361-376.
- Paerl HW, Huisman J (2009) Climate change: a catalyst for global expansion of harmful cyanobacterial blooms. Environ Microbiol Rep 1(1): 27-37.

























