




 OFOAJ Home



Abstract
The Greenland, the Norwegian, the Barents and the Kara Seas and the adjacent part of the Arctic Ocean are under the warm influence of the North Atlantic. However, the power of this “heater” fluctuates following the changes in atmospheric and oceanic circulation. In the paper the trajectory of propagation of the Atlantic Water (AW) from the tropics and the graph of correlations between the AW temperatures along the trajectory are presented. The data of oceanographic observations in the Barents Sea and the Arctic Ocean, the SST data from reanalysis and the ice cover data from an accessible site were used in this study. A close relationship between the AW temperature fluctuations and the spreading of ice cover in the Barents Sea is shown. The prognostic potential of the established dependencies is indicated.
Keywords:Low latitudes; North atlantic; Atlantic water; Nordic Seas; Arctic Ocean
Introduction
The sub-Atlantic Arctic, including the Greenland, Norwegian, Barents and Kara Seas and the adjacent part of the Arctic basin, is under the warm influence of the North Atlantic [1-9].
The warm salty water inflows through the Faroe-Shetland Strait into the Norwegian, Greenland Seas and the Barents Sea and then the Arctic Basin. Above this water, transports of warm and humid air spread eastward and northeastward into the Arctic seas and the Arctic Basin. Water with positive temperature on the surface of the Barents Sea in the cold part of the year is a powerful “heater” of the Barents Sea region. However, the power of this “heater” fluctuates following the changes in atmospheric circulation and water masses in the North Atlantic, providing heat transfer from low to high latitudes.
Strengthening or weakening of the warm water inflow, reflected by observations at the transect along the Kola meridian [10], determines its distribution across the sea area and affects the position of the maximum southern boundary of ice in the Barents Sea. The correlation between changes in average monthly sea ice extent in the Barents Sea and water temperature at the section along the Kola meridian reaches 0.86 after the ice extent reaches the winter climatic maximum [11].
The ice starts to form in the northern part of the sea under the considerable influence of atmospheric circulation, which leads to significant interannual variations in ice extent during this period. At the same time warm water flowing into the southern part of the sea limits ice spreading southward. The prolonged inflow of warmer and saltier Atlantic waters into the Barents Sea in the 2000s led to a shift of the boundaries of the cod and haddock ranges in a northeasterly direction [12,13]. The ranges of thermophilic species will expand further into the northern and eastern regions if the warming tendency in the waters of the Barents Sea continues.
The inflow of warm and salty water from the North Atlantic is an important process for the climate of the entire marine Arctic. The inflow of Atlantic water into the Arctic basin is part of the global oceanic conveyor belt that links the oceans by transporting heat, salt and fresh water. Coming from the North Atlantic, AWs spread across the waters of the Norwegian, Greenland and Barents Seas and enter into the Arctic basin, where they occupy the intermediate layer at depths of 100 to 800 meters [14-18]. Atlantic water is an important source of heat in the sub-Atlantic sector of the Arctic and a source of salt for Arctic waters undergoing constant desalination.
Materials and Methods
Data from the NCEP reanalysis (1948-2020) [19], ERA5 reanalysis (1979-2020) [20], observation database of the Arctic meteorological stations (1951-2020), Arctic Sea ice extent database of AARI (http://www.aari.ru/datasets) and NSIDS (USA), sea surface temperature of HadISST reanalysis for the period 1979-2020 (https://www.metoffice.gov.uk/hadobs/hadisst/) were used. The changes of sea water inflowing from Atlantic into the Barents Sea were characterized by temperature of water in the layer 50-200 m on transect along the Kola meridian according to data of Polar Branch of the “VNIRO” data at http://www.pinro.ru/labs/hid/ kolsec22.php. The temperatures at the Kola section in the Barents Sea, in the Fram Strait and along the way of AW propagation in the Arctic Basin were used as indicator of the AW propagation to the Arctic. Oceanographic observations in the Arctic Ocean from the 1950s to 2018 were also used. The trajectory of AW propagation from the tropic North Atlantic and graph of correlations between the changes in water temperature at the points along the way with taking into account the lags were constructed.
Results and Discussion
The correlation analysis between the ice extent in the Barents Sea and the water temperature at the transect along the Kola meridian was fulfilled. The closest connection was found for the period from January till June, when the effect of water warming from the atmosphere is minimal. Running averaging of the series with 3 years window allows to detect the climatic components, for which the correlation coefficients were presented in table 1.

High correlation coefficients in the first part of the year were used for the construction of the model of sea ice extent seasonal prediction in the Barents Sea [21]. Statistical analysis of the connection between the mean water temperature in January-June in the layer 50-200m at the Kola meridian transect and sea surface temperature (SST) in the North Atlantic highlighted the tropical area of the North Atlantic in the region (5–25°N, 60–10°W) (Figure 1), that has the greatest impact on the water temperature at the Kola transect with a time lag from 27 (January) to 32 (June) months relative to SST in October.
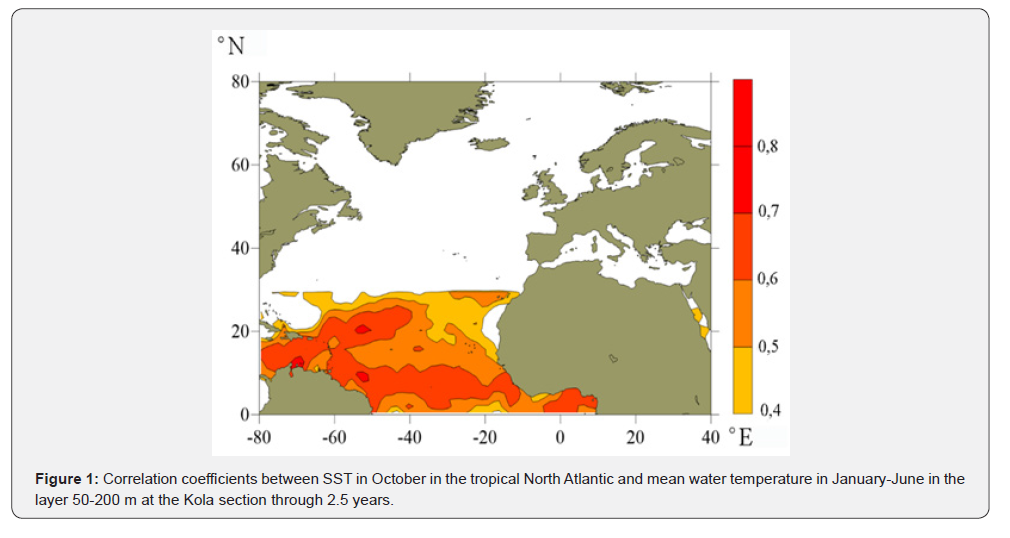
Correlation between SST in the selected area of the North Atlantic and water temperature in the layer 50-200 m at the Kola meridian transect in December-February after 27 months is 0.76 and after smoothing the series with 3 years window increased to 0.90. The analysis of the propagation of warming signal from tropical North Atlantic to the Nordic Seas and further to the Arctic Basin leads to the construction of the trajectory shown in figure 2. Field observation in squares 200 × 200 km in the Arctic Basin between 1963 and 2015 were used to form AW temperature time-series. The coordinates of the square centers are indicated in figure 2. The AW maximum temperature within a square was attributed to the center of that square. The obtained time series yearly values of AW temperature contained gaps, therefore to calculate the correlation between two series, pairs of values in the same year were forming.
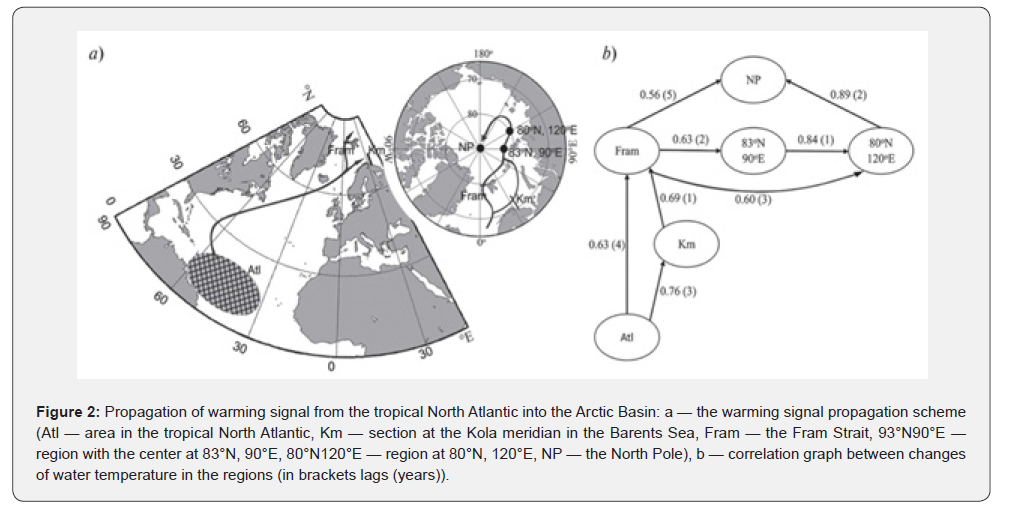
The SST in the Fram Strait has a four-year lag from SST in tropical Atlantic during which interaction between the circulation in the ocean and the atmosphere occurs. Further, the anomaly spreads to the Arctic basin in the AW layer, manifesting itself sequentially at Arctic Cape (Severnaya Zemlya archipelago), at 80°N, 120°E, and reaches the North Pole area in 5 years. The time lag between Atl and Km is 3 years, and between Atl and Fram is 4 years despite the equal or slightly greater distance from Atl to Km, which is explained by the faster signal propagation through the Norwegian and Barents Seas due to the peculiarities of atmospheric circulation. The cyclones passing through the Barents Sea generate SW and W winds that accelerate water transport, while at the back of the cyclones, the NE and N winds over the Norwegian and Greenland Seas slow down West-Spitsbergen Current (WSC). Correlations and lags between anomalies in the Fram Strait, the North Pole (NP) region and the point at 80°N, 120°E do not contradict the condition of transitivity with delays (2+1+2) and (2+1) and correlations (0.63 × 0.84 × 0.89 ≤ 0.56) and (0.63 × 0.84 ≤ 0.60).

*The value of 2.24 for 1998 excluded when calculating the average over the decade.
The correlation coefficients 0.60 and 0.56 are given to check the transitivity of correlations and lag times between points on the diagram. AW between the Fram and the NP does not propagate directly but follows a trajectory along the continental slope and the Lomonosov Ridge. The average AW temperatures in the Fram Strait in different decades (Table 2) show a rapid increase in the 1990s following an increase in AW inflow and temperature.
The mechanism of the influence of the ocean surface temperature anomalies at low latitudes of the North Atlantic on the inflow of AW to the North European basin includes the interaction of oceanic and atmospheric circulation [22]. Positive SST anomalies at the low latitudes of the North Atlantic maintain the negative phase of the NAO, when the zonal wind component over the North Atlantic weakens and a positive SST anomaly form over the entire North Atlantic. With a negative SST anomaly at the low latitudes and a positive NAO index, the zonal wind intensifies, which leads to ocean cooling and the formation of negative SST anomalies. Positive SST anomalies in the tropics of the North Atlantic appear in the Norwegian and Barents Seas three years later [23].
Conclusion
The area of the ocean in the low latitudes where SST affects atmospheric and oceanic transport to the Arctic has been identified and a scheme of transmitting the influence of SST anomalies involving atmospheric and oceanic circulation has been proposed. The influence of SST anomalies in the tropics of the North Atlantic on the Atlantic water inflow to the Nordic Seas is confirmed by the high correlation between SST and water temperature at the Kola meridian transect in the Barents Sea, a representative indicator of changes in the AW inflow into the Nordic Seas.
The impact of SST from the tropics of the North Atlantic is transmitted with the participation of the North Atlantic Oscillation, which changes under the influence of SST anomalies. This is confirmed by the correlation between the SST anomalies and the NAO indices. The correlation between NAO and SST in the North Atlantic is mostly noticeable with the lowest and highest annual NAO values.
Positive SST anomalies at the low latitudes of the North Atlantic contribute to the negative NAO phase, when the zonal wind component over the North Atlantic weakens and a positive SST anomaly is formed over the entire North Atlantic water area. At the negative SST anomaly at the low latitudes and at the positive NAO index, the zonal wind increases, which leads to cooling of the ocean and formation of negative SST anomalies. Positive SST anomalies of the North Atlantic tropics appear in the Norwegian and Barents Seas after three years.
References
- Knipovich NM (1906) Fundamentals of hydrography of the European Arctic Ocean. St Petersburg, Russia, pp. 1510.
- Vize VY (1937) The causes of Arctic warming. Sov Arktika p. 1.
- Zakharov VF (1981) Arctic Ice and Recent Natural Processes. Gidrometeoizdat, Leningrad, Russia, pp. 136.
- Polyakov IV, Pnyushkov AV, Timokhov LA (2012) Warming of the Intermediate Atlantic Water of the Arctic Ocean in the 2000s. J Clim 25(23): 8362-8370.
- Sando AB, Gao Y, Langehaug HR (2014) Poleward ocean heat transports, sea ice processes, and Arctic sea ice variability in NorESM1-M simulations. J Geophys Res Ocean 119(3): 2095-2108.
- Årthun M, Eldevik T, Smedsrud LH (2019) The role of Atlantic heat transport in future Arctic winter sea ice loss. J Clim 32: 3327-3341.
- Wood M, Rignot E, Fenty I, Bjørk A, Broeke MVD, et al. (2021) Ocean forcing drives glacier retreat in Greenland. Sci Adv 7(1): eaba7282.
- Lapointe F, Bradley RS (2021) Little Ice Age abruptly triggered by intrusion of Atlantic waters into the Nordic Seas. Sci Adv 7(51).
- Lundesgaard Ø, Sundfjord A, Lind S, Nilsen F, Renner AHH (2022) Import of Atlantic Water and sea ice controls the ocean environment in the northern Barents Sea. Ocean Sci 18: 1389-1418.
- Boitsov VD, Karsakov AL, Trofimov AG (2012) Atlantic water temperature and climate in the Barents Sea, 2000-2009. ICES J Mar Sci 69: 833-840.
- Alekseev GV, Glok NI, Smirnov AV, Vyazilova AE (2016) The influence of the North Atlantic on climate variations in the Barents Sea and their predictability. Russ Meteorol Hydrol 41: 544-558.
- Jansen T, Post S, Kristiansen T, Óskarsson GJ, Boje J, et al. (2016) Ocean warming expands habitat of a rich natural resource and benefits a national economy. Ecological Applications 26(7): 2021-2032.
- ICES (2020) Working Group on the Integrated Assessments of the Barents Sea (WGIBAR). ICES Scientific Reports 4(50): 206.
- Timofeev VT (1960) Water Masses in the Arctic Basin. Leningrad, Gidrometeoizdat, pp. 190.
- Treshnikov AF, Baranov GI (1972) Structure and Circulation of Water in the Arctic Basin. Leningrad, Gidrometeoizdat, pp. 158.
- Orvik KA, Niiler P (2002) Major pathways of Atlantic water in the northern North Atlantic and Nordic Seas toward Arctic. Geophys Res Lett 29(19): 1-4.
- Carmack EC, Williams WJ, Zimmermann SL, McLaughlin FA (2012) The Arctic Ocean warms from below. Geophys Res Lett 39(7): L07604.
- Polyakov IV, Pnyushkov AV, Alkire MB, Ashik IM, Baumann TM, et al. (2017) Greater role for Atlantic inflows on sea-ice loss in the Eurasian Basin of the Arctic Ocean. Sci 356(6335): 285-291.
- Kalnay E, Kanamitsu M, Kistler R, Collins W, Deaven D, et al. (1996) The NCEP/NCAR 40-year reanalysis project. Bull Amer Meteor Soc 77(3): 437-470.
- Copernicus Climate Change Service (C3S) (2017): ERA5: Fifth Generation of ECMWF Atmospheric Reanalyses of the Global Climate. Copernicus Climate Change Service Climate Data Store (CDS).
- Glok NI, Alekseev GV, Vyazilova AE (2019) Seasonal forecast of sea ice extent in the Barents sea. Arctic and Antarctic Research 65(1): 5-14.
- Hoerling MP, Hurrell JW, Xu T (2001) Tropical origins for recent North Atlantic climate change. Sci. 292(5514): 90-92.
- Alekseev GV, Glok NI, Vyazilova AE, Kharlanenkova NE, Kulakov MY (2021) Influence of SST in Low Latitudes on the Arctic Warming and Sea Ice. J Mar Sci Eng 9: 1145.

























