Role of Upper Ocean Dynamics on the Intensification and Ocean Surface Response of two Super Cyclones in the Arabian Sea
Bonumaddi Yaswanth and Kailasam Muni Krishna*
Department of Meteorology and Oceanography, India
Submission:September 05, 2022; Published:October 12, 2022
*Correspondence author: Kailasam Muni Krishna, Department of Meteorology and Oceanography, Andhra University, Visakhapatnam, India
How to cite this article: Bonumaddi Y, Kailasam Muni K. Role of Upper Ocean Dynamics on the Intensification and Ocean Surface Response of two Super Cyclones in the Arabian Sea. Oceanogr Fish Open Access J. 2022; 15(3): 555913. DOI: 10.19080/OFOAJ.2022.15.555913
Abstract
Upper ocean thermodynamic and biological responses between the two super cyclones namely Gonu (1-7 June 2007) and Kyarr (24 Oct – 02 Nov 2019) were investigated using multi-satellite datasets, and hycom model data. During Gonu, one strong cooling patch (>5.5°C) observed but in the case of Kyarr it is 3.8°C was observed along its track. The locations of these cold patches are highly correlated with the relative depth of the 26°C isotherm and mixed layer depth (MLD) and upper ocean heat content (UOHC). The enhancement of surface chlorophyll a (chl-a) concentration was detected in these cold regions as well, mainly due to the TC-induced mixing and upwelling. Moreover, the existing ocean cyclonic eddy has been found to significantly modulate the magnitude of surface cooling and chl-a increase during the Kyarr period. The possible causes of intensity change of cyclones were also explored with UOHC. Upper oceanic conditions play a noticeable role in the intensification of both super cyclones.
Keywords: Upper Ocean response; Warm core eddy; Ocean heat content; Mixed layer depth; Super cyclones
Abbreviations: MLD: Mixed Layer Depth; UOHC: Upper Ocean Heat Content; TCs: Tropical Cyclones; SST: Sea Surface Temperature; IBTrACS: International Best Track Archive for Climate Stewardship; CMEMS: Copernicus Marine and Environment Monitoring Service; MODIS: Moderate Resolution Imaging Spectroradiometer; ASCAT: Advanced Scatterometer; ESA: European Space Agency; EPV: Ekman Pumping Velocity; ELD: Ekman Layer Depth; CCE: Cold Core Eddy; SLA: Sea Level Anomalies
Introduction
Tropical cyclones (TCs) have devastating impacts on coastal communities and infrastructure. In recent decades, global average air and sea surface temperatures have been alarming, and they have increased socio-economic interest in abrupt changes in intensity and possible changes in the track of TCs [1]. Sea surface temperature (SST) in the form of thermal energy supply from the sea plays an important role in the intensity of TCs [2-6]. Air pressure and pressure drop associated with tropical cyclones produce a mixture of turbulence in the ocean, producing ocean currents and changing the ocean’s thermal structure. From a depth of 60m, the surface cools the surface temperature by 1-7°C and deepens the composite layer after tropical cyclones pass. The cooling of the sea surface continues for about a week and is observed on the right side of the cyclone track [7,8]. This cooling is mainly due to the mixing of vertical turbulence induced by strong momentum flow into the ocean currents and the introduction of cold thermocline into the upper composite layer of water. SST cooling under the cyclone significantly reduces the heat and humidity flow at the entire ocean surface, which plays an important role in cyclone evolution [9]. Previous studies revealed that, global warming is increased the number of severe cyclones (cats 4 and 5) in the Arabian Sea in May-June [10,11]. Gonu and Kyarr are Category 5 tropical cyclones, based on the Saffir-Simpson scale, which are developed in the northern Arabian Sea in June 2007 and October 2019 respectively. Gonu is an unprecedented event because cyclones of this strength have never reached the Gulf of Oman coast. The cyclone was reported to have caused some 4 billion damage and caused more than 50 deaths in Oman alone, where cyclone GONU was considered the country’s worst natural disaster in 2007. Kyarr is the second strongest super cyclone formed in the Arabian Sea after Gonu cyclone in the history (1842-2018) of the North Indian Ocean. Pre-cyclone periods of both super cyclones show high SSTs, which is favorable for cyclone formation and followed the high SST for a few days. GONU reached a maximum intensity (cat 5) on June 4, 2007, with a sustained wind speed of 145 knots (74.5 m/s) and Kyarr reached a maximum intensity (cat 5) on 27 Oct 2019 with a sustained wind speed of 134 knots (68.9 m/ s). In this study, we focused on the impact of super cyclones Gonu and Kyarr on the physical, dynamical, and biological changes in the Upper Ocean of the Arabian Sea and also investigated the possible causes of intensification of cyclones.
Data and Methods
Data
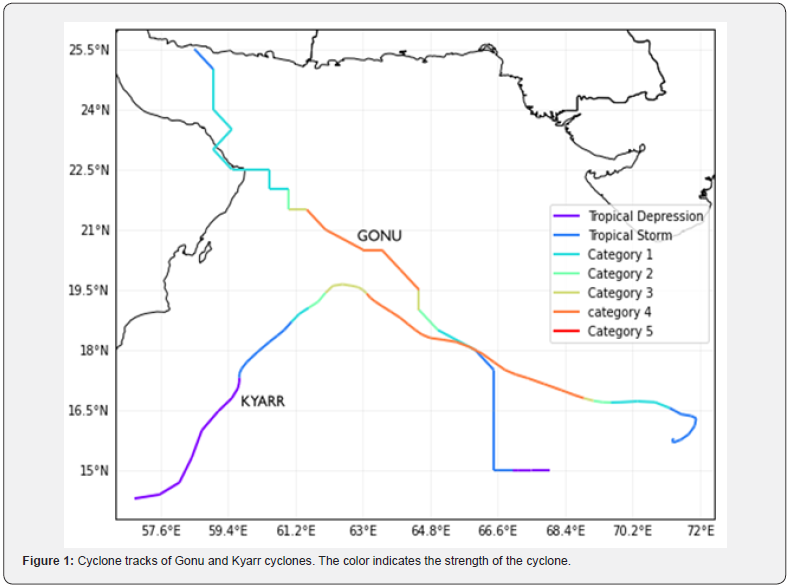
TC best track data: The information of Gonu and Kyarr cyclones, including the time (UTC), center location, the maximum sustained wind speed (MSW), and minimum sea surface pressure are obtained from the best track data of India Meteorological Department (www.imd.gov.in) and International Best Track Archive for Climate Stewardship (IBTrACS) data [12]. The cyclone tracks of the present study are shown in figure 1.
Satellite observations: Daily Microwave and Infrared Optimum interpolated SST (MW-IR-OISST) from the Remote Sensing Systems (http://www.remss.com) with a spatial resolution of 4km × 4km used to study the surface cooling contrast between the super cyclones. It combines the throughcloud capability of the microwave OI SST product [13] with the high spatial resolution of the infrared SST by using the Optimum Interpolation method [14]. Daily SLA and geostrophic current dataset, provided and distributed by the Copernicus Marine and Environment Monitoring Service (CMEMS) and Copernicus Climate Change Service (http://cds.climate.Copernicus.eu). The positive (negative) SLA is normally corresponding to mesoscale eddies with warm (cold) water in the core region [15]. Because the daily chl-a concentration dataset includes plenty of data gaps caused by severe cloud contamination, we averaged daily data to study the biological response of the upper ocean to both Gonu and Kyarr. The averaged chl-a concentration data, with a spatial resolution of 4km × 4km, derived from the Moderate Resolution Imaging Spectroradiometer (MODIS), is used before and after assess variability in ocean primary production.
The daily ocean surface winds from QuikSCAT (0.250 × 0.250) and ASCAT daily average data sets with a spatial resolution of 0.250 × 0.250 are used to calculate the Ekman pumping and Ekman Layer depth due to the cyclones. We used Quik SCAT winds for GONU (2007) and ASCAT winds for Kyarr (2019) because, as Quik SCAT stopped working on 23 November 2009, sea surface wind data are provided by the advanced scatterometer (ASCAT) in this study, which was launched by the European Space Agency (ESA) aboard the MetOp-A platform on 19 October 2006. The measurement footprint is approximately 25km. The near-realtime L2 products were interpolated to get the daily gridded data with 0.25° spatial resolution.
Ocean numerical model outputs: The daily Ocean temperature and salinity data from HYCOM + NCODA Global 1/12° GOFS3.1 41-layer Analysis (GLBv0.08 expt_92.9-expt_93.1) and HYCOM + NCODA Global 1/12° Analysis (GLBa0.08_rect) (http:// www.hycom.org/) with 9.25 km spatial resolution for the study of Gonu and Kyarr cyclones over the Arabian Sea [16,17].
Methods
In this study, SSTA is calculated by subtracting SSTs of precyclone and post-cyclone periods. MLD is defined here as the depth at which the density difference from 10 dbar is 0.125 kg/ m3 [18].
Accumulated cyclone energy is calculated by summing the squares of the estimated maximum sustained velocity of tropical cyclone divided by 10,000 to make them more manageable. One unit of ACE equals 104 knot2

The spatial distribution of Ocean Heat Content is calculated using the HYCOM output of ocean temperature profiles T(z):

Where ρ is the seawater density (1024 kg/m3); Cp is the heat capacity (4186 J/kg oC), d1, d2 are the depth range over which the heat content is computed.
The potential upwelling speed We due to TC winds is calculated using the classical Ekman pumping velocity (EPV) formula [19].
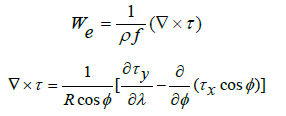
where We is the Ekman pumping velocity; ρ is seawater density (1024 kg/m3); f is Coriolis parameter; R is radius of the earth; 𝜑 and λ are the geographic latitude and longitude respectively; τx and τy are the zonal and meridional wind stress components respectively. Ekman Layer depth (ELD) is calculated using the following formula [20].

Where DE is Ekman layer depth; 𝜑 is geographical latitude; U10 is wind speed at 10m above the sea surface.
Results and Discussion
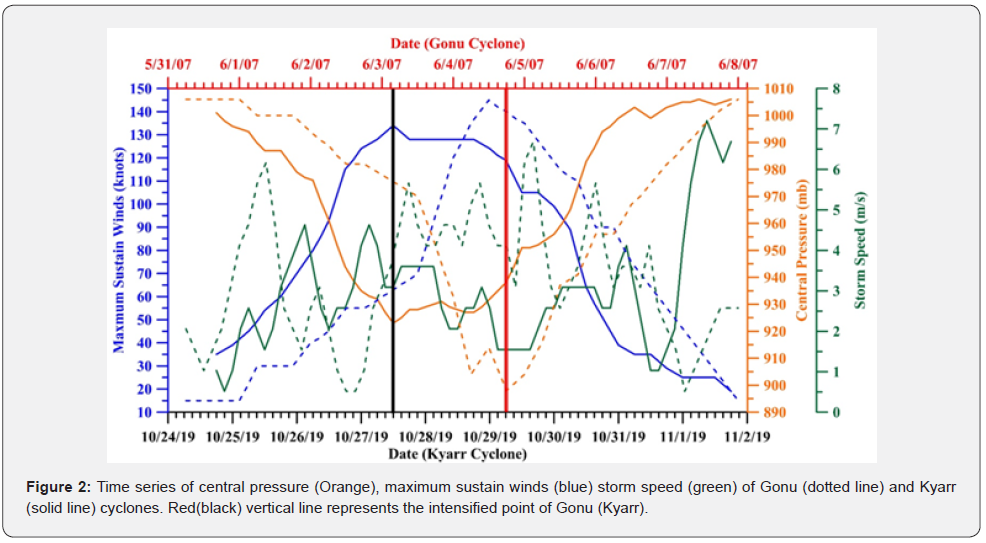
The time series of cyclone speed sustained wind speed, and a central pressure of Gonu and Kyarr are shown in figure 2. In the case of Kyarr maximum sustained winds (134 knots) are exactly coincide with minimum central pressure (923hPa) at an intensified point, but in case of Gonu there is almost 8 hours lag between maximum sustained wind speed (145 Knots) and minimum central pressure (901 hPa). The time during of maximum sustain winds (<100knots) is more in Kyarr cyclone (> 3 days) even though its minimum central pressure value is high compared with Gonu (<2 days). Gonu cyclone moves almost two times faster (1-7 m/s) than Kyarr cyclone (1-4 m/s). At the time of intensification also the speed of Gonu (~4 m/s) is double than Kyarr cyclone (~2 m/s).
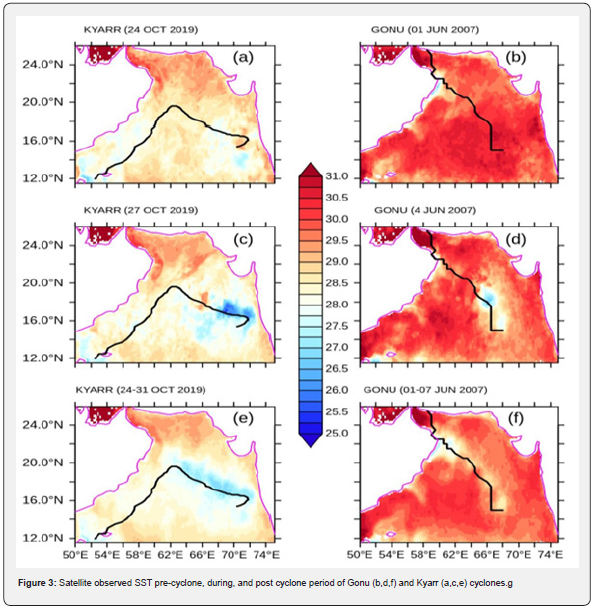
Table 1 shows the accumulated cyclone energy and duration of Gonu and Kyarr cyclone. As the duration of a cyclone increases, more values are summed and the ACE also increases such that longer-duration cyclones may accumulate a larger ACE than more powerful cyclones of lesser duration. Although ACE is a value proportional to the energy of the system, it is not a direct calculation of energy. Kyarr shows high ACE value compare with Gonu because Kyarr sustained in the Super cyclone stage in 2days, but Gonu sustained only 6-9 hrs.

Thermal response
Figure 3 depicts the SST changes in different stages of Gonu and Kyarr cyclones. During pre- Kyarr cyclone SST is 29oC (Figure 3a), whereas in case of Gonu it is more than 30oC (Figure 3b) over most of the Arabian Sea area. During Gonu, SST fell over the entire Arabian Sea, and there were two low SST patches, one (<28 oC) (Figure 3d) located in the eastern central Arabian Sea (near 67oE, 18oN); the other (<27.5oC) (Figure 3d) was more noticeable in the north-eastern Arabian Sea (near north of Oman coast) and in the case of Kyarr there is one large low SST patch (<28oC) (Figure 3c) located along the track from the eastern Arabian Sea to the northeastern Arabian Sea. The intensified period SSTs are also showing low-SST patches in both Gonu and Kyarr cyclones are presented in figure 3b.
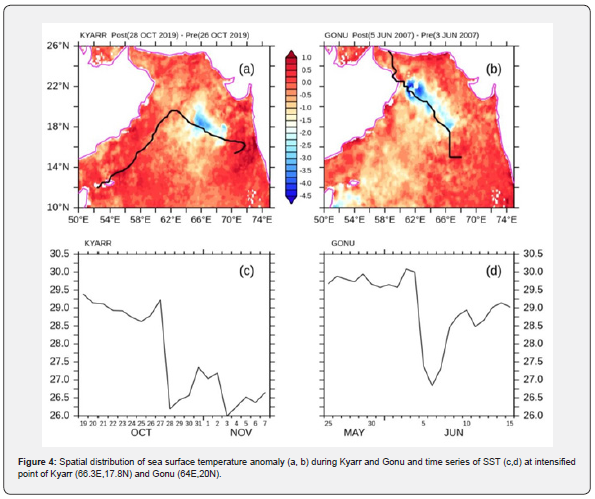
As shown in figures 3a &3b, the background marine environment on 24 October 2019 and 01 June 2007 provided favourable conditions for genesis of Gonu and Kyarr cyclones, with high SST (>29°C). During Gonu there is one sudden drop SST and one lowest SST patches (Figure 3d) compare with surroundings but in Kyarr there is only one low SST patch over a large ocean area. There is a cool trail along the tracks of both Gonu and Kyarr, with their tracks on the right bias. The maximum depreciation of the SST on the right side of the Gonu track on June 4, 2007, was > 5.5°C (Figure 4b). As the Kyarr travels, the ocean surface cools (Figure 4a) and the temperature drops to 3.5.C. Both Gonu and Kyarr are strong with high MSW 66.8 m/s and 65.3 m/s respectively. Therefore, the induced strong mixing effects were able to bring cold water from deep to the surface. Figures 4c & 4d shows the time series of SST, which helps to understand sudden cooling at the intensified point of cyclones.
Dynamical response
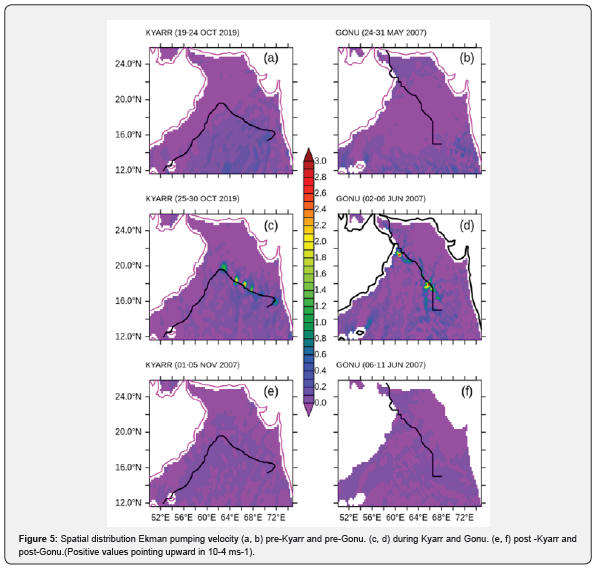
The EPVs derived from wind stress revealed the upwelling conditions pre, during, and post cyclone periods of Kyarr and Gonu (Figure 5). EPVs are low during the genesis of Kyarr cyclone when compared with Gonu cyclone. The EPV averaged for the Kyarr and Gonu period displayed strong upwelling near the cyclone track, up to 1.6 x 10⁻⁴ ms-1 and 3×10⁻⁴ ms-1 (Figures 5c & 5d) respectively. During cyclone period there are two strong points (>2 × 10⁻⁴m2/s) along the Gonu but in the case of Kyarr one strong, one moderate, and two weak patches.
In this present study, there is a sign of the investigation of Ekman layer depth (ELD) to identify the range of vertical layers of the ocean affected by the movement of wind-driven surface waters. Pre-cyclone period of both cyclones ELD is in between 100-120 m (Figures 6a & 6b) when they intensified into super cyclone the ELD is doubled (Figures 6c & 6d). Deep ELD is found along the track of Gonu whereas in Kyarr cyclone it restricted at the intensified area only. Deep ELD areas are strongly coinciding with cold patches of both cyclones.
Upper ocean dynamics on intensification
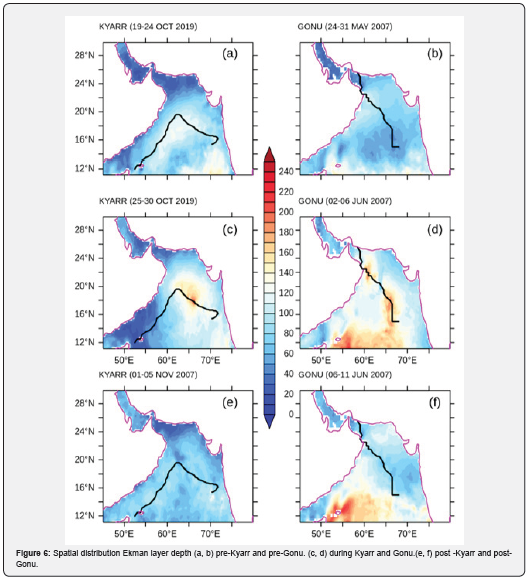
Figure 7 depicts the changes in sea level anomalies (SLA) and geostrophic current during different stages of two super cyclones. Along the Gonu cyclone track we observed two strong warm core eddies and one cold core eddy and also the SLA is more than 0.2 m along the track except near Oman coast where cold core eddy (-0.15m) is observed (Figures 7b, 7d & 7f). When the cyclone crossed the WCE it intensified from Category 4 to 5 because of large amount energy boost from the core of the eddy. Gonu appears to be weakened into category 5 to category 2 as it encounters the CCE. The intensity reduction attains a maximum shortly after Gonu passes over the CCE center and simultaneously the CCE induced asymmetry of the storm structure is most significant as well, similar mechanism is also observed during Opal hurricane in the Pacific Ocean [21]. Gonu cyclone crossed the Oman coast and again enter in the Gulf of Oman waters attains energy from another warm core eddy existed in that area and maintain category 2 stage with maximum sustain wind speed (77knots). The above results indicate that warm core eddies play a vital role on rapid intensification of Gonu cyclone.

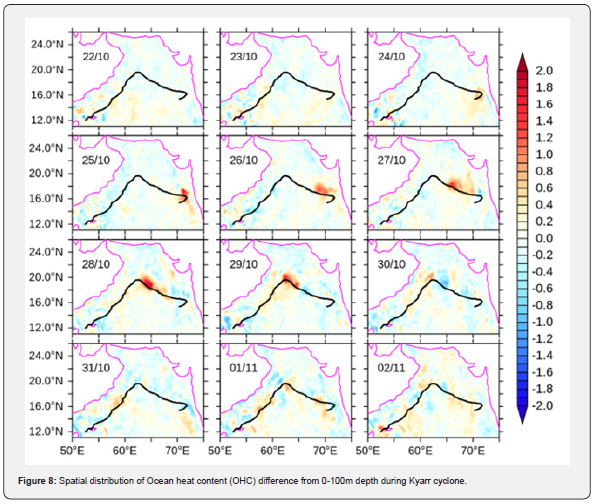
The surface circulation and SLA changes during Kyarr cyclone are quit opposite to Gonu cyclone. Along the Kyarr cyclone track we observed four strong CCEs. Even though it passed through CCEs, it intensified to Category 5 stage because of the energy input from the top ocean layer (0-100m) in the form of ocean heat content. The role of OHC in the intensification of Kyarr cyclone was discussed below.
To understand the effect of OHC on cyclone intensity changes, we took OHC change (OHCA) [22].
OHCA = OHC (pre)-OHC (post)
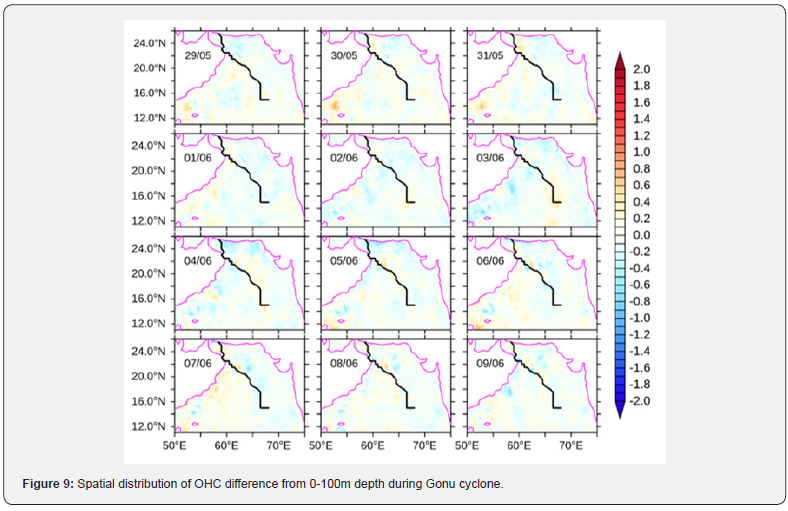
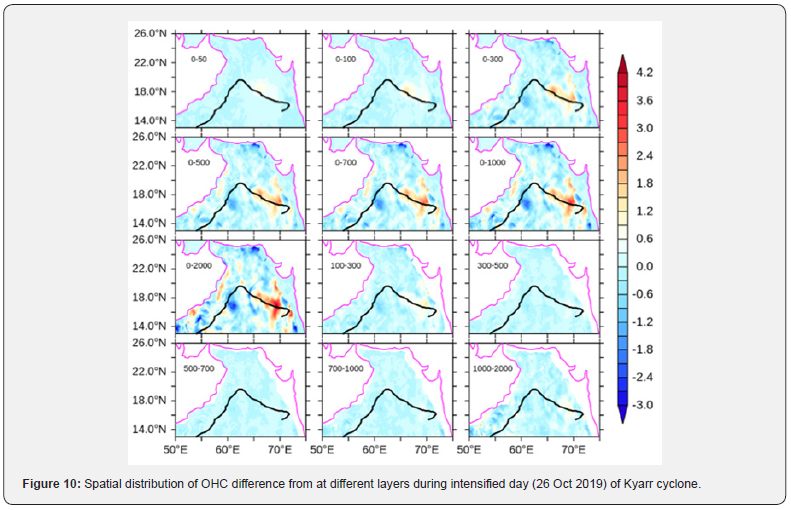
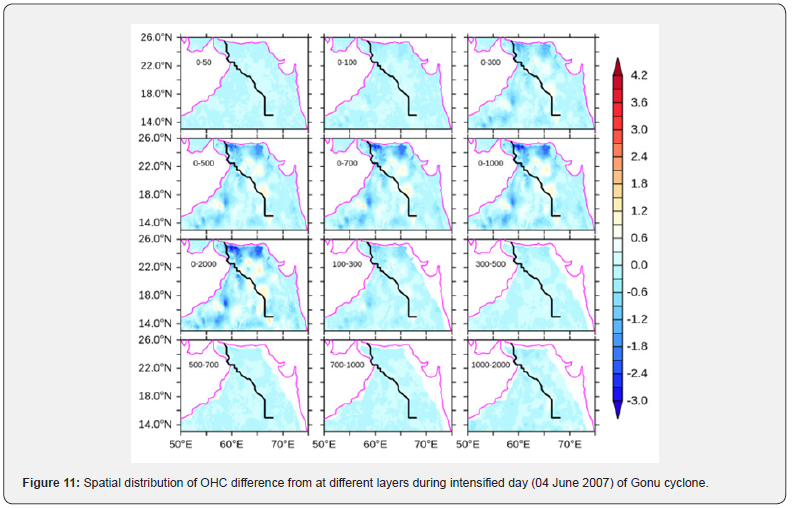
Figures 8 & 9 illustrates the OHC anomaly (OHCA) of the upper ocean (0-100m) during Kyarr and Gonu cyclone. Strong positive OHCA observed along the Kyarr cyclone and they are gradually increasing from 24 October 2019 to 01 November 2019 and also equated with different stage of Kyarr Cyclone. We observed a very strong positive OHCA during 27 and 28 Oct 2019 nearly 2 × 10⁹ J/ m2 which coincide with the rapid intensification of Kyarr cyclone. Further we extended similar analysis at different layers (Figures 10 & 11) of the ocean on intensification day of each cyclone, positive/negative OHCA observed during Kyarr/Gonu cyclone at all levels. OHCA at the intensification point of two super cyclones also indicated strong positive anomaly during Kyarr cyclone compared with Gonu (Table 2). From the table 2 the top layer of the ocean (0-100) shows strong positive OHCA observed during Kyarr and it nearly 1x10⁹ J/m2 compared with Gonu.
From figures 10 & 11 we observed that upper 0-300m OHC place an important role in cyclone intensification. The above finding reveals that WCEs or high upper OHC are associated with TC intensification, and CCEs or low upper OHC are observed to reduce their intensities. Intensification of Gonu is caused by the presence of WCE but in the case of Kyarr, intensification it is due to high upper Ocean Heat Content.

Biological response
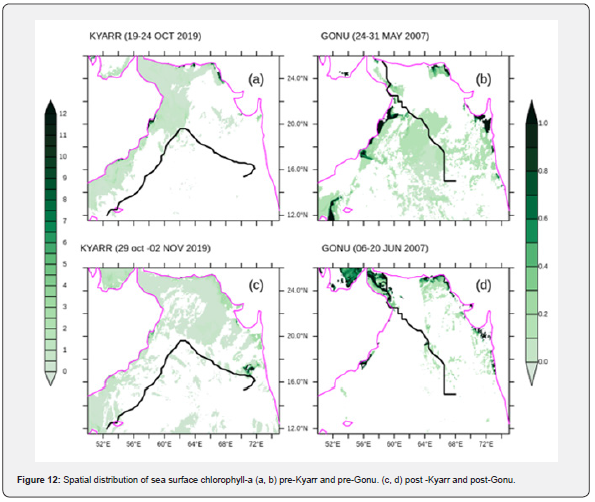
Figure 12 illustrates the transient evolution of surface chl-a concentration before and after the passages of two super cyclones. Pre-Gonu Chl-a showed a typical summer oligotrophic condition, with low Chl-a, mainly (<0.2 mg m-3). In post Gonu, most of the Chl-a in the Arabian Sea was high, especially in the two highest Chl-a patches are on the track (> 0.85 mg m-3) and northeast part of Oman coast (> 1 mg m-3). Due to the high cloud cover, we did not get values in the intensified area during the cyclone period. Similarly, Kyarr cyclone, high chl-a (12 mg m-3) observed during post-cyclone periods, which is also coinciding with the cold patch area but pre cyclone chl-a data is not available. With cold core eddy (CCE) along the Kyarr track, chl-a appeared to be much higher (12 mg m-3). Due to the unique thermodynamic structure of CCE, it is more likely to bring surface water with rich nutrients inside the eddy into the euphotic zone by TC-enhanced vertical mixing. Therefore, the existing CCE not only modulates the thermodynamic response of the upper ocean but also causes changes in biological processes. It can be observed that both Gonu and Kyarr caused strong growth with an EPV greater than 1.5 × 10⁴ ms-4, which was able to transport subcutaneous nutrients upward to the euphotic zone. Compared to the Gonu period, the biological response in terms of high chl-a concentration during Kyarr, possibly related to CCE-cyclone interaction.
Conclusion
Accurate track and intensity assessment of cyclones is a problem that has been challenging cyclone surge and risk management for decades. However, there have been significant improvements in cyclone track forecasts recently, but the severity forecast is still lacking for rapid, unexpected cyclones. These unexpected unforeseen events are catastrophic before a landslide in the world’s most populous and cyclone surge areas. The presence of eddies on or near cyclone tracks (which can be easily deduced from satellite altimetric SLA data sets) can play a key role in predicting sudden cyclone severity changes.
The combination of satellite data, numerical model products, and situ observations provides a unique opportunity to study the impact of Tropical Cyclones (TC) on changes in the upper ocean. In this paper, multi-platform datasets were used to research the thermodynamic and biological responses of the upper ocean to two super cyclones (Cat 5) formed in the Arabian Sea, namely Gonu (2007) and Kyarr (2019). After crossing the two TCs, the SST decreased significantly due to strong sea intrusion and surge. Two distinct cold patches were observed along the Gonu track and a large area of cold patch was observed along the Kyarr track. The magnitude and extent of sea surface cooling are related not only to the intensity and translational speed of TC but also to the local ocean conditions. Areas with particularly pronounced chl-a expansion are similar to surface cooling areas. In the case of the Gonu, warm- core eddy plays an important role in modulating the thermodynamic and biological responses of the upper ocean due to its unique and relatively unstable thermodynamic structure. On the other hand, it significantly affected the intensity of the TC and the wind speed increased abruptly after crossing the warm core eddy. In the case of Kyarr, the upper OHC plays a vital role in modulating the thermodynamic and biological responses of the upper ocean. Under different oceanic background conditions, the upper ocean responses to TCs may be different, with TC-induced vertical mixing being the main factor influencing upper ocean conditions. Therefore, the main results of this study such as sea surface cooling, chlorophyll improvement, and EPV, ELD, and OHC, one of the most important behaviour of upper ocean reactions to TCs.
Acknowledgments
We thank Director India Meteorological Department, Remote Sensing System, AVISO and IBTracks team for providing cyclone track data, satellite data products used in this study.
References
- Marks FD, Shay LK, Barnes G, Black P, Demaria M, et al. (1998) Landfalling tropical cyclones: forecasting problems and associated research opportunities. Bull Am Meteorol Soc 79(2): 305-323.
- Fisher EL (1958) Cyclone and the sea surface temperature field. J Meteorol 15: 328-333.
- Tisdale CF, Clapp PF (1963) Origin and paths of cyclones and tropical cyclones related to certain physical parameters at the air-sea interface. J Appl Meteorol 2(3): 358-367.
- Perlroth I (1967) Cyclone behavior as related to oceanographic environment conditions. Tellus 19: 258-267.
- Brand S (1971) The effects on tropical cyclones of cooler surface waters due to upwelling and mixing produced by a prior tropical cyclone. J Appl Meteorol 10(5): 865-874.
- Chang SW, Anthes RA (1979) The mutual response of tropical cyclones and the ocean. J Phys Oceanogr 9(1): 128-135.
- Price JF, Sanford T, Forristall G (1996) Forced stage response to a moving cyclone. J Phy Oceanogr 24(2): 233-260.
- Jacob SD, Shay LK, Mariano AJ, Black PG (2000) The 3D Oceanic Mixed Layer Response to Hurricane Gilbert. J Phys Oceanogr 30(6): 1407-1429.
- Bender MA, Ginis I (2000) Real-case simulations of hurricane–ocean interaction using a high resolution coupled model: effects on hurricane intensity. Mon Weather Rev 128(4): 917- 946.
- Muni KK (2009) Intensifying tropical cyclones over the North Indian Ocean during summer monsoon - global warming. Global Planet Change 65(1-2): 12-16.
- Evan AT, Kossin JP, Chul EC, Ramanathan V (2011) Arabian Sea tropical cyclones intensified by emissions of black carbon and other aerosols. Nature 479: 94-97.
- Knapp KR, Kruk MC, Levinson DH, Diamond HJ, Neumann CJ (2010) The International Best Track Archive for Climate Stewardship (IBTrACS): Unifying tropical cyclone best track data. Bulletin of the American Meteorological Society 91(3): 363-376.
- Gentemann CL (2004) Near real time global optimum interpolated microwave SSTs: Applications to cyclone intensity forecasting. In Proceedings of the 26th Conference on Cyclones and Tropical Meteorology, Miami, FL, USA.
- Reynolds RW, Smith TM (1994) Improved global sea surface temperature analyses using optimum interpolation. J Clim 7(6): 929-948.
- Ning J, Xu Q, Zhang H, Wang T, Fan K (2019) Impact of cyclonic ocean eddies on upper ocean thermodynamic response to Typhoon Soudelor. Remote Sens 11: 938.
- Chassignet EP, Hurlburt HE, Smedstad OM, Halliwell GR, Hogan PJ, et al. (2007) The HYCOM (HYbrid Coordinate Ocean Model) data assimilative system. J Mar Syst 65(1-4): 60-83.
- Akhila RS, Kuttippurath J, Rahul R, Chakraborty A (2022) Genesis and simultaneous occurrences of the super cyclone Kyarr and extremely severe cyclone Maha in the Arabian Sea in October 2019. Nat Hazards 113: 1133-1150.
- Kara AB, Rochford PA, Hurlburt HE (2003) Mixed layer depth variability over the global ocean. J Geophys Res 108(C3), 3079.
- Enriquez AG, Friehe CA (1995) Effects of Wind Stress and Wind Stress Curl Variability on Coastal Upwelling. Journal of Physical Oceanography 25(7): 1651-1671.
- Stewart RH (2006) Response of the upper ocean to winds. In: Stewart RH (Edt.), Introduction to Physical Oceanography. Dep of Oceanography. Texas & M University, College, USA pp. 152.
- Ma Z, Fei J, Liu L, Huang X, Cheng X (2013) Effects of the Cold Core Eddy on Tropical Cyclone Intensity and Structure under Idealized Air–Sea Interaction Conditions. Mon Wea Rev 141(4): 1285-1303.
- Vissa NK, Satyanarayana ANV, Prasad KB (2013) Intensity of tropical cyclones during pre-and post-monsoon seasons in relation to accumulated tropical cyclone heat potential over Bay of Bengal. Nat Haz 68: 351-371.


