Seasonal Fluctuations of Synechococcus spp. Abundance, Photo-assimilation, Growth Rate and Fluorescence Properties at the Individual Cell Level in the Sargasso Sea
Rodolfo Iturriaga1*, John F Marra2 and Robert R Bidigare3
1Marine and Environmental Biology, Department of Biological Sciences, University of Southern California, USA
2Brooklyn College, The City University of New York, USA
3Hawaii Institute of Marine Biology, University of Hawaii, USA
Submission:April 30, 2022; Published:May 20, 2022
*Correspondence author: Rodolfo Iturriaga, Department of Biological Sciences, University of Southern California, USA
How to cite this article: Rodolfo I, John F M, Robert R B. Seasonal Fluctuations of Synechococcus spp. Abundance, Photo-assimilation, Growth Rate and Fluorescence Properties at the Individual Cell Level in the Sargasso Sea. Oceanogr Fish Open Access J. 2022; 14(5): 555900. DOI: 10.19080/OFOAJ.2022.14.555900
Abstract
A seasonal study of Synechococcus spp. abundance, photo-assimilation, growth rate, and fluorescence properties were performed at the individual cell level during the BIOWATT-II Project in the Sargasso Sea. Investigations were carried out during four cruises in different seasons in 1987. Synechococcus spp., cell abundance, carbon photo-assimilation, growth rate, and fluorescence emission were higher in the upper 80 m during most of the seasonal periods observed with the exception of the summer cruise. A similar trend followed the nitrogenous nutrient (nitrite plus nitrate) concentrations and chlorophyll fluorescence patterns. Strong vertical mixing events are common during the spring, followed by an increase in solar irradiance, the development of a thermocline at 30-40m, and a drop in the nitrogenous nutrient concentrations in the upper 120m. These conditions intensified toward the summer when a nutrient depleted mixed layer occurred above a well-defined thermocline near 40m. Synechococcus spp. cell abundance, carbon photo-assimilation, growth rate and fluorescence intensity all declined over the summer months. During periods of higher solar irradiances and depleted nitrogenous nutrient concentrations, the fluorescence emission intensity was lower in cells collected from the upper 60-80 m of the water column. By comparison, higher fluorescence values were displayed by cells collected from the same cast at depths of 100-160 m. where nitrogen nutrient concentrations were detectable, but light limited growth rate. The fluorescence excitation spectra of Synechococcus spp. cells sampled at all depths and seasons, showed higher ratios of phycourobilin (PUB) to phycoerythrobilin (PEB) comparable to Synechococcus clone WH-8103. Synechococcus spp. population abundance, growth rate, and fluorescence intensity appeared to follow the seasonal trend of nitrogenous nutrient availability determined primarily by vertical mixing events.
Keywords: Synechococcus spp.; Abundance; Photo-assimilation; Growth Rates; Fluorescence; Individual cells study
Abbreviations: PUB: Phycourobilin; PEB: Phycoerythrobilin; CPS: Counts per seconds; PAR: photosynthetic available radiation
Introduction
One of the main objectives of the BIOWATT-II project was to investigate the seasonal changes on the physical forcing that set-in motion the bio-optical processes in the northern Sargasso Sea. The winter cooling and storms drive deep vertical mixing as well as nutrient replenishment. A phytoplankton bloom typically follows the re-stratification of the upper water column [1,2]. Synechococcus spp. have been found to occur abundantly and widely distributed in the ocean and its photosynthetic properties, growth rate, trophic fate and relevance in marine ecosystems have been described in the literature [3-18]. Several methods have been explored to determine Synechococcus spp. growth rates. Using techniques independent of grazing effects, such as the frequency of dividing cells, Campbell and Carpenter [8] reported growth rates between 0.42 and 0.86 d-1 in oceanic waters and 0.73 d-1 during February in the Sargasso Sea. Growth rates between 0.5 and 1.2d-1 determined by epifluorescence nuclear-track micro autoradiography were reported by Iturriaga and Marra [11] during a transect along the 700W between 320N and 260N in the North Atlantic and the Sargasso Sea. Other techniques, such as size-fractionation, dilution rates and eukaryotic cell inhibitors (to minimize grazing effects) have been used to determine picoplankton growth rates in the Sargasso Sea and other oligotrophic ocean regions [13,19,20-22].
Field and laboratory data have suggested that picoplankton photosynthesis, including coccoid cyanobacteria, saturate at low irradiance (Morris and Glover, 1981) [5,9]. However, observations with cultured Synechococcus clone WH-7803, indicated that photosynthetic activity was possible at high irradiance levels [23]. In a field study in the Sargasso Sea, Prézelin et al. [24], reported that the PE content of the Synechococcus populations increased with decreasing light and, or increasing nitrogen nutrient availability as their capability to harvest photons throughout a large portion of the photic zone with a maximal contribution near its base [14,20,24]. Other methodologies have used the fluorescence properties of Synechococcus spp. to estimate their concentrations, pigment composition, and photoadaptive state. Synechococcus have also been studied at the individual cell level by microphotometry (Campbell and Iturriaga, 1980), optical tweezers [25], and flow cytometry [12,26]. Fluorescence excitation spectra from microphotometry-enabled the fingerprinting of the phycobilliprotein chromophores of individual Synechococcus spp. cells from field samples with high precision, accuracy and spectral resolution. During the BIOWATT-II investigation, individual action spectra facilitated the sorting of the prevalent Synechococcus spp. cell type by their PUB:PEB ratios, as well as to determine the fluorescence emission intensity at the excitation maxima of these two chromophores on single cells from the surface to a depth of 160 m. Despite the abundant information on Synechococcus spp. in ocean waters, most of the observations have been conducted either on bulk populations and during sporadic spatial and temporal sampling. In this study, we examined seasonal fluctuations in Synechococcus spp. abundance, photo-assimilation, growth rate, and fluorescence properties at the same geographical site in the northern Sargasso Sea.
Methods
Water sampling and incubations were performed in the northwestern Atlantic Ocean at 720W, 340N during a series of four cruises: OCE-1 (March 4-8, 1987), OCE-2 (May 17-21, 1987), OCE- 3 (August 22-25, 1987), and OCE-4 (November 30-December 02, 1987) aboard the R/V Oceanus. Water samples were collected in the upper 300m with a rosette sampler equipped with a CTD, Go-Flo bottles, and bio-optical instrumentation. Coccoid cyanobacteria cell abundances were determined via direct cell counting using a Zeiss epifluorescence microscope as described by Watson et al. (1977) and Hobbie et al. [27]. Nitrogenous nutrient concentrations (NO-2 and NO-3) were determined using standard autoanalyzer methodology. Dawn-to-Dusk carbon fixation rates in the euphotic zone were measured in situ using the C14 technique. Water collection and sample preparation followed the trace-metal clean procedures described by Fitzwater et al. [28]. Synechococcus spp. carbon fixation and growth rates in individual cells were determined by epifluorescence nuclear-track autoradiography as described by Iturriaga & Marra [11].
The spectral fluorescence properties of Synechococcus spp. were determined on individual cells using a Zeiss Microphotometer system. A detailed description of this methodology is described in Campbell and Iturriaga [29] & Iturriaga and Bower [30]. An average of ten random individual excitation spectra from cells collected at each depth was utilized to determine the intensity of the fluorescence emission of the phycobiliproteins chromophores, as a function of the 490nm and 543nm excitation wavelengths respectively. These two wavelengths represent the maximal absorption of PUB centered at 490nm and PEB at 543nm. PUB does not fluoresce, but transfers excitation energy to PEB that fluoresces at 575nm. The excitation spectra were scanned continuously from 400nm to 600nm. The emission intensity of these two wavelengths was measured at 575nm and the outputs of the 490nm and 575nm excitation wavelengths were processed independently to calculate the PUB:PEB ratios. The microphotometer system is equipped with excitation and emission monochromators of high precision and spectral resolution. The fluorescence intensity of each action spectra was recorded continuously at a resolution of 1nm by the microscope photomultiplier and registered as counts per seconds (CPS) on a computer. The precision, spectral resolution and sensitivity of the system is comparable to a research benchtop spectral fluorometer.
Results and Discussion
Environmental Conditions
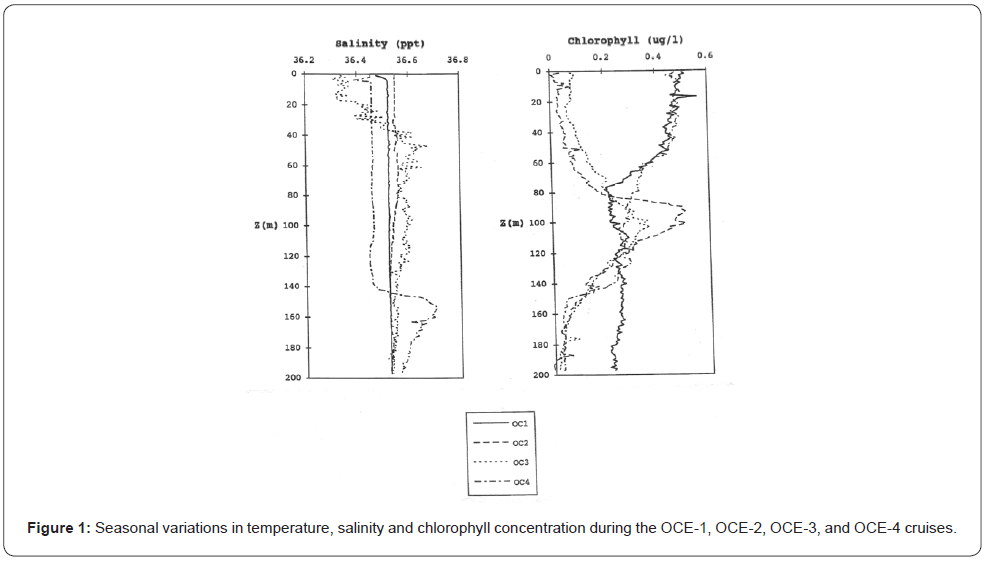
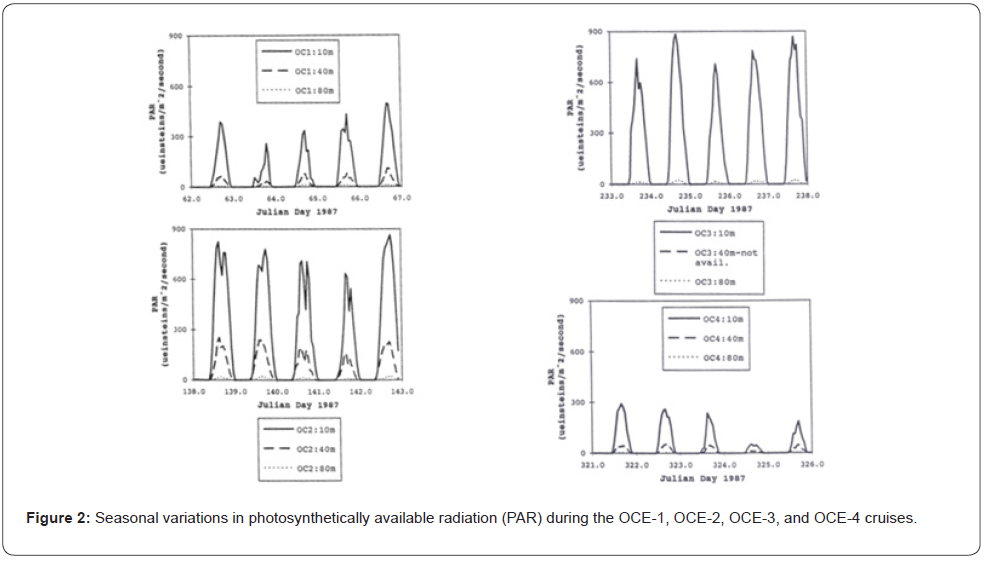
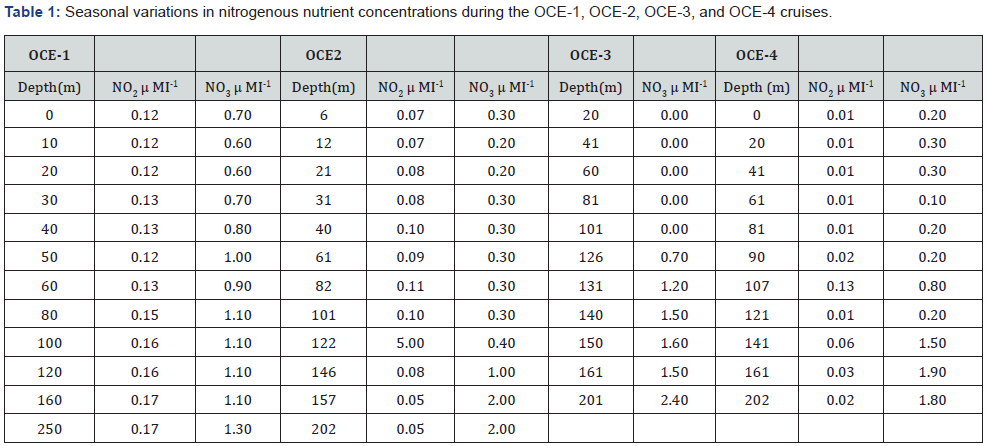
During the OCE-1 cruise in early March, surface water temperatures (20oC) were the lowest observed for the four cruises and no significant mixed layer was apparent in the upper 160m. The photosynthetic available radiation (PAR) levels of 1%, due to cloudiness, fluctuated between 80 and 100m, higher chlorophyll fluorescence values remained in the photic zone decreasing below 50m. Previous to the OCE-2 cruise in mid-May, an increase in solar irradiance, coupled to a rise of the upper surface water temperature initiated the formation of a mixed layer above 30- 40m depth, chlorophyll fluorescence decreased in the surface waters, as well as the nitrogen concentrations. The chlorophyll fluorescence maximum appeared between 90-105m, a depth where nitrogenous nutrients were more abundant and PAR was a growth rate limiting factor. By the time of the OCE-3 cruise in mid-August, the solar irradiance continued to warm the surface waters, reaching temperatures up to 27oC. A nitrogen depleted mixed layer set above a well-defined thermocline near 40m and a chlorophyll fluorescence maximum set at approximately 100m depth. During the OCE-4 cruise in early December, solar irradiance and PAR levels were the lowest observed in all cruises and nearly half of the values of those observed during OCE-1. An intermediate deep mixed layer located close to 150m with nitrogen replenished surface waters, temperatures reached 23oC and, chlorophyll fluorescence values followed a pattern similar to those observed during OCE-1.
The seasonal fluctuations of solar radiation and atmospheric forcing’s upon the upper ocean were the main criteria used to determine the BIOWATT-II study site [1,31]. The north Atlantic region corresponding to the BIOWATT-II study site is characterized by deep convective winter mixing that supplies nutrients to the surface waters. During the spring, the increase of solar irradiance and surface waters temperature induces stability to the water column, resulting in the annual spring phytoplankton bloom with the typical spring phytoplankton blooms, followed by a nutrient depleted well defined mixed layer and thermocline above 40m depth during the summer (Figures 1-2) (Table 1).
Synechococcus spp. cell abundance
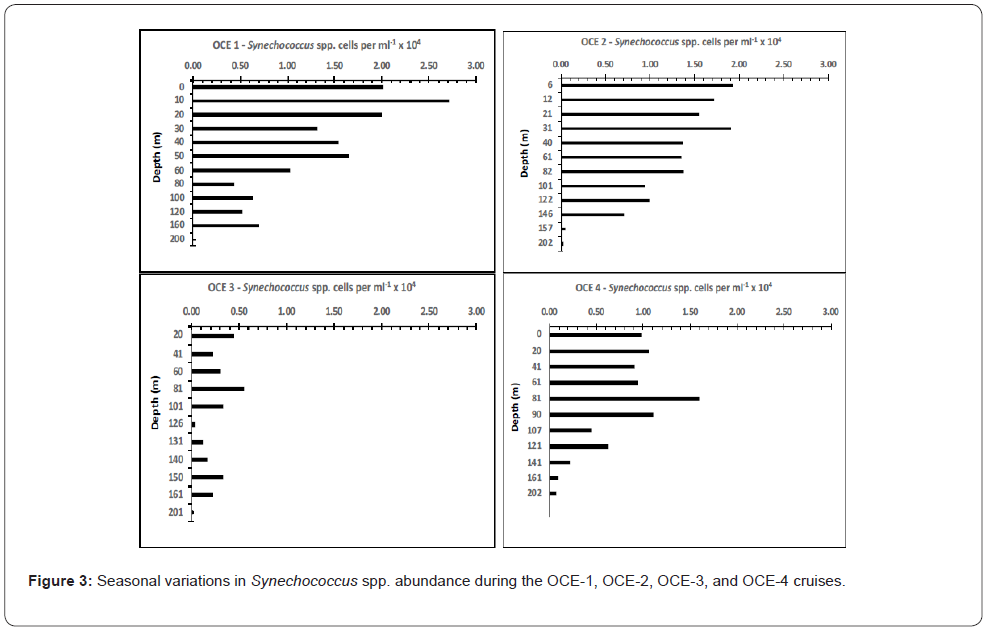
The abundance of Synechococcus spp. ranges between approximately 103 to 105 cells mL-1 in oligotrophic and mesotrophic regions of the ocean. In stratified waters maximal numbers have been observed in the upper 100m depending on region and season. Coccoid cyanobacteria show a distinct seasonality in some temperate regions in the world’s ocean (Waterbury et al., 1987) [2,4,7,13,14,32]. During the BIOWATT-II investigations, higher cell concentrations were observed during OCE-1, OCE-2 and OCE- 4 in the upper 60-80m with values ranging from 1.0 to 2.7 x 10⁴ cells mL-1. Synechococcus abundances ranged from 1.0 to 0.4x10⁴ cells mL-1 at depths of 80m to 160m (Figure 3). During OCE-3 (summer) Synechococcus abundances dropped to approximately half that observed during the other seasons.
Seasonal carbon photo-assimilation and growth rate
Traditionally, the photosynthetic rates of Synechococcus spp. have been determined for the “picoplankton” fraction (<3 microns) via size fractionation analysis, this size fraction accounts for approximately 60% of the total primary production in oligotrophic waters with high specific growth rates [6,10,19,20,24,33]. However, specific growth rates of coccoid cyanobacteria and their contribution to the total primary production may be lower than previously thought, because the picoplankton fraction may contain variable amounts of other photoautotrophs, including Prochlorococcus spp. [8,11].
The environmental factors affecting the photo-assimilation rates within the picoplankton include spectral downwelling irradiance. Field and laboratory data have demonstrated that the picoplankton fraction, including coccoid cyanobacteria, efficiently utilize the blue to green regions of the visible light spectrum [14]. Based on individual cells in situ carbon-specific photo-assimilation and growth rates of Synechococcus spp. in the Sargasso Sea, Iturriaga and Marra [11] reported carbon fixation rates between 3.4 and 11.8 fgCcell-1h-1, with specific growth rates ranging between 0.5 to 1.2 d-1, with contributions to the total primary production ranging from 60% to 95%. The highest growth rates were observed in the upper 20m of the water column. During the OCE-1 and OCE-4 cruises, the highest carbon photo-assimilation and growth rates were observed in the upper 30-40m. These two sampling periods corresponded to the seasons when the deepening of the mixed layer was also associated with ventilation of nutrient-rich deep water (18oC isotherm) [2]. These two seasonal periods contrasted to the conditions observed during the spring (OCE-2) and summer (OCE-3), that were characterized by higher irradiances, higher water temperatures, water column stratification, and lower nitrogenous nutrient concentrations. During OCE-3, photo-assimilation and growth rates of cells located between 60 and 80 m were nearly double the rates of cells in the upper 40m (Figure 4).
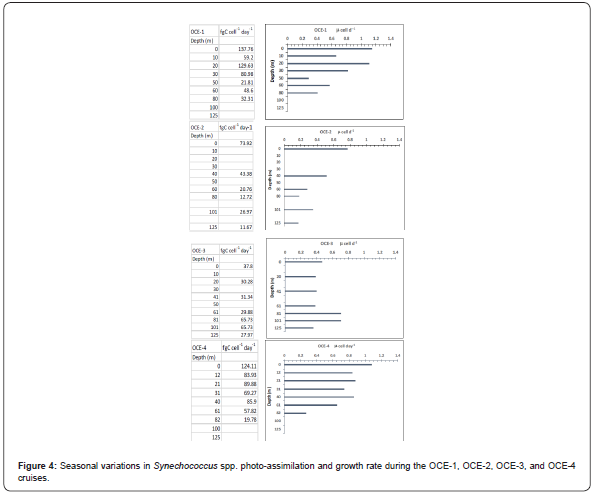
The lower growth rates observed in nutrient-depleted surface waters during OCE-3, suggests that Synechococcus spp. cells have the capacity to contribute to carbon photo-assimilation processes at extremely low nitrogen concentration levels in the oligotrophic ocean. Utilizing a highly sensitive nitrite plus nitrate measurement technique [15], indicated that Synechococcus spp. have an affinity to extremely low nitrogenous nutrient concentrations and are able to utilize this resource at the nM concentration range. While the nitrate concentrations in the upper 40m were below the limit of detection, the Synechococcus cells were still capable of carrying out photo-assimilation processes as suggested by Glover’s (1988) findings.
Seasonal fluorescence properties of Synechococcus spp.
Fluorescence excitation is a powerful technique that is commonly used to determine chromophore identities and their cellular concentrations. This technique has found wide applications in chemical and biological studies [34,35]. During this investigation several hundred fluorescence excitation spectra were collected on individual Synechococcus spp. cells sampled from the upper 160m. Each one of the Synechococcus spp. spectra analyzed displayed higher PUB:PEB ratios, a distinctive characteristic of the Synechococcus WH8103 clone. Similar PUB:PEB ratios have been reported on individual cells sampled from the Sargasso Sea by microphotometry [29] and dual beam flow cytometry [12] (Figure 5).
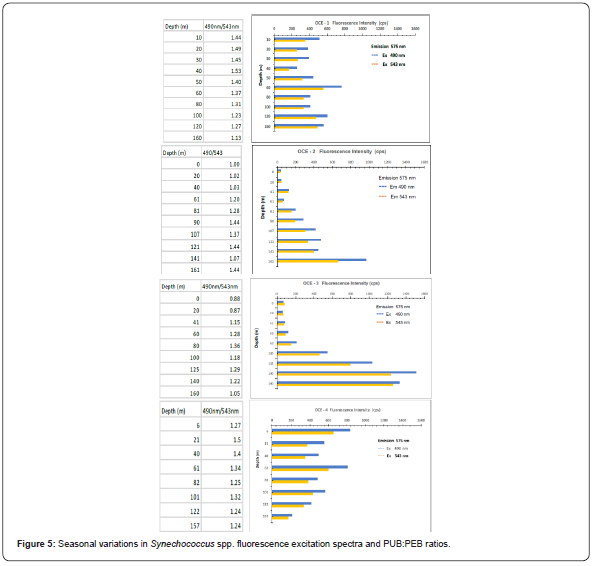
During OCE-1 and OCE-4, the fluorescence intensity output and the PUB:PEB ratios displayed smaller variations from surface to depth than those observed during the OCE-2 and OCE-3. The seasons corresponding to the (spring and summer cruises) were characterized by higher irradiances as well as depleted nitrogenous nutrient concentrations in the upper water column. The lower fluorescence output and PUB:PEB ratios observed for cells collected in the upper 40m during OCE-3, as compared to the higher fluorescence output of cells collected from 100-160m during the same cast could be interpreted as a photo-adaptive response to higher irradiance levels at the surface and lower at depth. However, the lower fluorescence intensity output and lower PUB:PEB ratios observed for cells in the upper 100m during the spring (OCE2) and summer (OCE-3) could also be attributed to photoadaptation to higher irradiances and/or a reduction in cellular pigments caused by cell nutrient starvation. In a study conducted in the Sargasso Sea, Prézelin et al. [24] reported that the PE content of Synechococcus populations increased with decreasing light and/or increasing nitrogen availability. Using a technique capable of measuring nitrite plus nitrate at nM levels Glover et al. [18,24] reported a relationship between nitrogenous nutrient concentration, fluorescence response, and photo assimilation of Synechococcus at very low levels. Studies performed with Synechococcus cultures and natural populations suggest that changes in phycobiliprotein pigments are a consequence of photoadaptation (Palenik, 2001) [12,24,29,36]. The capacity of Synechococcus to utilize some of their phycobilliprotein pigments as a nitrogen reserve has also been debated [37,38]. This is an interesting aspect to be considered, however it was beyond the scope of this investigation.
Summary
In the Sargasso Sea, high wind stress regimes are common events during the late fall and winter seasons in the geographical area of the BIOWATT-II study site. These events deepen the mixed layer to approximately 200m depth providing nitrogenous nutrients to the photic zone. During OCE-1 (early March) and OCE-4 (late November early December) cruises, higher nitrogenous nutrient concentrations were found throughout the water column. By comparison, lower concentrations observed in the upper water column during OCE-2 (mid May) and OCE-3 (mid- August). In general, higher Synechococcus spp. abundances, photoassimilation, growth rates and fluorescence yields were observed in samples collected from the upper 80-90m when nitrogenous nutrient concentrations were detectable. During the spring and summer periods, both characterized by higher solar irradiance and lower nutrient levels, Synechococcus spp. abundances, photoassimilation, growth rates and fluorescence yields declined in the upper ocean. These observations suggest that the Synechococcus spp. abundances appeared to be regulated by nitrogenous nutrient availability rather than by temperature or solar irradiance.
Despite the abundant information regarding Synechococcus spp. in oceanic waters, most of the data has been collected on bulk populations. The observations performed during BIOWATT-II were conducted at the cellular level and expand the knowledge of Synechococcus spp. population abundances, photo-assimilation, growth rates and fluorescence yields in the oligotrophic ocean.
Acknowledgement
This research was supported by ONR grants N00014- 86-K-0383, and ONR N0014- 86-K0204. In Memory of Barbara Bertsen Prézelin.
References
- Dickey T, Marra J, Granata T, Langdon C, Hamilton M, et al. (1991) Concurrent high-resolution bio-optical and physical time series observations in the Sargasso Sea during the spring of 1987. Jour Geophys Res 96 (C5): 8643-8663.
- Siegel D, Iturriaga R, Bidigare RR, Smih RC, Pak H, et al. (1990) Meridional variations of the springtime phytoplankton community in the Sargasso Sea. Jour Mar Res 48: 379-412.
- Waterbury JB, Watson SW, Guillard RRL, Brand LE (1979) Widespread occurrence of a unicellular marine planktonic cyanobacterium. Nature, London 277(5694): 293-294.
- Johnson PW, Sieburth JMcN (1979) Chroococcoid cyanobacteria in the sea: ubiquitous and diverse phototrophic biomass. Limnol Oceanogr 24(5): 928-935.
- Li WKW, Subba Rao DV, Harrison WG, Smith JC, Cullen JJ, et al. (1983) Autotrophic picoplankton in the tropical ocean. Science 219(4582): 292-295.
- Platt T, Subba Rao DW, Irwin B (1983) Photosynthesis of picoplankton in the oligotrophic ocean. Nature Lond 301: 702(5902): 702-704.
- Murphy LS, Haugen EM (1985) The distribution and abundance of phototrophic ultraplankton in the North Atlantic. Limnol Oceanogr 30(1): 47-58.
- Campbell L, Carpenter EJ (1986) Diel patterns of cell division in marine Synechococcus spp. (Cyanobacteria): use of the frequency of dividing cells technique to measure growth rates. Marine Ecol Prog Ser 32: 139-148.
- Platt T, Li WKW (1986) Photosynthetic picoplankton. Ca Bull Fish Aquat Sci 214: 583.
- Iturriaga R, Mitchell BG (1986) Chroococcoid cyanobacteria: a significant component in the food web dynamics of the ocean. Mar Ecol Progr Ser 28: 291-297.
- Iturriaga R, Marra J (1988) Temporal and spatial variability of Chroococcoid cyanobacteria Synechococcus spp. specific growth rates and their contribution to primary production in the Sargasso Sea. Mar Ecol Progr Ser 44(2): 175-181.
- Olson RJ, Chisholm SW, Zettler EV, Ambrust EV (1990) Pigments, size and distribution of Synechococcus in the North Atlantic and Pacific oceans. Limnol Oceanogr 35(1): 48-58.
- Prézelin BB, Putt M, Glover HE (1986) Diurnal patterns in photosynthetic capacity and depth-dependent photosynthesis-irradiance relationships in Synechococcus spp. and larger phytoplankton in three water masses in the Northwest Atlantic Ocean. Mar Biol 91: 205-217.
- Glover HE (1985) The physiology and ecology of the marine cyanobacterium genus Synechococcus. In: Janasch HW, Williams PJ Advances in aquatic microbiology, Academic. Press, London 3: 49-107.
- Glover HE, Prézelin BB, Campbell L, Wyman L (1988) Pico-and ultraplankton Sargasso Sea communities: variability and comparative distributions of Synechococcus spp. and algae. Mar Ecol Progr Ser 49: 127-139.
- Vernet M, Mitchell BG, Holm HO (1990) Adaptations of Synechococcus in situ determined by variability in intracellular phycoerythrin-543 at a coastal station off the Southern California coast, USA. Mar Ecol Prog Ser 63: 9-16.
- Hamasaki K, Satoh F, Kikuchi T, Toda T, Taguchi S (1999) Biomass and production of cyanobacteria in a coastal water of Sagami Bay, Japan. Jour Plankton Res 21(8):1583-1592.
- Glover HE, Garside C, Trees CC (2007) Physiological responses of Sargasso Sea picoplankton to nanomolar nitrate perturbations. Jour Plankton Res 29(3): 263-274.
- Douglas DJ (1984) Microautoradiography-based enumeration of photosynthetic picoplankton with estimates of carbon-specific growth rates. Mar Ecol Prog Ser 14: 223-228.
- Glover HE, Campbell L, Prézelin BB (1986) Contribution of Synechococcus spp to size-fractionated primary productivity in three water masses in the Northwest Atlantic Ocean. Mar Biol 91: 193-203.
- Burkhill PH, Leaky RGV, Owens NJ, Mantoura RFC (1993) Synechococcus and its importance to the microbial food web of the northwestern Indian Ocean. Deep-Sea Res II 40(3): 773-782.
- Liu H, Campbell L, Landry MR (1995) Growth and mortality rates of Prochlorococcus and Synechococcus measured with a selective inhibitor technique. Mar Ecol Progr Ser 116: 277-287.
- Kana TM, Glibert PM (1987) Effects of irradiance up to 20000µEm-2s-1 on marine Synechococcus WH7803-I. Growth, pigmentation and cell composition. Deep-Sea Res 34(4): 479-495.
- Prézelin BB, Glover HE, Ver Hoven B, Steinberg D, Matlick HA, et al. (1989) Blue-green light effects on light-limited rates of photosynthesis: relationship to pigmentation and productivity estimates for Synechococcus populations from the Sargasso Sea. Mar Ecol Prog Ser 54: 121-136.
- Sonek GJ, Liu Y, Iturriaga R (1995) In situ microparticle analysis of marine phytoplankton cells with infrared Laser-based optical tweezers. Appl Optics 34(33): 7731-7741.
- Olson RJ, Chisholm SW, Zettler ER, Ambrust EV (1988) Analysis of Synechococcus pigments types in the sea using single and dual beam flow cytometry. Deep Sea Res 35(3): 425-440.
- Hobbie JE, Daley RJ, Jasper S (1977) Use of nuclepore filters for counting bacteria by fluorescence microscopy. Appl Environ Microbiol 33(5): 1225-1228.
- Fitzwater SE, Knauer GA, Martin JH (1982) Metal contamination field and laboratory methods of control. Limnol Oceanogr 27: 544-551.
- Campbell L, Iturriaga R (1988) Identification of Synechococcus spp. in the Sargasso Sea by immunofluorescence and fluorescence excitation spectroscopy performed on individual cells. Limnol Oceanogr 33(5): 1196.
- Iturriaga R, Bower S (1993) Microphotometric analysis of the spectral absorption and fluorescence of individual phytoplankton cells and detrital matter. In: Kemp PF, Handbook of Methods in Aquatic Microbial Ecology. (1st), CRC Press, Inc Boca Raton, Florida p. 1-9.
- Dickey T, Hartwig E, Marra J (1986) The Biowatt bio-optical and Physical Moored Measurement Program. EOS 67(35): 650.
- Krempin DW, Sullivan CW (1981) The seasonal abundance, vertical distribution and relative microbial biomass of chroccoid cyanobacteria at a station in southern California coastal waters. Can Jour of Microbiology 87: 1341-1344.
- Bienfang PK, Takahashi M (1983) Ultraplankton growth rates in a subtropical ecosystem. Mar Biol 76: 213-218.
- Albani JR (2007) Principles and applications of fluorescence spectroscopy. Blackwell Science Ltd. Oxford, UK.
- Lakowicz JR (2013) Principles of fluorescence spectroscopy. In: Springer Science-Business Media, (2nd), LLC. New York.
- Six C, Thomas JC, Brahamsha B, Lemoine Y, Partenski F (2004) Photophysiology of the marine canobacterium Synechococcus WH8102, a new model organism. Aquat Microb Ecol 35(1): 17-29.
- Barlow RG, Alberte RS (1985) Photosynthetic characteristics of phycoerythrin-containing marine Synechococcus spp. I. Responses to growth photon flux density Mar Biol 86: 63-74.
- Wyman RPF, Gregory, NG Carr (1985) Novel role for phycoerythrin in a marine cyanobacterium Synechococcus Strain DC2. Science 230(4727): 818-820.


