Temporal Variation of DOM Fluorescence of Gapeau River Water, Effluent Wastewater and Sea Water and their Impact on a Developed Regression Model for Fluorescence Signal Prediction
Ibrahim EL Nahhal1*, Roland Redon1, Michel Raynaud1, Stéphane Mounier1 and Yasser EL-Nahhal2*
1Department of Earth and Environmental Sciences, University of Toulon, France
2Department of Environmental and Earth Sciences, The Islamic University, Palestinian Territories
Submission:December 20, 2021; Published:April 29, 2022
*Correspondence author: Yasser EL-Nahhal, Ibrahim EL Nahhal, Department of Environmental and Earth Sciences, The Islamic University, Palestinian Territories, University of Toulon, France
How to cite this article: Ibrahim EL N, Roland R, Michel R, Stéphane M, Yasser EL-N. Temporal Variation of DOM Fluorescence of Gapeau River Water, Effluent Wastewater and Sea Water and their Impact on a Developed Regression Model for Fluorescence Signal Prediction. Oceanogr Fish Open Access J. 2022; 14(5): 555898. DOI: 10.19080/OFOAJ.2022.14.555898
Abstract
Dissolved organic matter affects optical characteristics of water in rivers, effluent wastewater and coastal sea water. It is a major part of carbon and nutrient cycles. This study investigated the temporal variations of fluorescent organic matter from Gapeau river water (RW), effluent wastewater (WW) and sea water (SW) using excitation-emission matrices (EEM) fluorescence spectroscopy coupled with Parallel Factor Analysis (PARAFAC). Three campaigns using an autosampler collected samples of RW in Sept. 2016, SW in Oct. 2016 and WW in Nov. 2016. EEMs were collected on nonfiltered and filtered water sources and a t-test was used to investigate the impact of presence/absence of particulate organic matter. Moreover, t-test was used to investigate the impact of sunlight on fluorescence signal of these water sources. Two fluorescent components C1 and C2 of visible and UV terrestrial humic-like were found from PARAFAC analysis of EEMs of RW, WW and SW. The study revealed statistically significant differences of the impact of sunlight on C1 and C2 in nonfiltered SW; C1 nonfiltered RW and C2 filtered RW and C1 and C2 in filtered WW suggesting photo-refractory character of fluorophores from particulate organic matter from WW which is in agreement with previous multilinear regression model. In addition, seawater fluorophore was the most photo-labile compared to fluorophores from RW and WW. Mean values of C1 and C2 for both nonfiltered and filtered RW, WW and SW can be used as entry parameters in the multilinear regression model we developed previously and as boundary conditions for this model.
Keywords: Temporal variations; Dissolved organic matter; Fluorescence Excitation Emission Matrix, Effluent Wastewater; Parallel Factor Analysis (PARAFAC)
Abbreviations: RW: River Water; WW: Wastewater; SW: Sea Water; PARAFAC: Parallel Factor Analysis; CDOM: Chromophoric Dissolved Organic Matter; FDOM: Fluorescent Dissolved Organic Matter; EEM: Excitation–Emission Matrix
Introduction
Organic matter is a term used to designate the products of natural decomposition of dead matter of plant (e.g. macrophyte and algae) or animal origin together with biota which is the living organisms and can be natural or anthropogenic [1-3]. Organic matter is found in all terrestrial and aquatic systems particularly surface waters and considered to play an important role in the global carbon cycle. In addition, it constitutes a very complex mixture of compounds which can be of aliphatic or aromatics nature [4-7]. Chromophores constitute a main part of dissolved organic matter known as chromophoric dissolved organic matter CDOM, which impacts water quality in aquatic systems. Fluorescent dissolved organic matter FDOM, are subset of CDOM which have the ability to emit light energy at longer wavelengths when itself had absorbed light energy of shorter wavelengths (i.e. higher frequency hv). Fluorescence spectra of FDOM brings forth information about the origin and sources of DOM and enables linking DOM with various sources of pollution [8].
The optical properties of organic matter (i.e. UV-VIS absorbance and fluorescence spectra) can provide an indication of its quantity in water since the brownish yellow color (aka. Gelbstoff) in surface water is caused by the presence of this organic matter [9]. Fluorescence is a physical method used for chemical analysis of analytes in water samples where the analyte of interest is irradiated and excited at a given wavelength and the emitted light is measured at a different and longer wavelength. The sensitivity and selectivity of fluorescence spectroscopy is very high compared to UV-Vis absorbance spectroscopy which makes its suitable for the online monitoring of water quality in natural and engineered aquatic systems and that’s why much attention has been given to it in the water industry [10-11]. The spectrophotometric method of three-dimensional fluorescence excitation–emission matrix (EEM) has been widely used to characterize dissolved organic matter in environmental compartments in which fluorophores in DOM can be visualized by merging emission scans over a range of excitation wavelengths between 200 nm and 500 nm of excitation and emission wavelengths [8,12].
Multivariate data analysis especially parallel factor analysis (PARAFAC) have been used to analyze and dismantle the convolution and high dimensionality of EEMs datasets and to separate the existing fluorophores into unique components which are found in water samples from various sources. Effluent organic matter contains refractory organic compounds which resisted the biological treatment of urban wastewater where its molecular structure can be classified in accordance with their functional groups and cannot be characterized exactly [13]. The spatial and temporal variations of dissolved organic matter in aquatic systems have been the focus of several studies recently [14-16]. The climatic and hydrological conditions among many other factors have a considerable impact on the quality of dissolved organic matter in aquatic systems which affect the spatial and temporal variations of this DOM [17].
It has been shown that the spatiotemporal variability of chromophoric and fluorescent dissolved organic matter is of utmost importance for many research areas such as the biogeochemical studies in addition to geological and remotesensing studies for the changes that occur in the coastal zone between land-water interface and for the management of this coastal zone and marine sciences [18]. In our previously published articles, we developed a multilinear regression model for the prediction of mixing composition based on fluorescence measurements and PARAFAC analysis as follows:

where : C*i is the PARAFAC component and fSW and fRW are the mixing composition with more details and explanations given in [19,20]. The temporal variations of the mixing composition can impact the results therefore, more developments on this model are warranted so that this model can be used and developed for global aquatic environments. Temporal variations of river water, effluent wastewater and seawater are affected by the diurnal light/dark cycle where photodegradation may occur to the dissolved organic matter therein [21-23].
The aim of this work is to understand and evaluate the temporal variations due to solar irradiation of three water types (RW, effluent WW, SW) which in turn provide information for the multilinear regression model for fluorescence prediction based on mixing composition developed in previously published articles [19,20]. The hypothesis of this study is that diurnal light/dark cycle and solar irradiation has an impact on the fluorescence characteristics of dissolved organic matter found in river water, effluent treated wastewater and sea water which in turn have an impact on the multilinear regression model. The second hypothesis of this work is that Filtration may have an impact on the temporal variations of fluorescence signal of RW, WW and SW. Our focus is on how the fluorescence signal ;not any additional parameter; varies with time.
Materials and Methods
Study area
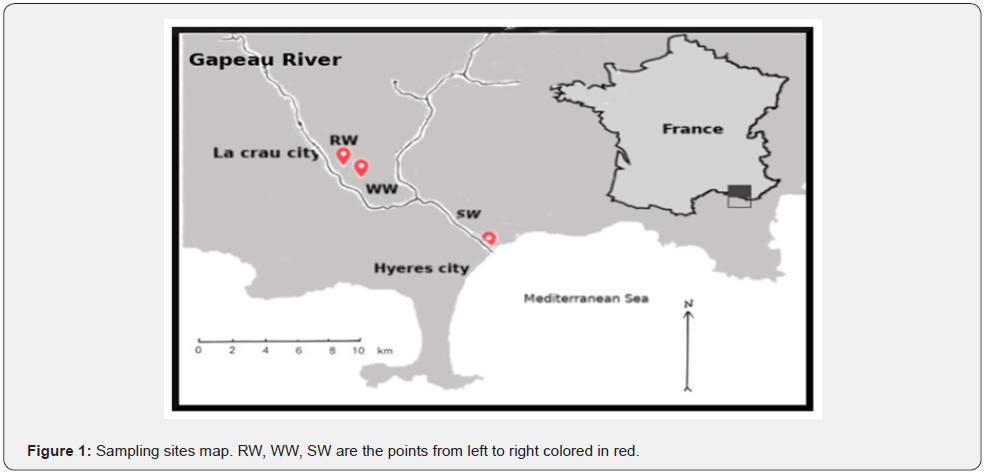
The three sites mentioned in our previous works [1,19] were investigated to understand and evaluate their temporal variations of fluorescence. These sites were Gapeau river, effluent treated wastewater of wastewater treatment plant of La Crau city and the sea water at Hyeres city which is the mouth of the Gapeau river. Gapeau river is found in the southeastern part of France in Provence region in a department named VAR and is considered to be the second largest river in the VAR department with a length of 47.5 km and a watershed area 544 km2. The second site was the outlet of the wastewater treatment plant WWTP of La Crau city. Secondary and tertiary technologies is used in this WWTP for wastewater treatment generated by 50,086 inhabitants. Effluent treated wastewater is denoted as WW in this study. The last site was sea water (denoted as SW) at L’ayguade site in Hyeres city which receives the runoff of Gapeau river and is subject to recreational activities. Exact GPS locations of the studied sites are presented in Table 1 and a map for the sampling sites is given in Figure 1.
Field sampling and laboratory measurements
Preparation of autosampler bottles and sample collection of three water sources (RW, WW, SW)
Twenty-four plastic bottles (1L each) were cleaned with nitric acid (10%, Analytical Grade) to remove all microorganisms then they were rinsed with MilliQ-water (18.2 MΩ·cm at 25°C) . These twenty-four bottles were numbered from 1 to 24 serially and inserted inside the autosampler. The autosampler shown in Figure 2 was used to collect samples from the three water sources used in this study (RW, WW and SW). The autosampler was transferred to the sampling sites and it was programmed to collect one sample every two hours there for 48h cycle.
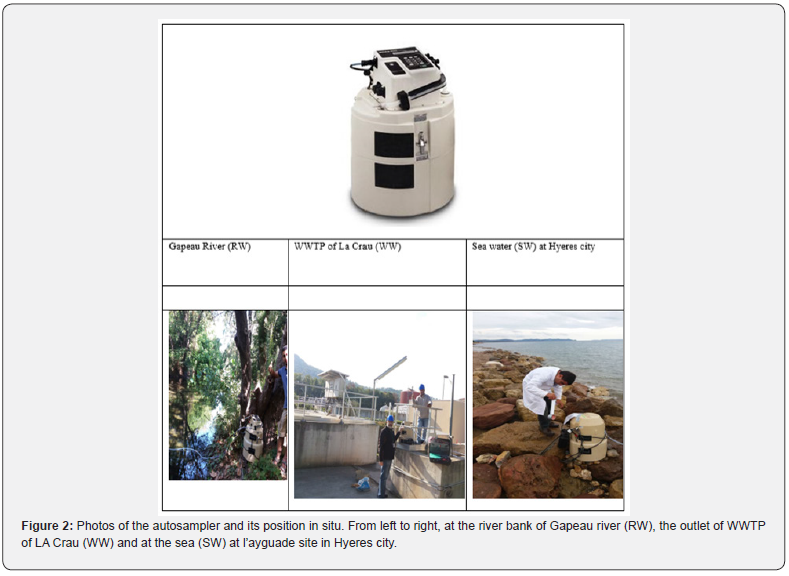

The autosampler has a long tube for sucking the water from the sampling sites at a depth of 1 meter of surface. At the end of each sampling, the autosampler was transferred to our laboratory and the plastic bottles were put outside of it. Then immediately after the return to laboratory, 3ml from each plastic bottle were taken inside 1cm cuvette for further fluorescence measurement as described below. Gapeau river (RW) was sampled on September 19th 2016 and ended on September 21th 2016, effluent treated wastewater (WW) at the outlet of La Crau city WWTP was sampled temporally by the autosampler starting from November 15th 2016 and ended on November 17th 2016 whereas, the twentyfour samples of Sea water (SW) were sampled from October 17th 2016 and ended on October 19th 2016. These sampling dates were chosen arbitrarily in our study where we recommended to repeat this study for different seasons. There was precipitation event during the sampling of seawater SW.
Laboratory analysis of the 24 plastic bottles of the autosampler
Filtration/Non-filtration of samples: Twenty-four samples were measured on raw (NF) and filtered (F) states to investigate the effect of presence/absence of particulate organic matter in samples.
i. Non-filtered (NF) raw samples: Immediately upon the return of autosampler to the laboratory from each sampling campaign in Table 1, the 24 plastic bottles in the autosampler were taken out. No turbidity nor particulate matter was observed in the sampled water. Then sixty milliliters (60 mL) were taken in amber glass vials from each 1L plastic bottle in the autosampler. Then, 3 mL aliquots were sampled and transferred to fluorescence spectrophotometer for measurements of Excitation emission matrices as described in detail in the following sections. Then, these amber glass vials were kept in the dark at 4 °C for 24 hours for further processing (i.e. filtration) for the next day.
ii. Filtered (F) samples: In the following day immediately, the amber glass vials of 60 ml were taken out from refrigerator and left for an hour to be at room temperature. Sartorius 0.45 micrometer was used to get 3ml filtered samples of each vial. Then these filtered 3 ml were put in 1cm cuvette and put inside the fluorescence spectrophotometer as described in detail in the following sections.
pH measurement: Upon the return of autosampler to the laboratory, pH measurements were taken using pocket pH meter kits which were previously calibrated by pH standards.
Measurements of UV-Vis spectra: UV-VIS spectra between 250 and 800 nm were gathered on PerkinElmer UV/VIS spectrophotometer using quartz 1 cm cuvette and the reference sample was filled with MilliQ water. A check has been conducted to scan for inner filter effect on the same 1L plastic bottles of RW, WW and SW in accordance with previous report [24].
Excitation Emission Matrix EEM fluorescence spectroscopy
The fluorescence maps expressed as excitation emission matrix (EEMs) of the non-filtered (NF) and filtered (F) samples were measured by means of a 1-cm quartz cuvette and Hitachi F-4500 spectrofluorometer (Hitachi High-Technologies Corp., Tokyo, Japan) with PMT voltage of 700 V, at 25 ℃ room temperature. No particulates were present in the raw nonfiltered nor in the filtered samples during the fluorescence analysis. EEMs were gathered by the measurement of fluorescence intensity through the ranges of excitation wavelengths (Ex) spectra and emission wavelengths (Em) spectra between 200 nm and 400 nm at 5 nm-increment, and between 220 and 420 nm at 5 nmintervals respectively with scan speed of 2,400 nm.min-1. Slit width of 5 nm was set for wavelengths of excitation and emission. EEM datasets of non-filtered (NF) and filtered (F) samples were processed separately using Matlab 2013a (Math Works Inc., USA). EEMs of sealed ultrapure Perkin Elmer deionized water cell blank were subtracted from all the EEMs dataset in order to remove water Raman scatter peaks and hence Raman units (RU) are used for fluorescence intensities.
Parallel factor analysis (PARAFAC) of EEM datasets
EEMs datasets can be decomposed in unique individual fluorescence components through Parallel Factor Analysis (PARAFAC) which is an advanced multiway technique [25,26]. PARAFAC analysis was done on EEMs datasets of non-filtered and filtered samples of each water source (RW, WW and SW) separately for 72 EEMS for nonfiltered water soures (RW, WW and SW) and 72 EEMs for filtered (RW, WW and SW) through MATLAB R2015b program coupled with NWAY and DOMFluor toolbox (http://www.models.life.ku.dk) [27,28]. 25 nm cutoff filter was used in accordance with previous report [29] to remove Raman/ Rayleigh scattering from EEMs datasets. In addition, each EEM was corrected for instrument optics and the inner filter effect was corrected as previously described elsewhere [30] prior to PARAFAC analysis. The appropriate number of PARAFAC components was chosen and validated according to CONCORDIA score, split- half analysis [31-33]. Variations of PARAFAC components in this study represents the temporal variations of fluorescent dissolved organic matter FDOM from each water source (RW, WW and SW).
Statistical Analysis
Student t-test was performed on the filtered and nonfiltered RW, WW and WW to check for statistical significance using Microsoft Excel 2016. In addition, t-test was conducted between daylight and dark night PARAFAC Components to check for the impact of sunlight. Statistical significance was evaluated a p-value of < 5%.
Results and Discussions
Temporal variations of RW, WW and SW were investigated to understand how the fluorescence signal of the dissolved organic matter of each varies during light and dark hours. Twenty-four samples of WW were collected in November 2016 and RW was in September 2016 whereas for SW were sampled in October 2016. Exact dates for temporal field experiment could be consulted in methodology section.
pH variations in RW, WW and SW
The data in Figure 3 clearly show the temporal (48 h cycle) variation of pH values of RW, WW and SW. Concerning pH, SW present a constant value. There is no pH change due to the rain for sea water. It seems that there is a tendency for pH to decrease during day and increasing during night. This could be explained by the buffer role of carbonate system. For RW, it can be seen that there is a higher variability and a slight decrease during night, pH is around 8. WW on the contrary, is more often below 8 during 48H of sampling.
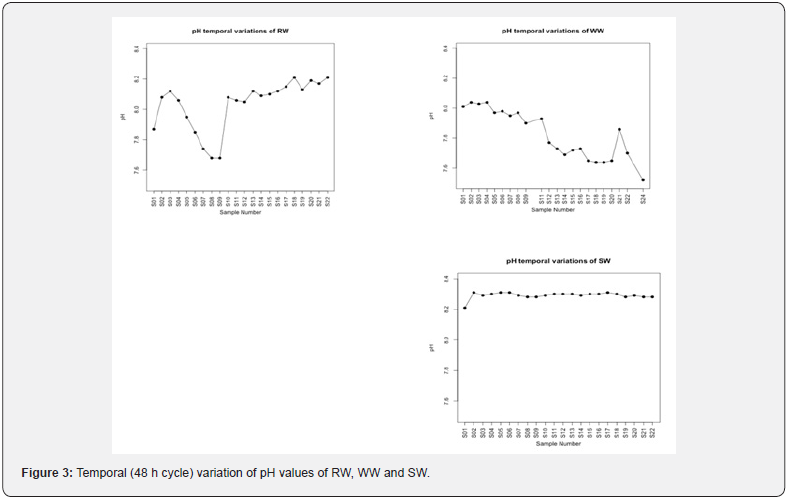
pH of RW showed an average 8.05 ± 0.17 whereas pH of SW is quite constant and around 8.29 ± 0.02. For WW, pH is the lower one as expected 7.82 ± 0.16 which is more neutral compared to others. In addition, range of pH of WW is in the normal range which is consistent with the results of [34] who found that pH values ranged between 6.8 and 8.3 in an urban municipal wastewater effluent. For RW, the first twelve samples showed a maximum at sample number S04, and a minimum at S10. After this, there is an increase to pH=8 and no more detectable variation. During night, pH of RW is constant and started to increase in the beginning of morning because there is other wastewater treatment plant effluent upstream of RW which impact and contribute to this slight increase of pH of RW and it remain a little bit constant (around 8.1) till noon where there is a slight decrease then it returns back to its higher constant value in the night till midnight. pH of WW shows the highest variability starting from morning till noon because wastewater treatment plant has its higher load during the morning which influence its pH value by decreasing it. Slight decrease of pH value of the sea water could be attributed to the rainfall event on the day of sampling. Spatial variation of pH is as following WW RW SW.
Here below we discuss the acidity sources that may have a critical rule in pH changes in aquatic ecosystem:
Reaction of different sources of CO2 (e.g respiration, combustion of fuel, biodegration reactions, and geochemical reactions) with water systems (RW, SW, WW) result in formation of Carbonic acid as in eq (1). Then the activities of phytoplankton and zooplankton maintain the acidity as in eqs (2) and (3) respectively. These rules are key issues in the changes of pH values in RW, WW, SW. Phytoplankton and zooplankton are active in the ocean and river and less active in WW due to low sunlight penetration, accordingly a stable pH values as observed during day and night in the ocean.

During the day the phytoplankton use HCO3- after converting it to CO2 inside their cell to form carbohydrate and oxygen throughout normal photosynthetic activity according to reaction (2)

Additionally, the zooplankton, calcifying organisms, can use bicarbonate to for their shells according to equation (3)

According to Eq (2) phytoplankton role and Eq (3) zooplankton role, the acidity in RW and SW may be maintained and the pH value may slowly change due light intensity and other factors such as the high buffering capacity of the ocean. These reactions are in accordance with McLaskey et al. [35] who found quite similar role of phytoplankton on the ocean. Additionally, Kohlbach et al. [36] reported the role of antarctic zooplankton species on the sea acidity. In contrast, ocean acidity has been shown to cause certain damage to phyto-and zoo-plankton in the ocean [37].
Biodegradation of dissolved organic carbon
Dissolved organic carbon such as carbohydrate like compounds and protein like compounds may undergo biochemical degradation reaction as in Equation 4 & 5. These degradations may occur in all aquatic systems specially with different rates.

As obvious reactions (Eqs 4-5) produced considerable fraction of H+ ion, hydrogen sulfide and ammonia, very soluble inorganic compounds produced by degradation of dissolved organic carbon. This is in agreement with Wang et al. [38] who revealed that photo-degradation of DOM may produce even larger amounts of dissolved inorganic carbon in global freshwater and seawater. Produced hydrogen ion contributes to ocean acidity. The other ionic fragments (CO2, H2S and NH3) contribute to the geochemical cycles of carbon, nitrogen and sulfur.
Oxidation of inorganic molecules of dissolved organic carbon
The degradation products of carbohydrate and protein like compounds in equations 4 and 5 undergo oxidation reaction to produce H+ ion that contribute to the pH changes in aquatic systems. These reactions may occur in surface water, photoactive zones as in river and oceans wastewater treatment plant specially oxidation ponds,
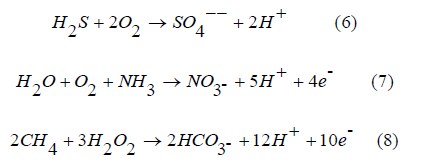
It can be concluded that all equations except eqs 2 and 3, produce hydrogen ion that contribute to pH changes. Additionally, reactions 2 and 3 maintain the acidity in river and sea water. Our explanation is in accordance with [39] who reported the contribution of ammonia oxidation to chemoautotrophy in Antarctic coastal waters. Additionally, Findlay et al. [40] reported the oxidation of hydrogen sulfide by phototrophic bacteria in the anoxic zone of the Chesapeake Bay.
Verification of Inner filter effect in RW, WW and SW
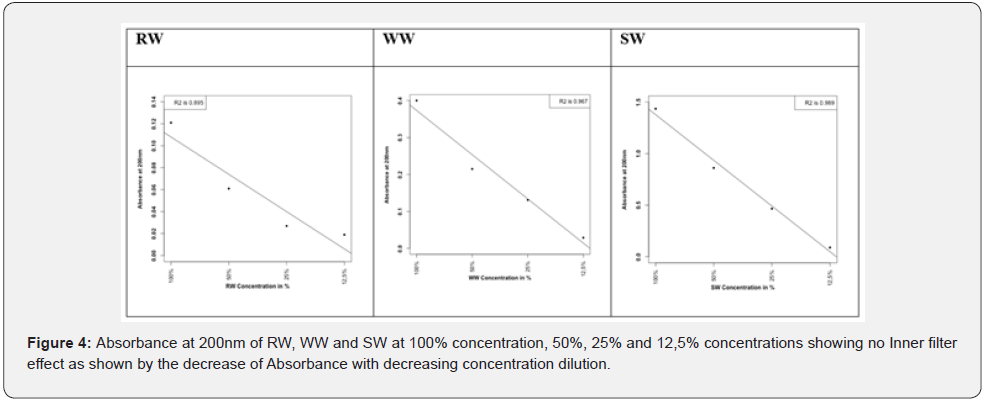
The absorbance at the wavelength of 200 nm of 100% (no dilution), 50% (50% dilution), 25% dilution and 12.5% dilution of the three water sources RW, WW and SW in this study are shown in Figure 4. This dilution of RW, WW and SW has been conducted to check for the presence/absence of inner filter effect. It can be seen from Figure 5 that uv-vis absorbance at 200nm for all the three water sources (RW, WW and SW) decreases linearly as the concentration of (RW, WW and SW) decreases from 100% to 50% and 25% and 12.5% in a linear negative correlation which indicate the absence of the inner filter effect in either of these water sources in addition EEMS were corrected mathematically for inner filter effect according to Tucker et al. [24]; Ohno [30].
Parafac Analysis
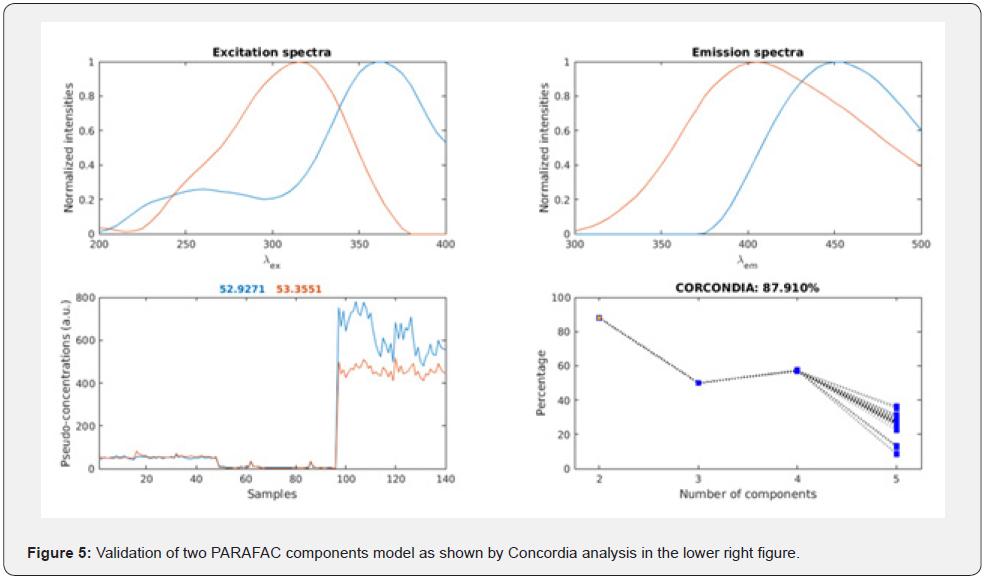
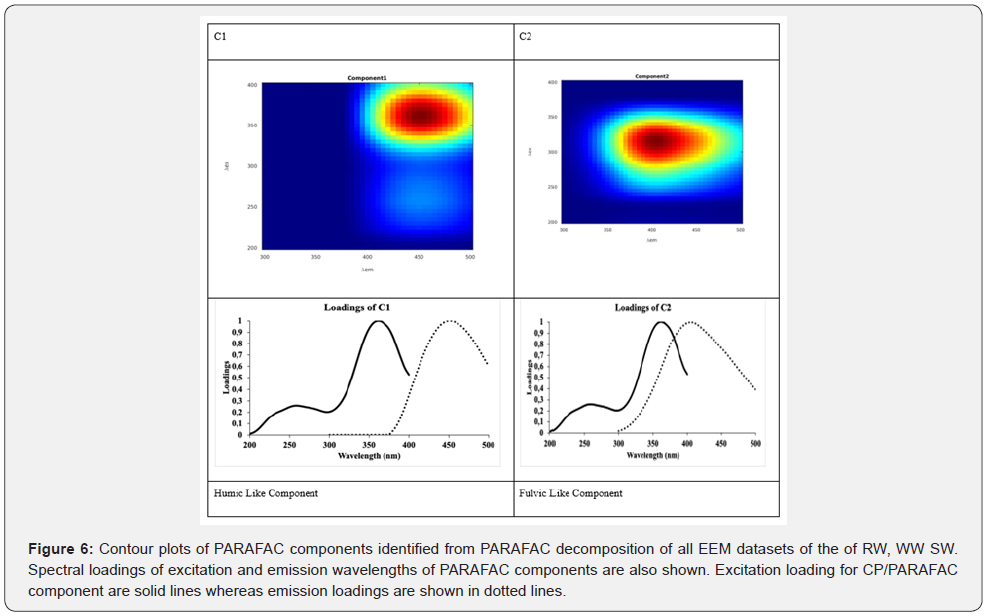
PARAFAC analysis is a more advanced method in comparison to the peak-picking method which enables the decomposition of large EEM datasets into individual components existing in each EEM of the dataset with different and varying pseudo- concentrations whereas the analysis of EEM datasets using A, C, M, T, peak picking methods yield a very large number of graphs for each peak. 72 EEMs and another 72 EEMs of 24 samples from the 48 hours sampling of three water sources (RW, WW and SW) for both the nonfiltered and filtered states have been decomposed by PARAFAC for a total of 144 EEMs. PARAFAC decomposition derived from spectral deconvolution of 144 EEMs resulted in two PARAFAC components (Figure 6) representing the whole EEMs dataset with varying contributions. These two PARAFAC components represent two unique spectra in 144 EEMs with varying pseudo-concentrations. These PARAFAC components have loadings which are fluorescence spectra of these components shown in Figure 6. Split-half analysis has been conducted on the EEMs dataset of nonfiltered EEMs (72 EEMs) and filtered EEMs (72 EEMs) separately and validated the two PARAFAC components found from the decomposition of 140 EEMs dataset which is a good indication that the selected two-component PARAFAC model exhibits and represents a true least square fit. Moreover, this two PARAFAC components model has also been validated by Concordia analysis [25] which gave a value of 87.91 % as can be seen in Figure 5.
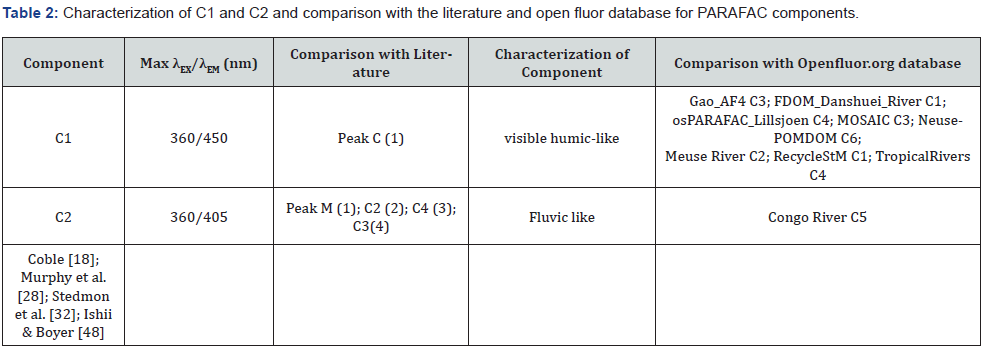
Two components were successfully found by PARAFAC modelling on EEM datasets of RW, WW and SW after the removal of the 1st and 2nd order Rayleigh and Raman Scattering. The above Figure 6 shows contour plots of two PARAFAC components as well as their corresponding loadings for both the excitation and the emission wavelengths. These two fluorescent PARAFAC components have been previously identified (Table 2). The 1st PARAFAC component, C1 component showed an excitation maximum at 360 nm and an emission maximum at 450 nm and a range of excitation emission wavelengths (Ex=200-400 nm, Em=400-500 nm). Previous studies have associated this component to visible humic-like fluorescent PARAFAC component and Peak C [8]. The 2nd PARAFAC component, C2 showed an excitation maximum at 360 nm and an emission maximum at 405 nm and a range of excitation emission wavelengths (Ex=200-400 nm, Em=300-500nm). These two PARAFAC components C1 and C2 greatly resembles PARAFAC components C1 and C2 found in our previous studies of irradiation experiments published recently [19,20]. In addition, spectra of C2 component resembles Peak M which is marine humic like fluorescence [8].
Temporal variation of PARAFAC components C1 and C2
The temporal variation of C1 and C2 for both nonfiltered and filtered samples of RW, WW and SW were generated based on the scores and loading of two-components PARAFAC model and are shown in the following Figures.
RW
The 48 hours variations of C1 and C2 of RW for both nonfiltered and filtered samples (S1-S24) are shown in Figure 7. It can be seen from Figure 7 that for the non-filtered samples, the contribution of PARAFAC component C1 fluctuates around a mean value of about 88.15 ± 5.08 arbitrary units and shows a fluctuation with a constant trend. Values of contribution of PARAFAC C1 component in the filtered samples (graph (b)) are less than those in the nonfiltered samples. Effect of filtration of samples on the first PARAFAC component can be seen in graph (b) which shows a diminution of contribution of this PARAFAC component and there is a diminution and decline of contribution of this C1 during night while during day there is an increase of contribution of C1 from morning till noon and then a decrease can be seen from afternoon till the end of day. For second PARAFAC component C2, its contribution is constant during the first hours of day then it started to decrease till noon and after that it increased till night in the nonfiltered samples. Effect of filtration on contribution of this C2 could be noticed as a slight diminution of its variations. Component C2 is related to vascular plant or terrestrial origin.
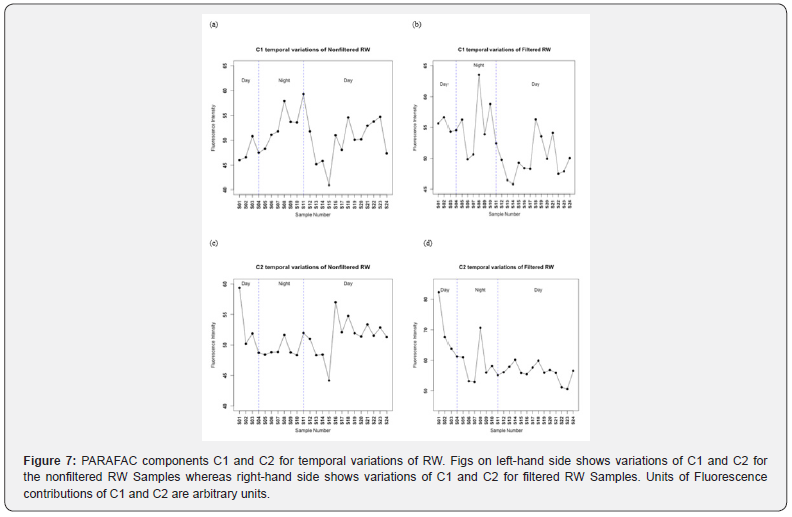
Paired two samples t-test of means has been conducted for the nonfiltered C1 and filtered C1 and nonfiltered C2 and filtered C2 at a level of significance of 5%. P-value for a two-tailed test for C1 (nonfiltered and filtered) was 0.10 which is greater than 0.05. Therefore, there is no statistically significant differences between nonfiltered C1 and filtered C1. Whereas a p value of 4,10x10- 06 was calculated for Nonfiltered C2 and filtered C2 which is less than 0.05. Accordingly, there was statistically significant differences between nonfiltered C2 and filtered C2 which lead to the conclusion that particulate organic matter POM from RW contribute to the fluorescence of this component C2. Furthermore, a t-test was done to compare between day variations and night variations for the nonfiltered RW during daylight compared to nonfiltered RW during dark night hours. The same was done for the filtered RW day vs filtered RW dark night. A p-value of 0,0006 was found for the daylight-night comparison of C1 in nonfiltered RW indicating statistically significant differences. This suggest that photodegradation has a measurable effect on this visible humic like fluorescent component C1. On the other hand, no statistically significant differences were found for C1 in filtered RW during light hours vs dark hours. This finding suggests that photodegradation affect the fluorophores in nonfiltered RW and has no effect on the filtered RW. In contrast, there were statistically significant differences for C2 in only the filtered RW during light hours compared to dark hours (p-value = 0.01) and no statistically significant differences in the nonfiltered RW (light vs dark).
The explanation of these results is that exposure to sunlight during the day expose the dissolved organic carbon to photochemical degradation and/or oxidation reactions as in the equations mentioned above, resulting in production of a new fragment or metabolite that shift the fluorescence intensity of the dissolved organic carbon or losing the fluorescence intensity. The differences of fluorescence intensity of C1 or C2 during the day is probably due to the fact that light intensity is the highest during the middle of the day because the sunlight is perpendicular to the surface of the ocean or river, at this case most of sunlight penetrate the water body resulting in maximum absorbance. On the other hand, early in the morning and late in the afternoon the incident light may be reflected due to the angle of incident light. At this case, part of the light may penetrate the water body and caused a small fluorescence intensity to the dissolved organic carbon as shown in Figure 7. On the other hand, the reaction rates of dissolved organic compounds in water is affected by the intensity of sunlight.
This is in accordance with Wang et al. [41] who found enhanced photochemical degradation of nebivolol in different natural organic matter solutions under simulated sunlight irradiation. Furthermore, Gornik, et al. [42] revealed the photodegradation of sertraline in aqueous systems due to exposure to sunlight. Moreover, Sun et al. [43] reported the degradation of N,N-diethyl- 3-methylbenzamide and caffeine, by ultraviolet light and simulated sunlight in different water matrices. In contrast, fluorescence intensity during night may appear due to the phosphorescence phenomena that may occur due to the formation of some molecules due to photochemical degradation of dissolved organic compounds. Furthermore, exposure to sunlight may generate heat the enhance the chemical reactions in aquatic systems. Our explanation is in accordance with previous reports [44,45] which revealed losing biological activities of pesticides due to direct exposure to sunlight and changes of maximum absorption due indirect exposure to sunlight. The indirect exposure to sunlight may produce thermal energy that may cause thermochemical degradation to the organic molecules. Additionally, exposure to sunlight may enhance metal DOC reaction resulting in formation of organometallic compounds that may shift the fluorescence intensity to different wavelength. This suggestion is in agreement with Wiatrowska & Komisarek [46] who reported changes in DOC concentration due to possible reaction between DOC and metals and with Cai et al. [47] who used an array of absorbance, fluorescence, for characterizing property and treatability of effluent organic matter from 12 wastewater treatment plants.
Effluent treated wastewater WW
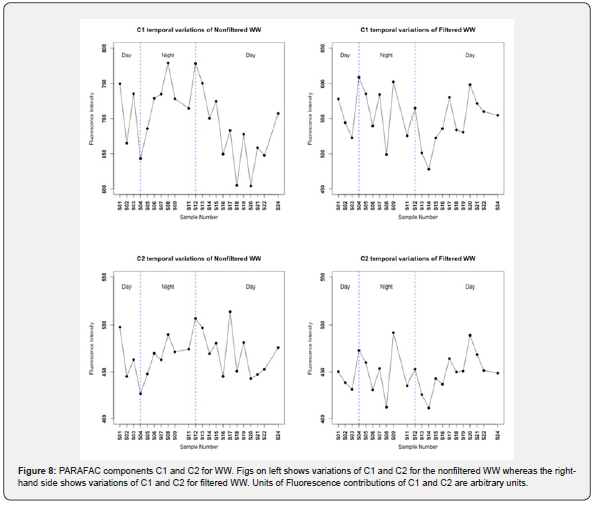
Temporal variation of PARAFAC components C1 and C2 for WW for both the filtered samples and the nonfiltered samples are shown in Figure 8. It can be seen from Figure 8 that both of PARAFAC components C1 and C2 have bigger variations compared to variations of C1 and C2 in (Gapeau river, seawater) since fluorescence intensity of C1-C2 of WW varied between 600-800 arbitrary units whereas fluorescence intensity of C1 and C2 varied within a range of values below 80 arbitrary units in RW and SW.
These results can be explained by the fact that the advanced wastewater treatment technologies used in La Crau WWTP cannot get rid completely of dissolved fluorescent organic matter. T-test for nonfiltered C1 and filtered C1 gave a p-value of 2,24x10- 09 (< 0.05 level of significance), therefore there is statistically significant differences between nonfiltered C1 and filtered C1 of WW. P-value of paired t-test for nonfiltered C2 and filtered C2 was 0.013 (< 0.05), accordingly there are also statistically significant differences between nonfiltered C2 and filtered C2 of WW. These statistically significant differences between (nonfiltered C1, filtered C1) and (nonfiltered C2, filtered C2) indicate that fluorophores of POM of WW has an impact and a measurable effect on the fluorescence. The fluorescence intensity of C1 and C2 of nonfiltered and filtered WW was higher and greater than those coming from RW and SW. This agrees with our previous studies on mixing these water sources (RW, WW and SW) and the irradiation experiments therein in which the residual fluorescence was coming from WW even after irradiation which was represented by AWW*,0 in the multilinear regression model [19,20]. The comparison using t-test between daylight and dark night hours resulted in statistically significant differences only in the filtered WW for both C1 and C1 with p-values of 0.02 and 0.03 respectively. This suggests that sunlight impacted the filtered WW and not nonfiltered WW indicating the photo-resistance and refractory nature of the fluorophores from treated wastewater and this emphasized the above-mentioned finding related to the multilinear regression model. The explanation of these results is similar to those given above. Moreover, similar observation was recently reported [47].
Sea Water SW
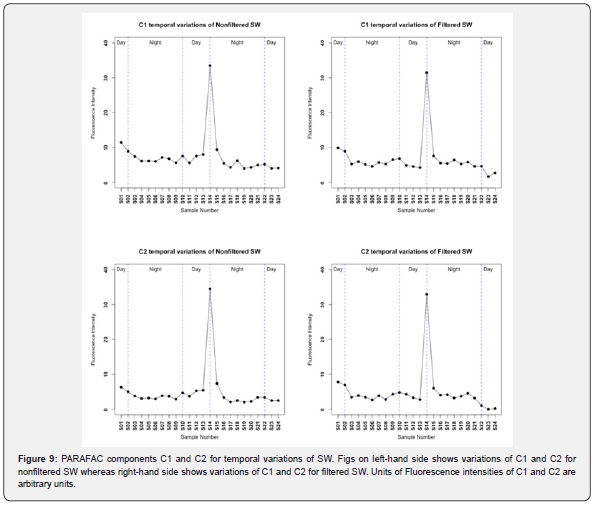
Temporal variation of PARAFAC components C1 and C2 (terrestrial humic-like fluorescence); for SW for both filtered and nonfiltered samples are shown in Figure 9. It can be seen from Figure 9 that there is a peak at sample number S14 which corresponds to rainfall event which started to occur at 5 pm and stopped at 8 pm. This suggests that rainfall event inputs some of terrestrial humic-like fluorescence as indicated by this fluorescence peak of PARAFAC components C1 and C2. The t-test of paired samples of C1 of SW for nonfiltered samples and filtered samples resulted in a p-value of 0.004 < 0.05 which lead to the rejection of the null hypothesis that there is no statistically significant difference in the means of nonfiltered C1 and filtered C1; therefore, POM of SW has a measurable impact on the fluorescence of C1 of SW. On the other hand, there was no statistically significant differences between the means of nonfiltered C2 and filtered C2 (p-value = 0.77 > 0.05), hence there is no impact of POM of SW on C2. Statistically significant differences were found in the comparison between daylight samples and dark night samples for both C1 and C2 only in the nonfiltered SW at p-values of 0.015 and 0.019 respectively [48,49]. This finding was in contrast to the filtered SW samples where no impact of sunlight was detected in C1 and C2. This suggest that sunlight only affects the nonfiltered SW indicating the photo-labile nature of chromophores and fluorophores of nonfiltered SW.
Conclusion
The rationale of this work comes from the need to know how do the fluorescence signal from three water sources (i.e. RW, WW and SW) vary with respect to diurnal variations and diurnal solar irradiation. In addition to the need to improve the multilinear regression model developed in our previous studies for the prediction of fluorescence signal depending on mixing composition and solar irradiation. The finding of this study showed statistically significant differences between the nonfiltered and filtered RW, WW and SW. C1 and C2 were statistically significant in the nonfiltered and filtered WW indicating the refractory nature of fluorophores of effluent treated wastewater. Whereas, only C2 in RW was statistically significant in comparing the filtered and nonfiltered RW using a t-test and the same was for C1 in SW.
The mean values of C1 and C2 for both nonfiltered and filtered RW, WW and SW can be used as entry parameters in the multilinear regression model we developed previously and as boundary conditions for this model. Sunlight exposure has an effect on C1 and C2 in nonfiltered SW showing that seawater fluorophore was the most photo-labile compared to fluorophores from RW and WW. More research studies are needed to have a 48-hour cycle of these water sources in several seasons. Or several 48-hour cycle with higher resolution in each season, in order to have a global idea about temporal variations of these water sources and effects of photodegradation in presence or absence of particles.
Acknowledgement
Special thanks go to Christian Martino for his participation in the sampling campaigns and his technical support of this work. Thanks goes also for our colleague Mahdi Abaker for his participation in one of the sampling campaigns.
References
- El Nahhal I, Redon R, Raynaud M, El Nahhal Y, Mounier S (2020) Characterization of the fate and changes of post-irradiance fluorescence signal of filtered anthropogenic effluent dissolved organic matter from wastewater treatment plant in the coastal zone of Gapeau river. Environ Sci Pollut Res Int 27(18): 23141-23158.
- Nebbioso A, Piccolo A (2013) Molecular characterization of dissolved organic matter (DOM): a critical review. Analytical and bioanalytical chemistry 405(1): 109-124.
- Coble PG (2007) Marine optical biogeochemistry: the chemistry of ocean color. Chemical reviews 107(2): 402-418.
- Swietlik J, Dabrowska A, Raczyk Stanisławiak U, Nawrocki J (2004) Reactivity of natural organic matter fractions with chlorine dioxide and ozone. Water research 38(3): 547-558.
- Cory RM, Ward CP, Crump BC, Kling GW (2014) Carbon cycle. Sunlight controls water column processing of carbon in arctic fresh waters. Science 345(6199): 925-928.
- Opsahl S, Benner R (1997) Distribution and cycling of terrigenous dissolved organic matter in the ocean. Nature 386(6624): 480- 482.
- Thurman EM (1985) Organic Geochemistry of Natural Waters. Martinus Nijhoff / Dr. W. Junk Publishers, Dordrecht, The Netherlands.
- Coble PG (1996) Characterization of marine and terrestrial DOM in sea- water using excitation-emission matrix spectroscopy. Marine Chemistry 51(4): 325-346.
- Uyguner CS, Suphandag SA, Kerc A, Bekbolet M (2007) Evaluation of adsorption and coagulation characteristics of humic acids preceded by alternative advanced oxidation techniques. Desalination 210: 183-193.
- Bieroza M, Baker A, Bridgeman J (2009) Relating freshwater organic matter fluorescence to organic carbon removal efficiency in drinking water treatment. The Science of the total environment 407(5): 1765-1774.
- Peiris RH, Hallé C, Budman H, Moresoli C, Peldszus S, et al. (2010) Identifying fouling events in a membrane-based drinking water treatment process using principal component analysis of fluorescence excitation-emission matrices. Water Res 44(1): 185-194.
- Green S (1992) Applications of fluorescence spectroscopy to environmental chemistry. PhD thesis. MIT/WHOI Joint Progr. Oceanogr pp. 228.
- Abbt-Braun G, Lankes U, Frimmel FH (2004) Structural characterization of aquatic humic substances – The need for a multiple method approach. Aquatic Science 66: 151-170.
- Xie M, Chen M, Wang WX (2018) Spatial and temporal variations of bulk and colloidal dissolved organic matter in a large anthropogenically perturbed estuary. Environmental pollution 243(Pt B): 1528-1538.
- Musadji NY, Lemée L, Caner L, Porel G, Poinot P, et al. (2020) Spectral characteristics of soil dissolved organic matter: Long-term effects of exogenous organic matter on soil organic matter and spatial-temporal changes. Chemosphere 240: 124808.
- Mendoza, Wilson G, Zika, Rod G (2014) On the temporal variation of DOM fluorescence on the southwest Florida continental shelf. Progress in Oceanography 120: 189-204.
- Sharp EL, Parsons SA, Jefferson B (2006) Seasonal variations in natural organic matter and its impact on coagulation in water treatment. The Science of the total environment 363(1-3): 183-194.
- Loisel H, Vantrepotte V, Dessailly D, Mériaux X (2014) Assessment of the colored dissolved organic matter in coastal waters from ocean color remote sensing. Optics express 22(11): 13109-13124.
- El Nahhal I, Redon R, Raynaud M, El Nahhal Y, Mounier S (2020) Characterization of the fate and changes of post-irradiance fluorescence signal of filtered anthropogenic effluent dissolved organic matter from wastewater treatment plant in the coastal zone of Gapeau river. Environ Sci Pollut Res Int 27(18): 23141-23158.
- El Nahhal I, Redon R, Raynaud M, El-Nahhal Y, Mounier S (2021) Modelling of impact of presence/absence of suspended particulate organic matter from river and sea and effluent wastewater on fluorescence signal in the coastal area of Gapeau River. Environ Sci Pollut Res Int 28(27): 36707-36726.
- Cory RM, Kling GW (2018) Interactions between sunlight and microorganisms influence dissolved organic matter degradation along the aquatic continuum. Limnology and Oceanography Letters 3(3): 102-116.
- Hansen AM, Kraus TEC, Pellerin BA, Fleck JA, Downing BD, et al. (2016) Optical properties of dissolved organic matter (DOM): Effects of biological and photolytic degradation. Limnology and Oceanography. 61(3): 1015-1032.
- Berg SM, Whiting QT, Herrli JA, Winkels R, Wammer KH, et al. (2019) The Role of Dissolved Organic Matter Composition in Determining Photochemical Reactivity at the Molecular Level. Environmental Science and Technology 53: 11725-11734.
- Tucker SA, Amszi VL, Acree WE (1992) Primary and secondary inner filtering: effect of K2Cr2O7 on fluorescence emission intensities of quinine sulfate. Journal of Chemical Education 69: A8-A12.
- Bro R (1997) PARAFAC. Tutorial and applications. Chemometrics and Intelligent Laboratory Systems 38(2): 149-171.
- Stedmon CA, Markager S (2005) Resolving the variability in dissolved organic matter fluorescence in a temperate estuary and its catchment using PARAFAC analysis. Limnology and Oceanography 50(2): 686-697.
- Micó P, García Ballesteros S, Mora M, Vicente R, Amat AM, et al. (2019) EEMlab: a graphical user-friendly interface for fluorimetry experiments based on the drEEM toolbox. Chemometrics and Intelligent Laboratory Systems 188: 6-13.
- Murphy KR, Stedmon CA, Waite TD, Ruiz G M (2008) Distinguishing between terrestrial and autochthonous organic matter sources in marine environments using fluorescence spectroscopy. Marine Chemistry 108(1-2): 40-58.
- Zepp RG, Sheldon WM, Moran MA (2004) Dissolved organic fluorophores in southeastern US coastal waters: correction method for eliminating Rayleigh and Raman scattering peaks in excitation– emission matrices. Marine Chemistry 89(1-4): 15-36.
- Ohno T (2002) Fluorescence inner-filtering correction for determining the humification index of dissolved organic matter. Environ Sci Technol 36(4): 742-746.
- Bro R (1998) Multi-way analysis in the food industry. Ph.D. dissertation, University of Amsterdam.
- Stedmon CA, Markager S, Bro R (2003) Tracing dissolved organic matter in aquatic environments using a new approach to fluorescence spectroscopy. Marine Chemistry 82(3-4): 239-254.
- Murphy KR, Stedmon CA, Graeber D, Bro R (2013) Fluorescence spectroscopy and multi-way techniques. PARAFAC. Analytical Methods 5(23): 6557.
- Odjadjare EE, Okoh AI (2010) Physicochemical quality of an urban municipal wastewater effluent and its impact on the receiving environment. Environmental monitoring and assessment 170(1-4): 383-394.
- McLaskey AK, Keister JE, Schoo KL, Olson MB, Love BA (2019) Direct and indirect effects of elevated CO2 are revealed through shifts in phytoplankton, copepod development, and fatty acid accumulation. PloS one 14(3): e0213931.
- Kohlbach D, Graeve M, Lange BA, David C, Schaafsma F L, et al. (2018) Dependency of Antarctic zooplankton species on ice algae-produced carbon suggests a sea ice-driven pelagic ecosystem during winter. Global change biology 24(10): 4667-4681.
- Cripps G, Flynn KJ, Lindeque PK (2016) Ocean Acidification Affects the Phyto-Zoo Plankton Trophic Transfer Efficiency. PloS one 11(4): e0151739.
- Wang W, Johnson CG, Takeda K. Zafiriou O C (2009) Measuring the photochemical production of carbon dioxide from marine dissolved organic matter by pool isotope exchange. Environmental Science and Technology 43: 8604-8609.
- Tolar BB, Ross MJ, Wallsgrove NJ, Liu Q, Aluwihare L I, et al. (2016) Contribution of ammonia oxidation to chemoautotrophy in Antarctic coastal waters. ISME J 10(11): 2605-2619.
- Findlay AJ, Bennett AJ, Hanson TE, Luther GW (2015) Light-dependent sulfide oxidation in the anoxic zone of the Chesapeake Bay can be explained by small populations of phototrophic bacteria. Applied and environmental microbiology 81(21): 7560-7569.
- Wang J, Wang K, Guo Y, Niu J (2020) Photochemical degradation of nebivolol in different natural organic matter solutions under simulated sunlight irradiation: Kinetics, mechanism and degradation pathway. Water research 173: 115524.
- Gornik T, Vozic A, Heath E, Trontelj J, Roskar R, et al. (2020) Determination and photodegradation of sertraline residues in aqueous environment. Environmental pollution 256 : 113431.
- Sun P, Lee WN, Zhang R, Huang CH (2016) Degradation of DEET and Caffeine under UV/Chlorine and Simulated Sunlight/Chlorine Conditions. Environmental science and technology 50(24): 13265-13273.
- Margulies L, Rosen H, Stern T, Rytwo G, Rubin B, et al. (1993) Photostabilization of pesticides by clays and chromo- phores. Arch Insect Biochem Physiol 22: 467-486.
- El-Nahhal Y, Nir S, Margulies L, Rubin B (1999) Reduction of photodegradation and volatilization of herbicides in organo-clay formulations. Applied Clay Science 14(1-3): 105-119.
- Wiatrowska K, Komisarek J (2019) Role of the light fraction of soil organic matter in trace elements binding. PloS one 14(5): e0217077.
- Cai MH, Wu YP, Ji WX, Han YZ, Li Y, et al. (2020) Characterizing property and treatability of dissolved effluent organic matter using size exclusion chromatography with an array of absorbance, fluorescence, organic nitrogen and organic carbon detectors. Chemosphere 243: 125321.
- Ishii SK, Boyer TH (2012) Behavior of reoccurring PARAFAC components in fluorescent dissolved organic matter in natural and engineered systems: a critical review. Environmental science & technology 46(4): 2006-2017.
- Stedmon CA, Bro R (2008) Characterizing dissolved organic matter fluorescence with parallel factor analysis: a tutorial. Limnology and Oceanography Methods ASLO 6(11): 572-579.


