


An Alternative Modeling Approach to Stock Assessment of Central Philippine Waters
Arlene L Avillanosa1* and Rex B Baleña2
1Western Philippines University-Puerto Princesa Campus, Philippines
2University of the Philippines in the Visayas, Philippines
Submission:April 22, 2021; Published:June 02, 2021
*Correspondence author: Arlene L Avillanosa, Western Philippines University-Puerto Princesa Campus, Puerto Princesa City 5300, Philippines
How to cite this article: Avillanosa AL and Baleña RB. An Alternative Modeling Approach to Stock Assessment of Central Philippine Waters. Oceanogr Fish Open Access J. 2021; 13(5): 555871. DOI: 10.19080/OFOAJ.2021.13.555871
Abstract
This study initiates a significant application of a spatially and temporally integrated management tool for fishery stock assessment. The Mass Conservation Model (MCM), a simple model formulated with the capability to generate new indices of biomass analysis solely from catch data, was used to analyze abundance, composition, and movement of stock in central Philippine waters. MCM demonstrates that, given only sufficient spatial and temporal catch data, indications of biomass movements, abundance, and stock composition can be obtained. However, because the model uses only the catch data, the analysis is dependent on reliable sampling and the accuracy of the input data. Therefore, it is recommended that agency personnel tasked to collect, process, and analyze catch data including their enumerators must train properly in scientific methods and the marine sciences.
Keywords:Abundance; Biomass; Catch Data; Mass Conservation Model; Stock Assessment
Introduction
Stock assessment in the broadest sense is carried out to provide management advice. It seeks to identify the stock present, estimate potential yields, and recommend strategies for approaching these yields [1]. Resource assessment of fish stock includes generally the collection, processing, and analysis of available data using familiar tools and models. In order to produce meaningful results from the stock assessment, reliable and completely integrated data must be a requisite [2]. Bias in sampling is inevitable, for one, due to the migratory behavior of the stock, such that a suitably large sea area must be used in obtaining random samples from the stock population [3]. Furthermore, there is a need for adequate sampling of broad areas in order to detect overall stock variations. Hence, survey areas should be large enough to observe variations of distributions of stocks [4].
The latest occasion when modelers of the world convened to discuss the 3 status of fishery stock assessment models was in 1997 at Anchorage, Alaska [5]. Feedback and interactions amongst modelers were documented essentially by in his article discussing the present (deplorable) paradigm and the need for a shift to alternative strategies [6]. The MCM simulation model used in this study [2], incidentally, has concurrent agreements with the observations and recommendations of the model used in the present analysis of the Philippine catch data is in itself an inflexible simulation form and can be made to produce results as a function of space simultaneously with time [6]. The model, while simple, introduces new robust dynamics, provides, or determines errors that other models are not able to do, and has the simplest processing and implementation requirements. It is completely automated by simple software. In general, this study initiates a significant application of a spatially (areal distribution) and temporally (time-series data) integrated management, at least in the Philippines.
Materials and Methods
Data Source, Management, Processing and Analysis
Initially, BFAR’s 10-year municipal and commercial catch data for Central Philippine waters (Figure 1) that satisfied the Mass Conservation Model (MCM) requirements were negotiated from the Bureau of Agricultural Statistics. At some cost, BAS provided the dataset used for the analysis, as BFAR is responsible for the collection, processing, and compilation of the original data as published in the annual Fisheries Statistics of the Philippines. However, since the municipal catch was not reported in the same format as the commercial catch, BAS personnel were responsible for converting the municipal data into the commercial format. The 10-year dataset recorded landings in 12 statistical fishing areas (Figure 1), the boundaries of which were determined by BFAR was adopted in this study only for consistency and continuity.


In order to proceed with the analysis, the data from BAS was standardized into kg.km-2 so that production per fishing ground was free of bias. Secondly, modes of the datasets were decomposed separately using the model to remove the remaining inconsistencies. The procedure is summarized in Figure 2. Thirdly, the analysis proceeded by tracing the presence of biomass fluxes in the study area. Given only sufficient spatial and temporal catch data, these fluxes were related to biomass movements, abundance, and stock composition. Lastly, the study attempted at assessing the BFAR methodology.
The Model
MCM is a simple statement of the balance of biomass fluxes:
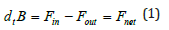
Where,
 = temporal change of biomass B
F = flux of biomass in to or out of the same volume
In this study, the Central Philippine waters served as the domain. Its area was gridded, and the processed data decimated proportionately over the respective fishing grounds (Figure 3). Optimal interpolation [7] was then performed to provide a transition between data-rich and data-void regions. This artificial procedure was necessary to avoid discontinuity problems in calculating derivatives. Finally, divergence was computed directly through simple cell wise temporal differentiation. Computing for divergence was the critical stage of the analysis. Its contours would reveal biomass redistribution showing biomass “sinks” and “sources” (Figure 4). Consequently, the potential was traced by equation (1):

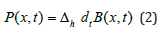
Δh where: = horizontal gradient operator
 = divergence
Biomass B was actually the only observable data because the side fluxes were difficult, if not possible, to observe. However, with this information alone for several regions, it was possible to determine the spatial relation of the fluxes. For instance, at a certain period when the catch was high in an area, there was a greater tendency for the biomass to move towards that biomass deficit area following the law of the conservation of mass. “Sources” and “sinks” of biomass fluxes were revealed as well as the pathways. The outputs of MCM were the gross error estimates of the Philippine catch data as a function of space and time and indications of abundance, composition, and movement of stock in terms of biomass exchanges in the area. This would be true even for multi-species cases. The results helped to establish the usefulness of existing Philippine data. MCM had inherent procedural advantages leading to quality data. For instance, [2] enumerated the positive features of the model to include a) control of data errors, b) reduction of uncertainties caused by multi-parameterization, c) economy of computation, d) simplicity, and e) robust interpretation.

Results and Discussion
The modal decomposition was able to segregate the catch data into quality catch data and error estimates (Figure 5) (MCM computes errors as functions of space and time, something that other models are not able to do) Errors in the original dataset turned out to be relatively small compared with average values of 5.5 and 159 5.8 x 10³ kg. km-2 for commercial and municipal catches, respectively. The overall mean error ranged between 1.7 x 10⁻⁴ and 3.3 x 10⁻³ kg.km-2 (Figure 6). There is currently a popular interest in the need to describe population dynamics considering both space and time, i.e., the essentials for what may be termed as the dawn of modern stock assessment [2,8,9].


In particular, the present study used a simulation model depicting biomass divergence due to catch and how divergence influences the redistribution of biomass in the aquatic environment [2]. The model uses modal decomposition to control the quality of input data, and errors are computed as a function of space and time. This spatially integrated modeling approach, with its built-in time dynamics, is beginning to be the more acceptable tool in stock assessment. For instance, the ECOPATH [10,11] had been improved by incorporating time dynamics in ECOSIM and spatial functions in the case of ECOSPACE [9,12,13]. Particularly, because MCM was built with the aim of formulating a spatio-temporal integrated management blueprint for the Philippines, the model is exceptionally useful.
Fishery data from waters shown in Figure 1, at the same time, can be used to evaluate MCM, and the resulting analyses, in turn, can be considered as an alternative to existing stock assessment models addressing national fishery problems. The strength of the present method includes its capacity to extract errors from catch data for improved results and inferences for stock assessment purposes: Granting a proper collection of data, the analysis leads to the determination of potential biomass redistribution in a water body. MCM is quite a simple model requiring only catch statistics as input data, and it is devoid of many parameters used by other stock assessment models. However, a critical reminder to improve on the results and inferences: Very important to assessment is the proper collection of data using appropriate sampling schemes. MCM has no control over this.
One great concern in Philippine stock assessment and the consequent management is dependence on foreign models, which are used in a different context and formulated only for single species. In particular, alleviating the species problem is evident in the continued revisions of existing models like the FiSAT [14,15], one known ubiquitous model in Philippine’s assessment studies [8,16-18]. MCM appears as one viable alternative tool because the model has the further capacity to extend to multispecies and multilayer/depth analyses [2]. In addition, one may appreciate that the model can detect the direction of flow, origin, and fate of biomass–given only sample data coverage (on spatial and temporal scales). Most of all, the methodology of this study end for the detection of biomass exchanges. Movements of commercial and municipal fisheries stocks in central Philippine waters were traced by the possible exchanges (pathways) in the area. The terms used in the mass balances are the biomass “sinks” for divergence and “sources” for convergence (recall Figure 4).
Identifying the highly fished-areas or divergence was very important in understanding population dynamics. Moreover, in water, common boundaries are shared because the aquatic environment is as continuous as dynamic. Thus, biomass exchanges must occur in the ocean as dictated by the Law of Conservation of Mass. This is a natural process in the water column modified only by human intervention (i.e., fishing). Precisely, this modification is represented by the recorded catch. The catch is equivalent to surface divergence (or simply, divergence, recall Figure 4). Specifically, divergence implies an increased tendency for biomass influx, some unidentified biomass influxes that must be coming in from somewhere to sustain increasing catch. The influxes that replenish the out fluxes are the subsurface convergence. Therefore, while divergence implies increased catch, conversely, convergence implies decreased catch. Divergence and convergence are significant features because they act as dynamic centers of biomass redistribution [2]. They sum up the distribution dynamics for the present study (Figure 7).
This study is further interesting because it addresses the controversy fishery statistics, which, if available at all, often prove unreliable to the extent of being completely useless. The biggest irony is that, based on these data, and lacking sufficient physical basis, many scientists indicate that traditional fishing grounds are over-exploited [19]. The validity of their claims should, instead, be based on the status of the bodies of water under consideration. The prime significance of good stock assessment cannot be undermined. The Philippines lies at approximately 4o-227 22oN latitudes and 112o-127o E longitudes, well within the tropical Indo-west Pacific. The entire region is considered as a center of tropical marine biodiversity.
Several authors all agree that statistical information must be available to evaluate the situation of the resources, as background information in formulating fishery policies and any rational management [2,9,17,20]. However, only insisted that the biggest drawback to the management and proper utilization of fishery resources in the Philippines is still the lack of appropriate biological information [17]. Another reason for failure in stock assessment is blamed on inadequate data on stock-specific biological parameters in the Philippines [18]. On the other hand, suggests that problems related to data handling and extrapolation of model capabilities should be more of the bottom-line national issue [2].
The vast marine resources indicate that fishery is a major economic sector in the country. Fish and fishery products are a common component of the Filipino diet. Fisheries also provide some employment to coastal people and serve as a dollar source because of export potential. According to [9], tropical fisheries are often most badly managed. More recently, diverse gears and even the social conditions (the consequence of poor management) are suspected as additional constraints to resources assessments and fisheries management. However, it is quite clear that the dynamical basis of the fisheries is treated only crudely while biology is over-emphasized. Meantime, it is encouraging that the conceptual contribution by a mass continuity model is available for dynamical analysis. Needless to say, because fishery resources are dynamic, resource management schemes must employ the appropriate dynamics in the assessment. Thus, assuming reliable catch statistics, commercial and municipal fishermen may have a dominant mode of divergence (catch) around Sulu Sea (recall Figure 7).

The extent of divergence is higher for commercial fisheries. Relatively, there is a high fishing effort by commercial fishermen around Sulu Seas including Cuyo Pass [21]. These areas are found biomass “sinks.” Generally, areas of divergence for both commercial and municipal fisheries occurred at certain fishing grounds during 1978-1987. Plots of divergence (from space function) show the existence of biomass exchanges, with some areas acting as biomass “sources” and others as biomass “sinks” (Figure 8). High exploitation occurred where the “sinks” are and the areas from which these influxes should come are the “sources.” Tracing the movement or possible “migration” of biomass such as fish is a valuable outcome from these plots (recall Figure 7).
Conclusion
In sum, the very salient findings of the analysis were through modal decomposition, approximate errors in the catch data reported by BFAR were determined as a function of space (by fishing ground) and time (yearly). However, results were valid only for the data-rich portions of the study area. An inadequate sampling of the water column, scarcity, and inaccuracy of reported catch limited the meaningful interpretation of the analysis. The overall analysis error was insignificant compared to the averaged production of central Philippine waters. The time functions of the total catch variation revealed that the pattern for commercial and municipal catches was similar. A general tendency was for the fishing grounds to cluster based on commercial and municipal catches. Peak production in 1982 was influenced by the combined production of all the species groups, implying multi fisheries and high biodiversity interactions of central Philippine waters. There were important detailed results pertaining to divergence relative to the species and regions. Horizontal fluxes referring to biomass “sinks” or “sources” were inferred through analyses of the catch composition data. The direction of a movement was towards the “sinks,” meaning that biomass was moving from an area of high concentration to lower concentration.

References
- Larkin P (1982) Directions for future research in tropical multispecies fisheries. In: D Pauly and G I Murphy (eds.) Theory and management of tropical fisheries. International Center for Living Aquatic Resources Management, manila, Philippines, and Division of Fisheries Research, Commonwealth Scientific and Industrial Research Organization, ICLARM Conference Proceedings, Cronulla, Australia, Pp. 309-328.
- Baleña R (1998) Development of a Simple Biomass Analysis Model. In: F Funk, T Quinn II, J Heifetz, J Ianelli, J Powers, et al. (eds) Fishery Stock Assessment Models, Alaska Sea Grant College Report No. AK-SG-98-01, University of Alaska Fairbanks, Pp. 1037.
- Sparre P, E Ursin and S Venema (1989) Introduction to tropical fish stock assessment. Part I-Manual. FAO Fish Technical Paper, Rome, Italy, Pp. 407.
- National Research Council (NRC) (1998) Improving Fish Stock Assessments. Committee on Fish Stock Assessment Methods. National Academy Press. Washington, DC, Pp. 177.
- Funk F, Quinn T, Heifetz J, Ianelli J, Powers J, et al. (1998) Alaska Sea Grant College Report No. AK-SG-98-01, University of Alaska Fairbanks. 1037.
- Sainsbury K (1998) Living Marine Resource Assessment for the 21st Century: What Will Be Needed and How Will It Be Provided? In: F Funk, T Quinn II, J Heifetz, J Ianelli, J Powers, et al. (eds) Fishery Stock Assessment Models, Alaska Sea Grant College Report No. AK-SG-346 98-01, University of Alaska Fairbanks. Pp. 1037.
- Barnes S (1964) A technique for maximizing details in a numerical weather map analysis Journal of Applied Meteorology 3(4): 396-409.
- Maury O, D Gascuel (1999) SHADYS (‘simulateur halieutique de dynamiques spatiales’), a GIS based numerical model of fisheries. Example application: the study of a marine protected area. Aquatic Living Resources 12(2): 77-88.
- Pauly D (1989) A selection of simple methods for the assessment of tropical fish stocks. FAO Fish Circle 729: 54.
- Polovina J, M Ow (1983) ECOPATH: a user’s manual and program listing. National Marine Fisheries Service, NOAA, Honolulu, Hawaii, USA, Pp. 46.
- Christensen V, D Pauly (1992) The ECOPATH II –a software for balancing steady-state ecosystem models and calculating network characteristics. Ecological Modelling 61(3-4): 169-185.
- Christensen V (1998) Fishery-induced changes I marine ecosystem: insight from models of the Gulf of Thailand. Journal of Fish Biology 53(A): 128-142.
- Walters C, D Pauly, V Christensen (1998) Ecospace: prediction of mesoscale spatial patterns in trophic relationships of exploited ecosystems, with emphasis on the impacts of marine protected areas. Ecosystems 2: 539-554.
- Gayanilo F, D Pauly (1997) FAO/ICLARM stock assessment tools (FiSAT). FAO Computerized Information Series Fisheries 8.
- Gayanilo F, P Sparre, D Pauly (2002) FiSAT II. User’s guide. FAO (Food and Agricultural Organization of the United Nations), Rome.
- Ingles J, D Pauly (1984) An atlas of the growth, mortality and recruitment of the Philippines fishes. ICLARM Technical Reports 13: 127.
- Silvestre G, D Pauly (1996) Status and management of tropical coastal fisheries in Asia. ICLARM Conference Proceedings Pp. 208.
- Lavapie Gonzales F, S Ganaden, F Gayanilo (1997) Some population parameters of commercially-important fishes in the Philippines. Bureau of Fisheries and Aquatic Resources 114.
- Samson E (1983) National Marine Interests in Fisheries in Southeast Asia. Quezon City: Fisheries Development Council FIDC Technical Report Series 2: 15-19.
- Ingles J (1993) Resource and Ecological Assessment of Ormoc Bay. Institute of Marine Fisheries and Oceanology, University of the Philippines in the Visayas, Miagao, Iloilo. Pp 90.
- Calvelo R, P Dalzell (1987) A review of the recent status of exploited stocks of round scads in the Philippines. In: Papers presented at the symposium on the exploitation and management of marine fishery resources in Southeast Asia held in conjunction with the twenty-second session of the Indo-Pacific Fishery Commission, Darwin, Australia, Pp 257-268.


