Turbulence and Mixing in Energetic Environment of the Coastal Waters of Sri Lanka
SUP Jinadasa1* and HJS Fernando2
1Department of Oceanography, The Ocean University of Sri Lanka, Sri Lanka
2Department of Civil and Environmental Engineering and Earth Sciences, University of Notre Dame, USA
Submission:January 04, 2021;Published:February 22, 2021
*Correspondence author: S U P Jinadasa, Department of Oceanography, The Ocean University of Sri Lanka, Crow Island, Colombo 15, Sri Lanka
How to cite this article: SUP Jinadasa, HJS Fernando. Turbulence and Mixing in Energetic Environment of the Coastal Waters of Sri Lanka. Oceanogr Fish Open Access J. 2021; 13(2): 555858.10.19080/OFOAJ.2021.13.555858
Abstract
In order to obtain first insights on the ocean turbulence and mixing in the waters around Sri Lanka, the microstructure measurements in the South Monsoon Current to the south of Weligama (along 80.5°E and near the shelf break) and in the East Indian Coastal Current in the Bay of Bengal to the east of Trincomalee (along 8°N) was conducted by National Aquatic Resources Research and Development Agency (NARA) of Sri Lanka aboard the research vessel Samuddrika. It is shown that in strongly startified pycnocline, which is dynamically detached from the low-saline surface mixed layer, the probability distributions of the logarithm of the kinetic energy dissipation rate 10logε follow generalized extreme value (GEV) model. This could be associated with the occurrence of rare highly-energetic turbulent patches in the pycnocline due to intermittent breaking of internal-wave and sporadic shear-induced instabilities. The mixing Reynolds number (a nomalized eddy diffusivity) was found to be a function of the gradient Richardson number, and followed the parameterization proposed by [1].
Keywords: Bay of Bengal; Indian Ocean; Mixing; Pycnocline; Turbulence
Introduction
The Arabian Sea and Bay of Bengal (BoB) are two major basins in the northern Indian Ocean, which influenced by reversing monsoon wind [2]. Surface salinity of the BoB is greatly affected by large freshwater input due to precipitation (~2 m yr−1) [24] and large river discharges (1.625 × 10¹² m3yr−1) [3]. The Arabian Sea freshwater evaporation is ∼1 m yr−1. Such imbalance in freshwater fluxes influences thermohaline circulation in the northern Indian Ocean [4]. Large freshwater influx to the northern BoB produces a low-saline shallow mixed layer overlying highly stratified sharp thermohalocline [5]. Understanding small-scale mixing in the pycnocline is crucial for heat, mass, momentum, and biogeochemical fluxes in the Bay [6,7].
Formation of mesoscale eddies and inertial waves [8,9] in the BoB stir water in the interior of the Bay, leading to a cascade of smaller scale local instabilities. Turbulence so generated produces mixing and vertical exchange of physical properties as well as biogeochemical fluxes, influencing the BoB ecosystem and strong near surface stratification in the region restricts turbulence to a thin surface boundary layer [10]. Away from local frontal zones, turbulence in the surface low-salinity layer appears to be decoupled from the underlying pycnocline, where turbulence occurs only as rare and sporadic events [11,12]. Convergence and divergence of seasonal currents as well as their reversals during monsoon transitions produce remarkable variability of mesoscale and small-scale phenomena near the eastern and southern coastal waters of Sri Lanka [13,14].
Until recently, only a few direct measurements of small-scale turbulence and related mixing in BoB have been conducted [11,15]. As a continuation of this works, in April and September of 2014, Sri Lankan oceanographers launched first ever measurements of microstructure and associated hydrodynamic variables (temperature, salinity, stratification, currents) to the south and to the east from the Sri Lanka coast (Figure 1). The measurements were taken using research vessel R/V Samuddrika of the National Aquatic Resources Research and Development Agency (NARA) under the auspices of the Air-Sea Interactions Regional Initiative (ASIRI) [16].
Oceanographic Measurements Around Sri Lanka
A 60 miles long longitudinal transect (11 stations with Sea-Bird conductivity temperature depth (CTD) and VMP-500 microstructure profiles) were taken by R/V Samuddrika on April 23-25, 2014 along 80.5°E to the south from Weligama (WS). In addition, 14 VMP profiles were obtained during a 3 hrs drift (WD) near the Weligama shelf break. Another 60 miles latitudinal section was completed on September 9 – 12, 2014 along ~ 8°N to the east of Trincomalee (TS), covering 9 stations with Sea Bird CTD and VMP casts. In addition, ocean currents were measured using a 150 kHz acoustic Doppler current profiler (ADCP) mounted on ship hull.

The tethered VMP-500 profiler of Rockland Scientific was deployed through the rear deck A-frame down to 150 m depth with almost constant sinking velocity of 0.7 ms-1. The VMP carried two airfoil probes to estimate the turbulent kinetic energy [TKE] dissipation rate (ε ), an accelerometer, a pressure sensor, and a temperature-conductivity Sea-Bird unit to obtain precise estimates of temperature, salinity, and potential density. Data above first 5 m of the water column were discarded due to potential ship-wake contamination. Data processing followed the methodology of [17].
The TKE dissipation rateε was calculated by fitting empirical
small-scale shear spectra to a Nasmyth benchmark spectrum at
consecutive two-second segments (1024 points). As a result,
vertical profiles of ε (z)were obtained with a vertical resolution
of ~1.4 m. The same spacing was adopted for temperature T (z)
, salinity S(z) , densityρ (z) , and buoyancy frequency N(z) profiles.
Here  is the squared buoyancy frequency and the corresponding variables are vertical coordinate z
(positive downward), potential θ ρ and reference 0 ρ
density, and the gravity, g. The squared mean shear Sh2 = (Δu / Δz)2 + (Δv / Δz)2
, where u and v are zonal and meridional components of mean
currents, and the gradient Richardson number Ri = N2 / Sh2.
Results and Discussion
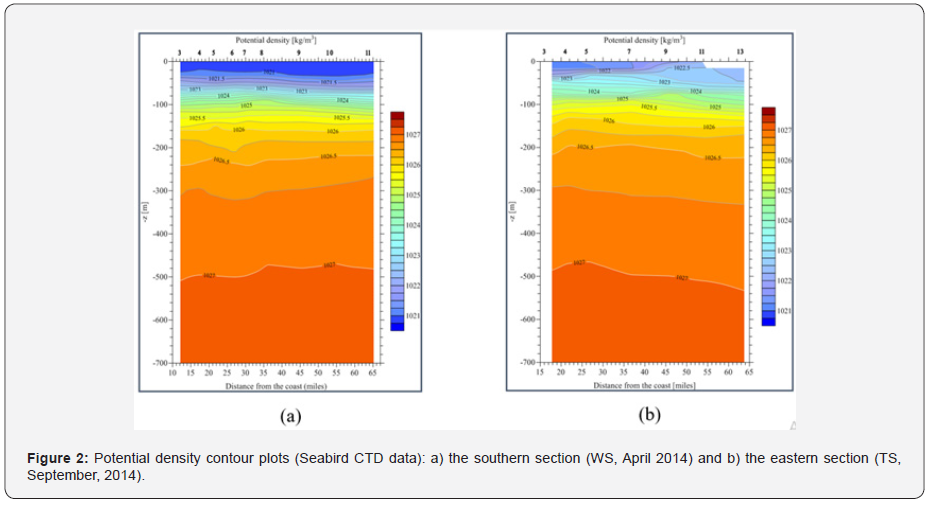
Stratification to the south and to the east from Sri Lanka During the inter-monsoon season (April 2014), the mixed layer depth (MLD) along the Weligama section did not change much, varying between approximately 20 and 30 m (Figure 2). Surface mixed layer was underlined by strong narrow density jump and then density gradually increases with depth in the main pycnocline below z ~150 m. Interestingly to noticed that the turbulence measurements carried out in early February of 2014 at WS, only one station of near the shelf break, showed that the MLD was ~ 60 m, indicating the possibility of substantial convective cooling and/ or strong wind mixing in the upper layer south of Sri Lanka during the winter monsoon.
In September 2014, at the end of the southern monsoon season, stratification in the upper 150 m along the Trincomalee section (TS) was much more complex compared to that observed along Weligama (WS) in April. The density structure in Figure 2b exhibits a sharp pycnocline in the depth range z = 30 - 40 m not far from the shelf break. About 50 miles offshore, however, the pycnocline upwelled towards the sea surface, forming a striking baroclinic (density) front that separates diluted BoB surface water, which is moving southward along the Sri Lanka coast, from warm, saltier water at the eastern end of the transect [16]. The latter represents the Arabian Sea water moving north/northeastward as the southwest monsoon current [18]. The shipboard ADCP measurements support this concept [8].
The Dissipation Rate Statistics
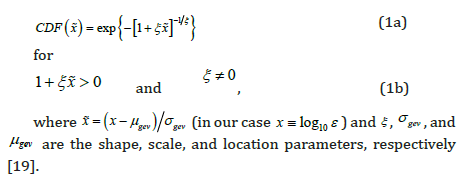
It has been suggested [19] that the probability distribution of the logarithm of the TKE dissipation rate 10 log ε in stably stratified pycnocline may follow generalized extreme value distribution [20] due to rare appearance of energetic turbulence events. Accordingly, a small number of patches with high level of TKE dissipation rate exist, while most of the background turbulence is weakly dissipative or consists of smaller patches in their final stages of life. The cumulative distribution functions (CDF) of the generalized extreme value (GEVD) model are expressed as Eq. 1a.
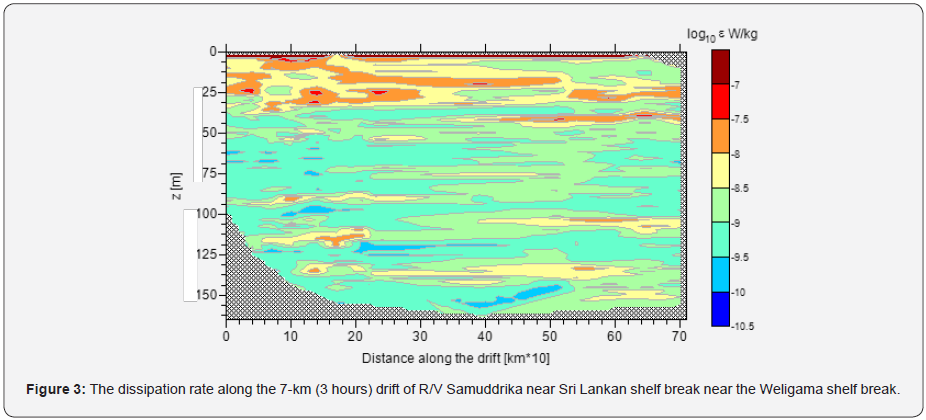
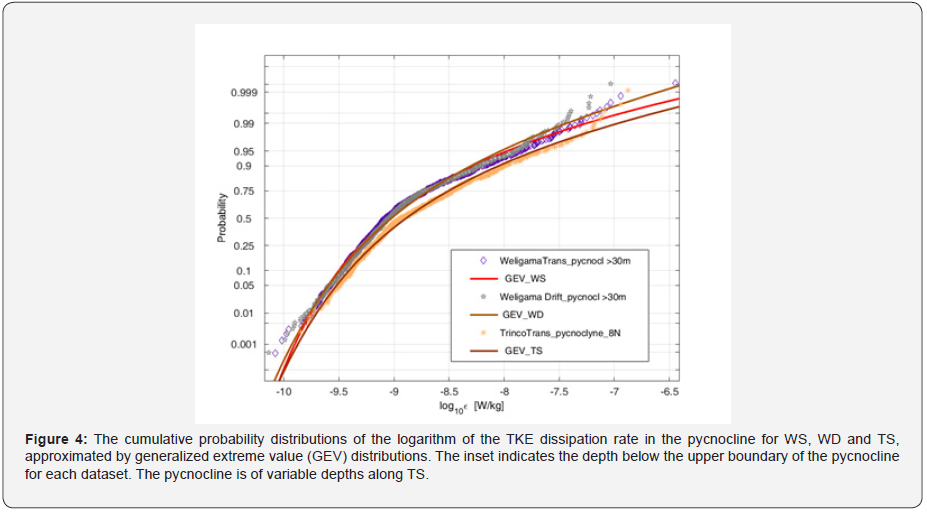
We calculated CDF (ε ) for the dissipation rate data along WS and TS shown in Figs. 4 a, b of [11] along a mini transect WD of 14 drift stations. The dissipation rate at the WD is shown in Figure 3. The empirical cumulative distribution functions CDF (ε ) are shown in Figure 4 separately for the southern (WS) and eastern (TS) transects and for drift measurement (WD). The GEVD approximates all three empirical distributions well. The scale ~ (0.28 – 0.43)and locationμ ~ −(9.1 – 9.6)parameters are quite similar for all regions, while the shape parameter ξ can be positive or negative ~ ±0.07. For ξ close to zero, the probability distribution function is almost symmetric, and it is highly skewed towards small values of x , if ξ is negative (e.g., see WS).
The empirical distributions of 10 log ε shown in Figure 4 were also compared with a more traditional normal model using the Akaike Information Criterion AIC [21]. It appears that for all analyzed distributions, the AIC is higher for the GEVD model than for the normal model. The difference between the AIC values is statically significant. On the contrary to the observations of pycnocline turbulence, the probability distribution functions 10 log ε for the very weakly stratified, almost homogeneous, upper layer (the depth range between MLD and z = 10 m) generally follow the normal distribution (not shown here for brevity). Log-normal distribution for the TKE dissipation rate has been formulated by [22] for homogeneous locally isotropic turbulence and has been well supported by numerous experimental data [19,23,24] whereas 10 log ε in marine and lacustrine quasi-homogeneous boundary layers often follow the normal distribution.
From the probabilistic point of view, the generation/ dissipation of intermittent intense energetic turbulence in the strongly startified pycnocline can be considered as a random sequence of rare events. The sources of such turbulence are most probably associated with non-stationary, intermittent internal wave breaking and sporadic shear-induced instabilities [6]. In weakly stratified regions, sub-mesoscale intermittency of the TKE dissipation rate follows more traditional log-normal distribution [23,25].
Eddy Diffusivity vs The Richardson Number
Jinadasa et al. [11] suggested that shear-induced turbulence is a major possible source of diapycnal mixing in monsoon driven currents around Sri Lanka, and if so, the gradient Richardson number is a salient parameter that determines the eddy diffusivity. To verify this hypothesis, we analyzed the dependence of turbulent diffusivity, 0.2 2 N K = ε N on the gradient Richardson number as in many previous publications [26-30]. We used 14 VMP profiles collected during the 3 hr (7 km) drift of R/V Samuddrika along the Weligama shelf break. The dissipation field along this drift is shown in Figure 3 and appears to be typical of stratification in waters all around Sri Lanka away from the frontal zones as reported by [11].
The estimated normalized turbulent diffusivity or the mixing Reynolds number mx N T R = K ν , where 0 2 2 N K = . ε N and T ν are the eddy and turbulent diffusivities, respectively, is shown in Figure 5 as a function of the gradient Richardson number (Ri) . The binaveraged (5 points per bin) samples of both variables were found to minimize scatter. Although the scatter of bin-averaged samples in Figure 5 is still relatively high (the coefficient of determination of the approximation (1) r2 = 0.66 is less than 0.8), the general decreasing trend of mx R with growing Ri is evident. The dashed line in Figure 5 approximates KN (Ri) f by formula used by [23].

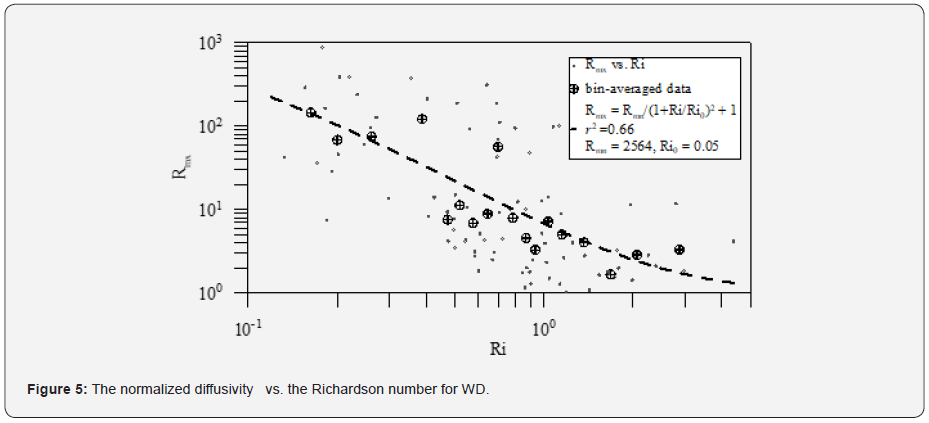
where turbulence in neutrally stratified flow is specified by the constant mn R = 2564 (the corresponding diffusivity ~ 5.1 10 -4 m2 / NK s − × ), Ri0 = 0.05 and 1 mb R = corresponds to background molecular mixing. The values of 0 Ri and s = 2 are used for fitting based on [23], although the latter authors analyzed atmospheric stably stratified turbulence. The agreement indicates the robustness of (2) for mixing in strongly stratified natural shear flows, and that thermocline mixing around Sri Lanka indeed can be caused by shear instability [31-33].
Conclusion
It is found that statistics of the kinetic energy dissipation rate in the oceanic pycnocline around Sri Lanka (TS and WS transects) can be well defined by generalized extreme value distribution (GEVD), which approximates the empirical cumulative distribution functions of the logarithm of the TKE dissipation rate 10 log ε , supporting findings of [19] in the east China Sea In weakly stratified almost homogeneous surface layer (in our case, the depth range between the MLD and z = 10 m), the probability function of 10 log ε generally follows traditional [22] normal distribution. From the probabilistic point of view, the generation/ dissipation of intense energetic turbulence in strongly startified pycnocline, which is largely detached from the surface layer of low salinity waters all the way around Sri Lanka, can be considered as randomly occuring rare events.
The sources of such turbulence most probably is associated with non-stationary, shear-induced instabilities induced by vertical shear (e.g., internal wave shear). Based on the measurements taken near the Weligama shelf break, we found that turbulent diffusivity (or mixing Reynolds numebr Remx ) in the pycnocline is a function of the gradient Richardson number Ri (Eq. 2) with fitting parameters consistent with those proposed by [1]. This suggests the robustness of the parameterization as well as the dominance of shear-induced mixing in the thermocline along the trasects analyzed in this study.
Acknowlegement
Authors wish to grateful to the crew of R/V Samuddrika for assistance with the VMP measurements. Further, authors wish to extend the gratitude to the members of Oceanography Department of the National Aquatic Resources Research and Development Agency (NARA), Sri Lanka for support during the field measurements. Finally, the support for ship operation was provided by the US Office of Naval Research and Naval Research Laboratory. We acknowledge funding through ONR grants N00014-13-1-0199 and N00014- 14-1-0279.
References
- Lozovatsky ID, Fernando HJS (2013) Mixing efficiency in natural flows. Phil Trans R Soc A 371(1982).
- Kumar SP, Narvekar J, Kumar A, Shaji C, Anand P, et al. (2004) Intrusion of the Bay of Bengal water into the Arabian Sea during winter monsoon and associated chemical and biological response. Geophysical Research Letters 31(15).
- Subramanian V (1993) Sediment load of Indian rivers. Current Science 64(11/12): 928-930.
- Vinayachandran PN, Murty VSN, Babu VR (2002) Observations of barrier layer formation in the Bay of Bengal during summer monsoon. Journal of Geophysical Research: Oceans 107(C12): SRF-19-1-SRF-19-9.
- Girishkumar MS, Ravichandran M, McPhaden MJ, Rao RR (2011) Intra-seasonal variability in barrier layer thickness in the south-central Bay of Bengal. Journal of Geophysical Research 116(c3).
- Vinayachandran PN, Shankar D, Vernekar S, Sandeep KK, Amol P, et al. (2013) A summer monsoon pump to keep the Bay of Bengal salty. Geophysical Research Letters 40(9): 1777-1782.
- Akhil VP, Durand F, Lengaigne M, Vialard J, Keerthi MG, et al. (2014) A modeling study of the processes of surface salinity seasonal cycle in the Bay of Bengal. Journal of Geophysical Research 119(6): 3926-3947.
- Jinadasa SUP, Pathirana G, Ranasinghe PN, Centurioni LR, Verena H (2020) Monsoonal impact on circulation pathways in the Indian Ocean. Acta Oceanologica Sinica 39(3): 103-112.
- Lozovatsky I, Wijesekera H, Jarosz E, Lilover MJ, Pirro A, et al. (2016) A snapshot of internal waves and hydrodynamic instabilities in the southern Bay of Bengal. Journal of Geophysical Research Oceans 121: 5898-5915.
- Sarkar S, Pham HT, Ramachandran S, Nash JD, Tandon A, et al. (2016) The interplay between sub-mesoscale instabilities and turbulence in the surface layer of the Bay of Bengal. Oceanography 29(2): 146-157.
- Jinadasa SUP, Lozovatsky I, Planella-Morato J, Nash JD, MacKinnon JA, et al. (2016) Ocean Turbulence and Mixing Around Sri Lanka and in Adjacent Waters of the Northern Bay of Bengal. Oceanography 29(2): 170-179.
- Lozovatsky I, Shearman K, Pirro A, Fernando H J S (2019a) Probability Distribution of Turbulent Kinetic Energy Dissipation Rate in Stratified Turbulence: Microstructure Measurements in the Southern California Bight. Journal of Geophysical Research: Oceans 124(7): 4591-4604.
- Shetye SR, Gouveia AD, Shankar D, Shenoi SSC, Vinayachandran P, et al. (1996) Hydrography and circulation in the western Bay of Bengal during the northeast monsoon. Journal of Geophysical Research 101(C6): 14011-14025.
- Mukherjee A, Shankar D, Fernando V, Amol P, Aparna SG, et al. (2014) Observed seasonal and intra-seasonal variability of the East India Coastal Current on the Continental slope. Journal of Earth System Science 123(6): 1197-1232.
- Lozovatsky I, Pirro A, Jarosz E, Wijesekera HW, Jinadasa SUP, et al. (2019b) Turbulence at the periphery of Sri Lanka Dome, Deep-Sea Research Part II: Topical Studies in Oceanography 168: 104670.
- Wijesekera HW, Shroyer E, Tandon A, Ravichandran M, Sengupta D, et al. (2016) ASIRI: an ocean–atmosphere initiative for Bay of Bengal. Bulletin of the American Meteorological Society 97(10): 1859-1884.
- Roget E, Lozovatsky I, Sanchez X, Figueroa M (2006) Microstructure measurements in natural waters: Methodology and applications. Progress in Oceanography 70(2-4): 123-148.
- Pirro A, Fernando HJS, Wijesekera HW, Jensen TG, Centurioni LR, et al. (2020) Eddies and currents in the Bay of Bengal during summer monsoons. Deep Sea Research Part II: Topical Studies in Oceanography 172.
- Lozovatsky I, Lee JH, Fernando HJS, Kang SK, Jinadasa SUP (2015) Turbulence in the East China Sea: The summertime stratification. Journal of Geophysical Research oceans 120(3): 1856-1871.
- Kotz S, Nadarajah S (2000) Extreme value distributions: theory applications, Imperial College Press, London WC2H9HE, P. 181.
- Akaike H (1974) A new look at the statistical model identification. IEEE Transaction on Automatic Control 19(6): 716-723.
- Gurvich AS, Yaglom AM (1967) Breakdown of eddies and probability distributions for small-scale turbulence. Physics of Fluids 10: 59-65.
- Lozovatsky I, Roget E, Planella J, Fernando H J S, Liu Z (2010) Intermittency of near-bottom turbulence in tidal flow on a shallow shelf. Journal of Geophysical Research 115(C5).
- Planella J, Roget E, Lozovatsky ID (2011) Statistics of microstructure patchiness in a stratified lake. Journal of Geophysical Research 116(C10).
- Baker MA, Gibson CH (1987) Sampling turbulence in the stratified ocean: statistical consequences of strong intermittency. Journal of Physical Oceanography 17(10): 1817-1837.
- Munk W H, Anderson E R (1948) Notes on a theory of the thermocline. Journal of Marine Research 7: 276.
- Pacanowski RC, Philander SGH (1981) Parameterization of vertical mixing in numerical models of tropical oceans. Journal of Physical Oceanography 11: 1443-1451.
- Peters H, Gregg MC, Toole JM (1988) On the Parameterization of Equatorial Turbulence. Journal of Geophysical Research 93(C2): 1199-1218.
- Lozovatsky I, Roget E, Fernando HJS, Figueroa M, Shapovalov S (2006) Sheared turbulence in a weakly-stratified upper ocean. Deep-Sea Research Part I: Oceanographic Research Papers 53(2): 387-407.
- Lozovatsky I, Fernando HJS, Planella‐Morato J, Liu Z, Lee JH, et al. (2017) Probability distribution of turbulent kinetic energy dissipation rate in ocean: Observations and approximations. Journal of Geophysical Research Oceans 22(10):8293-8308.
- Prasad TG (1997) Annual and seasonal mean buoyancy fluxes for the tropical Indian Ocean. Current Science 73(8): 667-674.
- Shetye SR, Gouveia AD, Shenoi SSC, Michael GS, Sundar D, et al. (1991) The coastal current off western India during the northeast monsoon. Deep Sea Research Part A. Oceanographic Research Papers 38(12): 1517-1529.
- Thorpe S A (2007) An introduction to ocean turbulence. Cambridge University Press, Cambridge, UK, Pp. 235.


