Image Classification by Deep Neural Network of Event-Type Anomalies in The Southwestern Baltic Sea
E Y Shchekinova*
GEOMAR Helmholtz Center for Ocean Research, Germany
Submission:October 12, 2020;Published:December 03, 2020
*Correspondence author: E Y Shchekinova, GEOMAR Helmholtz Center for Ocean Research, Kiel, Germany
How to cite this article:E Y Shchekinova. Image Classification by Deep Neural Network of Event-Type Anomalies in The Southwestern Baltic Sea. 002 Oceanogr Fish Open Access J. 2020; 12(5): 555849. DOI: 10.19080/OFOAJ.2020.12.555849
Abstract
In the paper we propose a binary classification method to identify episodes of anomalies in physicochemical parameters related to mixing and exchange of water masses. For training and validation of classifier we use high resolution time series from the Boknis Eck monitoring station in the southwestern Baltic Sea. To study the role of air ocean coupling, in addition to ocean parameters, we use high resolution wind speed observations from the Kiel lighthouse weather station. The detection accuracy of anomalies relies upon training of deep neural network on image data generated from historical data interval of ocean parameters. Our data driven analysis suggests strong causality between variations in atmospheric wind and ocean physiochemistry that underlies short term ocean exchange processes in the study area.
Keywords: Mixing and Inflows in the Baltic Sea; Time series Analysis; Southwestern Baltic Sea; Image neural networks
Introduction
Within the last decade there is a significant improvement in oceanographic data accessibility as well as in parameterization of sea atmosphere models of the coupled Baltic Sea North Sea system. This progress provides a better insight into ocean exchange dynamics [1]. Despite, there are gaps in the understanding of air sea interaction processes and their various subscales in the area. While there is a continuous improvement in modelling of different scales of ocean circulation and biogeochemistry the existing models are limited to a given scenario and often are lacking a combined view on overall multi scale dynamics. There are obvious grounds for developing novel data driven methods that could provide a systemic perspective on multi-scaling behaviour without evoking intensive climate model simulations. Previous modelling studies showed that an atmosphere driven water exchange in the Baltic Sea plays a major role in changing circulation and biogeochemical variabilities [2].
Apart from seasonal trends there are variabilities of water masses in the Baltic Sea attributed to various intensity of water inflow events [3]. These events are responsible for a transport of a large amounts of more saline and well oxygenated water from the North Sea to the central Baltic and ventilation of a deep basin. Such large-scale phenomena, however, are not frequent and might not occur every year. On a shorter timescales coastal upwelling can contribute to the changing conditions, especially in shallow coastal areas of Baltic. It is demonstrated that such episodic processes drive reventilation of the bottom layers [4]. Apart from upwelling and inflow events there are other processes contributing to large changes of physicochemical parameters at multiple time scales. Atmospheric factors and ocean circulation instabilities can trigger reorganization of water masses between different local Baltic Sea basins [1,5].
Methods for analysis of such changes are still few. Here we address a question of an automated detection of an “event type” anomaly that are de_3ned as large or extreme variations across single or multiple ocean parameters. The characteristic time features of such anomalies are extracted from the Boknis Eck (BE) time series of underwater parameters. A binary classification algorithm is proposed to distinguish the BE anomalies from regular variations associated to normal seasonal conditions. The persistence of anomalous changes in ocean environment is typically accompanied by strong wind or induced by wind as seen from observations of historical Kiel lighthouse and the BE time series. Conditioned upon the observations the classifier model uses wind as one of the predictors. Since typically an exchange process is detected as large alternation across all physicochemical variables, we propose a classification scheme that couple several parameters as predictors. We use two deep convolutional neural networks (CNN) Google Net and Alex Net. Several image classification schemes are proposed that have single and multiple parameters as predictors.
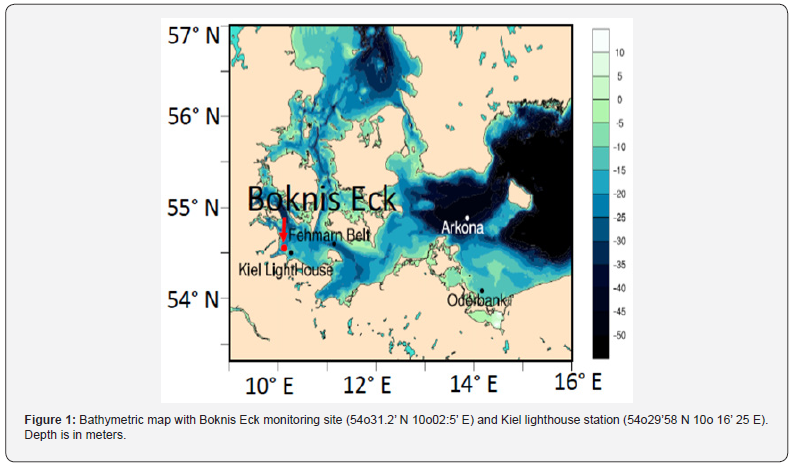
The networks are trained for image recognition to classify: (1) time frequency information of a single parameter, (2) time frequency with low frequency band information of a single parameter, (3) wavelet coherence of two parameters and (4) 2D Gaussian mixture model representations. For observational time series of underwater dissolved oxygen concentrations, salinity, and temperature their time frequency information is extracted over fixed size interval. We also use frequency filter to eliminate higher frequencies and focus on timescales from hours to days. The prediction skill is evaluated to select best performing classifier among different trained network models. According to our results both Alex Net and Google Net provide high prediction skill with 2D Gaussian mixture model for wind and a single ocean parameter (oxygen in this study) (Figure 1).
Data and Study Region
The study site is in the Boknis Eck long term monitoring station (54o31.2’ N 10o02:5’ E) situated directly at the Eckernforde Bay entry in the southwestern Baltic Sea [5,6]. The area represents a shelf with about 5 - 15 m of average sea depth. Due to shallow depth an ocean environment is momentarily influenced by any strong changes of atmospheric circulation. Being close to the confluence of the North and Baltic Sea the water physicochemical composition is affected by water masses inflows from the North Sea through the Danish Straits [5]. The transport of large volumes of a more saline water from the North Sea usually accomplished by strong forcing from westerlies. The BE biogeochemistry could be also occasionally affected by a fresher input from the land runoff.
In the study, we use high resolution historical time series of ocean physicochemical parameters including dissolved oxygen concentration, temperature, and salinity. The data are measured at 14:5 m depth and we chose the period of July November 2018 that is a continuous data set with only a few intervals of missing data points. Apart from ocean parameters we also use observations of wind at 34 m above the sea level (frequency 1 hour) from the Kiel lighthouse weather station (54_29058 N 10_16025 E). Data are standardized with maximum value and interpolated to a common sampling rate fs = 266 s..
Results
Classification Workflow
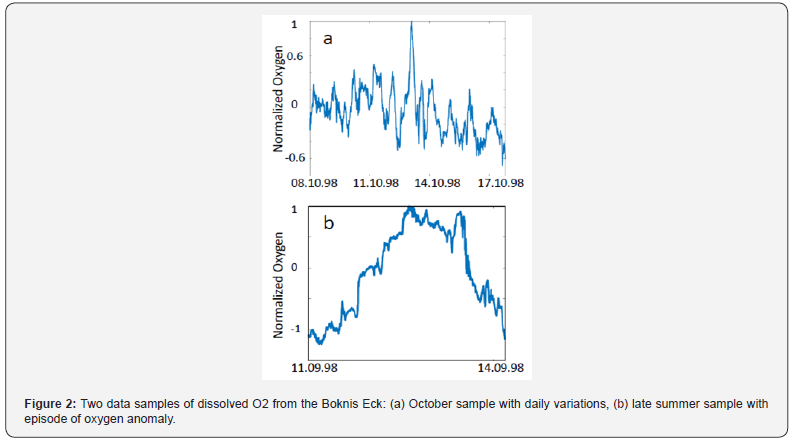
To design a classification algorithm, we use a data driven approach and identify time intervals with anomalous “event type” variations. An example of different type of variations in oxygen time series in Figure 2 shows autumn and late summer observations of several days. For the October interval oxygen concentrations oscillate close to diurnal scale with decreasing frequency (Figure 2a). For the august interval, an “event type” anomaly in oxygen concentrations is developed over 3 days period (Figure 2b). To reach a high order accuracy in classification a model is constructed to distinguish between the types of variabilities in Figure 2. Since an “event type” variation (Figure 2b) has a different timescale from the first type of variation (Figure 2a) a classification is constructed by applying time{frequency windowing and converting the time series to a sequence of time frequency images.
This procedure allows reduction to a specific frequency detection. Besides that, a low frequency band could be selected while higher frequencies could be eliminated from consideration. The low frequency band representation of data is used for the second classification scheme. The third classification scheme is designed by applying wavelet coherence and extracting frequency coherence between two parameters [7]. The wavelet coherence for two parameter oxygen and temperature. The fourth classification model uses finite differencing of wind and oxygen data to reduce seasonal trends and large variations. Time series of wind and oxygen variations are normalized and for every time window the resulting data distribution is approximated with 2D gaussian mixture model.
For training the image classification model we adapt the network architecture of the deep CNN models: Google Net and Alex Net [8]. We use Deep Learning Toolbox in Mat lab and supporting packages to run the training on a CPU. The models were pretrained to solve conceptually similar image representations tasks. To adapt the network architecture four layers in the layer graph are replaced: dropout layer (60%), fully connected layer, soft max layer, and classification output layer. The networks are adopted to specific image size: 224_224_3. The following choice of network hyperparameters is used: size of mini batch= 15, maximum number of epochs= 20 and stochastic gradient descent with momentum as an optimization model.
The classification workflow proceeds in several steps: (1) original time series is splitted into a set of N subsequent non overlapping time windows Sn = sni ,....,snk, n=1,.....,Nof a fixed time Δt = tk− ti , (2) for every sequence Sn the features are extracted using one of the above representations; (3) data representations for every interval are converted to images and (4) a set of images with assigned labels yn are prepared as inputs and outputs for CNN model training. The size of interval Δt is chosen from one side not to exceed the timescale of a typical event and from another side sufficiently large to avoid time frequency underfitting (Grinsted et al., 2004). In this study Δt is chosen in range from hours to several days. As a target sequence for network training we use a binary categorical variable n y with true value for probability Pn> 50% and false value otherwise. Here Pn is the probability of an “event type” episode. The true yn = 1 is selected therefore when an event happens and false yn = 0 otherwise.
Probability scores
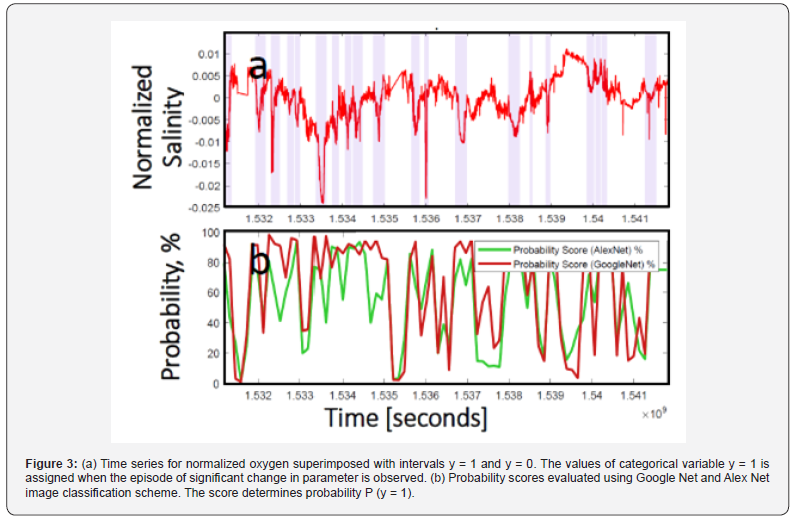
The network models are trained using the first half of time series, the second half is used for model validation. Probability scores (Figure 3b) for condition true (yn = 1) from the Google Net and Alex Net trained models reflect quite well categorical variable assignment for the same data set of salinity (Figure 3a). The probability scores are evaluated using models with input images converted from time frequency representations of data.
Prediction skill
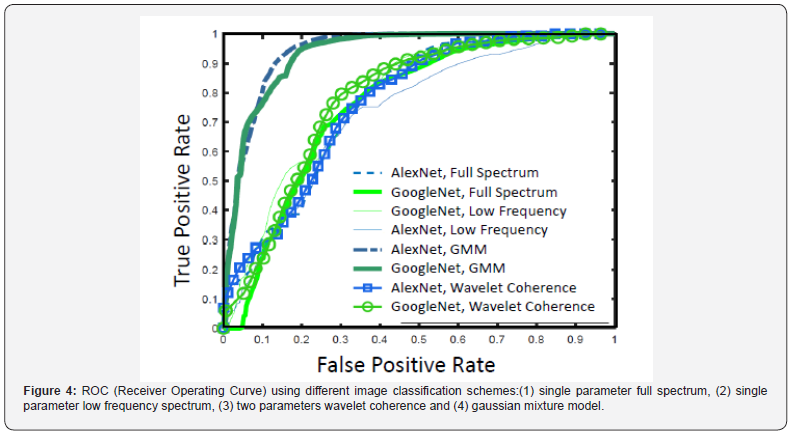
To select a best performing classification among the proposed schemes we evaluate a Receiver Operating Curve (ROC). A ROC curve is used as a diagnostic in a binary classification for estimating the quality of prediction and comparing the rate of correctly predicted conditions, also known as true positive rate, to the rate of missing a correct prediction of a condition, known as false positive rate [9,10]. The ROC diagnostic uses probability scores from the Google Net and Alex Net models (as defined in previous section) trained on four classification schemes. The random classifier corresponds to diagonal and the perfect classifier to the top left corner on the ROC diagram. From probability scores the predicted label Zn is evaluated according to the rule:

True positive (TPR) and false positive rates (FPR) are evaluated as follows:
TPR = TP/ (TP + FN) (2)
FPR = FP/ (FP + TN) (3)
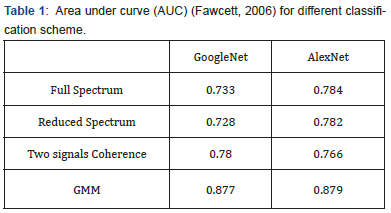
where TP; FN; FP and TN are number of true positive, false negative, false positive and true negative outcomes of contingency table for actual category Yn and predicted Zn value. According to the ROC diagnostic (Figure 4) and calculated area under curve (AUC) (Table 1) the best choice for classification scheme is the classifier trained on Gaussian mixture model representation using wind and one of ocean parameters (oxygen here). Other proposed models are capable of distinguishing with higher accuracy (AUC> 0:7) than a random classifier.
Discussion
As more ocean data and finer scale models become available there is a need of a more systemic view on short term underwater exchange processes in the Baltic Sea [1,4]. There is an increasing effort put into understanding of main ocean and atmospheric drivers that play role in generation of ocean parameters anomalies at different timescales [3]. In this study we focus on detection of short-term ocean exchange events that are frequently observed in a shallow southwestern Baltic Sea. The events are associated to the exchange of different quality of water masses that last over timescale of days. They occur mostly during late summer and autumn period with the frequency of ~16 events per year according to the BE observations for the year 2018. During an exchange episode a warmer, fresher, and more oxygenized ocean conditions over timescales of few days are observed. We propose to have a simplified view on complex dynamics describing ocean exchange processes. For this purpose, an automated binary classification model based on deep learning networks is designed and validated. Two deep neural networks are trained on historical long time series with known episodes associated with anomalous underwater conditions.
Our classification method is trained to detect the dynamics of events in terms of their temporal behaviour and frequencies. Evaluation of different classification models shows that a higher prediction skill is reached using a combination of atmospheric conditions and a selected ocean parameter. Further improvement of the proposed classification is planned by including a larger set of environmental proxies such as air pressure, precipitation, and ocean currents. An importance of knowledge of precursors of large volume changes in the central Baltic is discussed in Ref. [3]. Analysis of atmospheric conditions and responses of sea level changes to the atmospheric conditions driving an exchange of large water masses is emphasized from the study of sea level elevation at Land sort in the central Baltic [3]. To identify the atmospheric patterns preceding exchange episodes a classification procedure like the one described here could be followed. An automated classifier proposed in this paper could be applied to deterministically select events from a large data sets without further need for visualization or detailed inspection of time series. For example, the proposed classification could be used for detection and prediction of other exchange events such as major Baltic inflow or large volume changes that occur on longer timescale [11-13].
References
- Omstedt A, Elken J, Lehmann A, Lepparanta M, Meier HEM, et al. (2014) Progress in physical oceanography of the Baltic Sea during the 2003-2014 period. Progress in Oceanography 128: 139-171.
- Lehmann A, Hinrichsen H H (2002) Water, heat and salt exchange between the deep basins of the Baltic Sea. Boreal Environment Research 7: 405-415.
- Lehmann A, Post P (2015) Variability of atmospheric circulation patterns associated with large volume changes of the Baltic Sea. Advances in Science and Research 12: 219-225.
- Karstensen J, Liblik T, Fischer J, Bumke K, Krahmann G (2014) Summer upwelling at the Boknis Eck time-series station (1982 to 2012)-a combined glider and wind data analysis. Biogeosciences 11: 3603- 3617.
- Lennartz S, Lehmann A, Herrford J, Malien F, Hansen H P, et al. (2014) Long term trends at the Time Series Station Boknis Eck (Baltic Sea), 1957-2013: does climate change counteract the decline in eutrophication? Biogeosciences 11: 6323-6339.
- Bange H W, Malien F (2014) Boknis Eck Timeseries Database.
- Grinsted A, Moore J C, Jevrejeva S (2004) Application of the cross wavelet transform and wavelet coherence to geophysical time series. Nonlinear Processes in Geophysics 11: 561-566.
- Aggarwal C C (2018) Neural Networks and Deep Learning. Springer International Publishing.
- Fawcett, Tom (2006) An Introduction to ROC Analysis. Pattern Recognition Letters 27 (8): 861-874.
- Tharwat A (2018) Classification assessment methods. Applied Computing and Informatics.
- Lehmann A, Hoflich K, Post P, Myrberg K (2016) Pathways of deep cyclones associated with large volume changes (LVCs). Journal of Marine Systems 167: 11-18.
- Mohrholz V (2018) Major Baltic Inflow Statistics - Revised. Frontiers in Marine Science 5: 1-16.
- Hinrichsen H-H, Bottcher U, Koster F W, Lehmann A, St John M A (2003) Modelling the influences of atmospheric forcing conditions on Baltic cod early life stages: distribution and drift. Journal of Sea Research 49(3): 187-201.


