Prediction of Auv’s Hydrodynamic Coefficients Using a Six DOF Balance System
Aymen Mohamed and Hedi Kchaou*
Department of Mechanical Engineering, National Engineering School of Sfax (ENIS), Tunisia
Submission: July 01, 2019;Published:August 26, 2019
*Correspondence author: Hedi Kchaou, Research scholar, Department of Mechanical Engineering, National Engineering School of Sfax (ENIS), Sfax, Tunisia
How to cite this article:Aymen Mohamed and Hedi Kchaou.Prediction of Auv’s Hydrodynamic Coefficients Using a Six DOF Balance System. Oceanogr Fish Open Access J. 2019; 10(3): 555790. DOI: 10.19080/OFOAJ.2019.10.555790
Abstract
Hydrodynamic features of AUVS models are a main parameter must be identified in order to develop a suitable control system. CFD simulations with Ansys Fluent 17.0 enhanced with experimental tests are performed to AUV model with its different configurations with and without control surfaces. The submerged tests using a six-DOF balance system are carried out for a straight-line direction and a Reynolds number between 2.105 (v=0.2 m/s) and 106 (v=1 m/s). The numerical simulations to solve the Reynolds Averaged Navier-Stokes equations (RANSE) were developed basing on SST k-ω turbulence model in order to characterize the phenomenon of boundary layers separation The calculated hydrodynamic coefficients of both AUV models with and without control surfaces are revealed in good agreement with the measured ones from experimental tests. The effect of the strut arrangement on the flow behavior and the precision of the different results are discussed in detail. Flow separation and pressure distribution around the control surfaces are presented and studied properly
Keywords: AUV; Towing tank; Six DOF balance; Drag; lift; Pitch (Nomenclature)
Introduction
To properly manage the hydrodynamic performances of the autonomous underwater vehicle (AUV), determination of the practicable hydrodynamic coefficients stays a main step in the preliminary design. In this context, several methods were invented over time, ones are semi-empirical like DATCOM method developed by Finck [1]. This method is mainly used for simple aeronautical forms based on missile theories treated by Pitts et al. [2], Nielsen [3] and Jorgensen [4]. Subsequently, analytical and semi-analytical approximations (ASE) were classified as a more practical alternative in the marine domain. Several authors have adapted this method to estimate submarine parameters such as Nahon Prestero [5,6], and Ridley et al. [7]. They have succeeded in characterizing the control strategies of such underwater vehicle. However, the results obtained from this latter method need to be validated by experimental analyzes in order to prove its effectiveness in identifying the various hydrodynamic parameters
Initially, the researchers adapted the same procedure of aerodynamic analysis using the wind tunnel like the case of the developed study of Techy [8] which used it to identify the aerodynamic forces and moments of the glider model. Thus, most of the successful experiments have been developed in a towing tank facility by simulating the movement of the submarine vehicle in a limited marine domain. To measure the hydrodynamic forces, various systems have been developed by researchers in accordance with the adopted experimental procedure. For example, Allen et al. [9] suspended the Remus vehicle in the water using a strut with two Linear Variable differentials Transformers (LVDT) which was attached to the towing carriage during the drag experiment. Thomas [10] have been used two struts to support the AUV in the water and the measurements were made by means of a load cell placed between the hull and the forward strut. Lloyd & Von Ellenrieder [11] have been measured the different forces and moments acting on the vehicle via a six-axes force transducer over various thruster angle. Atkins [12] developed a new test rig capable to measure the compression of a calibrated spring during the movement of the vehicle following a linear motion guide (LMG).
By rectifying the Atkins’s model, Brady [13] succeeded in developing a 6-DOf force balance system based on load cells that can measure the different hydrodynamic forces of a suspended vehicle through two spacers. Despite the continuous improvement of these systems of measurement, the complexity of the experimental procedure remains an important source of errors as well as the high cost of instrumentation adequate to the vehicle being studied. Thus, CFD calculations have become a cost effective method to predict the hydrodynamic parameters without investing too much time and money. However, the installation of a successful simulation tasks requires the generation of a special mesh and a studied setup of turbulence model parameters.
Several authors have been succeeded in validating their experimental measurements by numerical analyzes well specified, citing for example: Jagadeech & Murali [14] who developed those experiments in the towing tank of the university of Madras using the model of Afterbody 1. Indeed, numerical simulations were carried out with fluent by using turbulence models with a low Reynolds turbulence model. Sakthivel et al. [15] have been conducted a special numerical study about MAYA AUV over higher angle of attack using a non-linear k-ε turbulence model to confirm the measured hydrodynamic forces around bare hull model from towing tank experiments. Dantas et al. [16] elaborated several tests in the towing tank to prove the efficiency of the k-ω SST turbulence model to predict well the hydrodynamic efforts over Pirajupa AUV and characterizing the flow separation features around the control surfaces. This study aims the development of submerged tests with AUV model attached to a 6-DOF force balance system. The comparison of the different measurements with numerical results is well evaluated
Material and Methods
Experimental setup
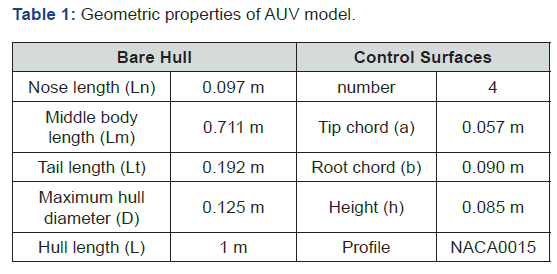
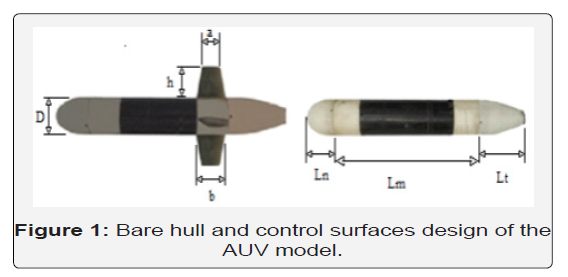
Model Design: Based on the Myring D [17], we have developed the design of the bare hull AUV and its control surfaces as described in figure 1. The model is composed of three main parts; Front body (Ln), intermediate body (Lm) aft body (Lt). The different dimensions are featured in table 1 (Figure 1)
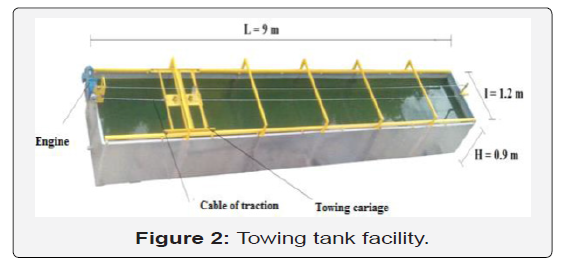
Towing tank facility: The submerged tests of the AUV model are a simulation of diving of a vehicle in a maritime field with limited dimensions. The experiment was carried out in a rectangular towing tank with a length L = 9 m, a high H = 0.9 m and a width l = 1.2 m, as described in Figure 2. The towing carriage equipped with a balancing system measuring the multiple hydrodynamic forces is driven by a traction motor through a cable on rails mounted on both sides of the tank (Figure 2).
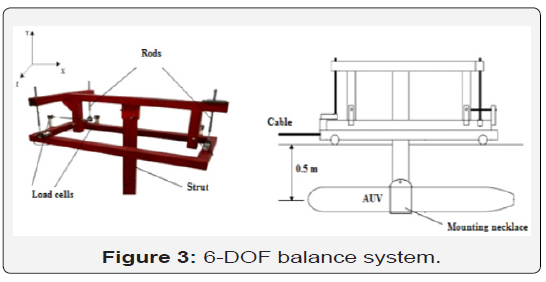
SIX-DOF force balance: The measuring system as a balance is composed of six load cells connected by six small rods with flexures at each end as shown in Figure 3. The forces applied on the AUV model is decoupled into six components acting along the road. This force is measured by the load cells which are placed at the threaded ends of the stainless-steel rods (Figure 3).
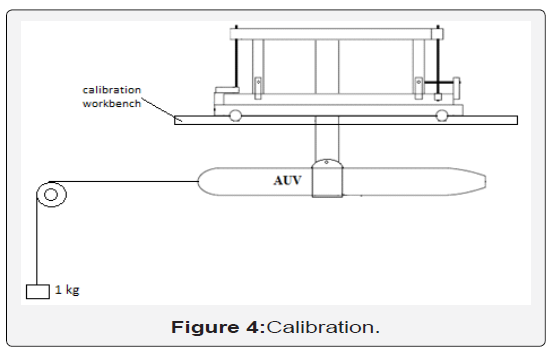
Calibration of the load cells system: In order to determine the different forces applied to the bare hull AUV during its movement, it is necessary to find the relationship between the measurements of the various sensors installed during the submerged tests, because the balance system is maintained by developed mechanical links. The values given by each sensor contribute to the complexity of the measuring system. For the 6 load cells balance system, a calibration matrix [C] was developed based on the following equation:

With [C] is the calibration matrix, [F] is the load applied to each sensor corresponding to the output voltage [f]. This calibration step has been developed statiquely using calibrated wedges suspended via a cable in the direction of the main effort measured during the submerged tests as described in the following picture (Figure 4).
After different measurements and corrections based on the consistency of the obtained results, we can then estimate the calibration coefficients for each sensor defined as follows:
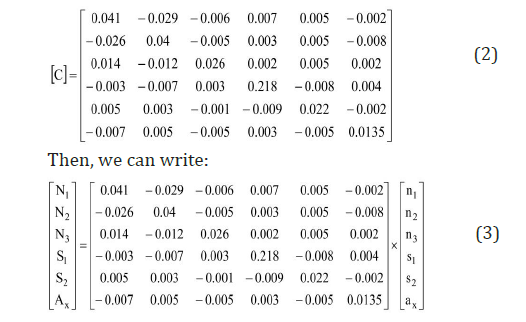
With N1, N2 and N3 are the normal forces. S1 and S2 are the sliding forces, and Ax is the axial force acting on the AUV. n1, n2, n3, s1, s2 and ax are the measured voltage of the matrix [ f] related to each sensor. Due to the right attachment of the underwater vehicle, the values of the rolling and yaw moments will be relatively zero. Then, we are interested in the determination of the axial, normal and lateral forces and the pitching moments acting on the body of the vehicle. Thus, we expect that the lateral forces are negligible thanks to the axi-symmetric shape of the vehicle and symmetrical arrangement of the towing tank. For this, we refer to hydrodynamic forces presented as follows:
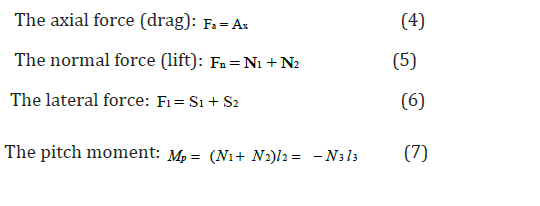
With l2 and l3 represent the load cell location from the center of gravity of the model along the x-axis. Thus, we can express the lift force L and the drag force D for an angle of attack α = 0°, as follows:
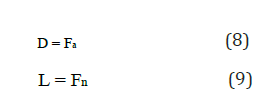
Where L and D are the lift and drag forces respectively. The coefficients of drag Cd, lift Cl and pitching moment Cm can be expressed as follows:
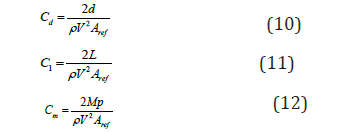
Where, ρ is the water density, is the AUV velocity, Aref is the cross section as reference surface and L is the length of the AUV
Computational Methodology
We are mainly concerned with the application of threedimensional Reynolds Averaged Navier-Stokes (RANS) equation to the incompressible flows [18]. The equations verified are therefore the equation of continuity:

And the equations of momentum:

Where, i u is the mean velocity in ith direction, p is the pressure, ρ is the density, ν is the kinematic viscosity and ' ' i j −u u is the Reynolds stress. The SST k-ω model provides an improved procedure for a proper calculation of the near wall and far field areas basing on the specific trigger of blending function. The transport equations for k and ω are given by:

Where, Gω is generation of ω, k G represents the generation of turbulent kinetic energy that arises due to mean velocity gradients,Yω and k Y represent the dissipation of ω and k due to the turbulence. k S and Sω are source terms defined by the user and Dω is the cross-diffusion term.
Numerical Methodology
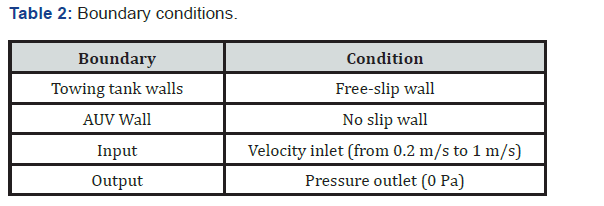
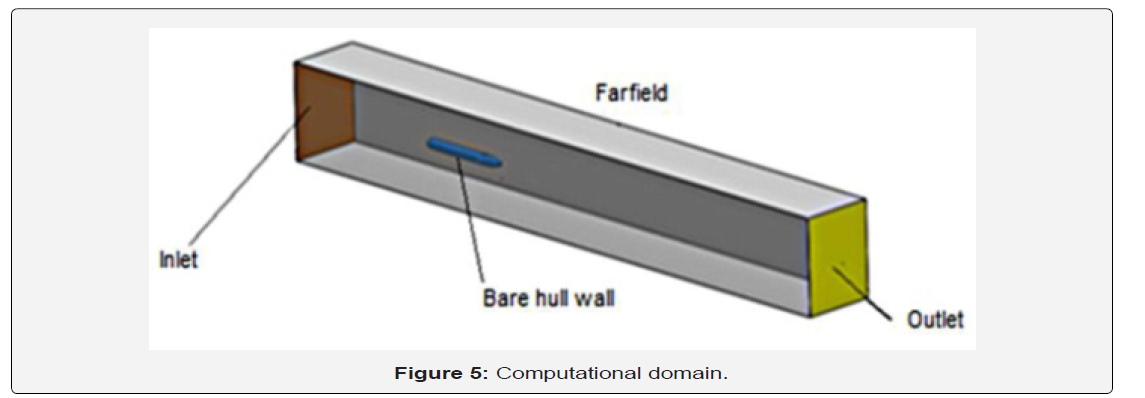
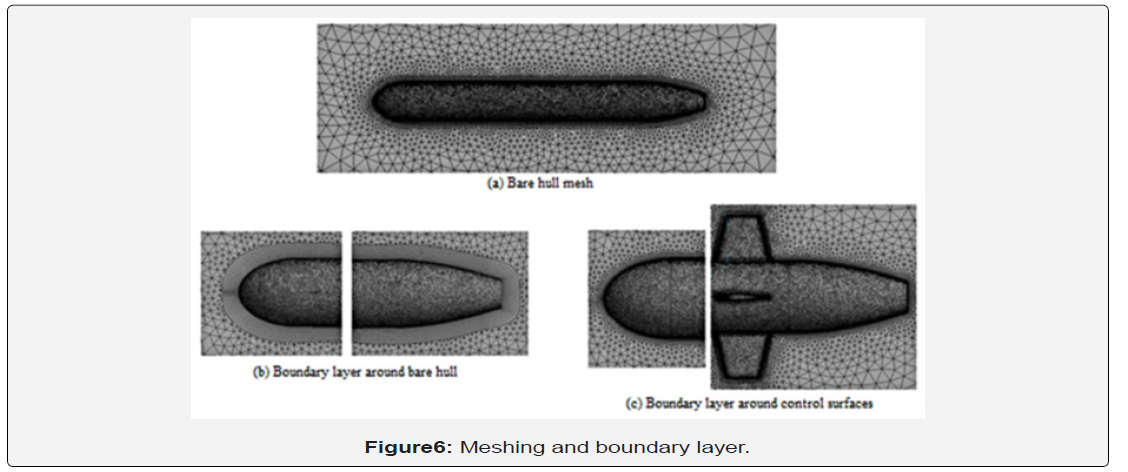
As the experiments are conducted in the towing tank, a summary of the boundary conditions used in the CFD simulations is presented in table 2. In figure 5, the CFD field has been set up to replicate the tank domain as closely as possible (Table 2) (Figure 5). The 3D problem was modeled by the commercial Ansys Fluent code 17.0. The quality of mesh has a great effect on the precision of the obtained results by a numerical calculation. To do this, we divide our domain into two parts; the first with structured mesh closed to the bare hull wall with a generation of studied boundary layer as described in figure 5-b. Its thickness can be calculated basing on the non-dimensionless wall distance y+ as presented by Schlichting & Gersten [19]:

In the second parts beyond the near wall of the vehicle, we have adapted a tetrahedral meshing in order to
save time because it is the zone of the free stream which does not require a rather complicated mesh in order to obtain the best results. The convergence criteria adapted in this work is 10-5 for all parameter residuals (Figure 6).
Results and Discussion
Bare hull AUV Model
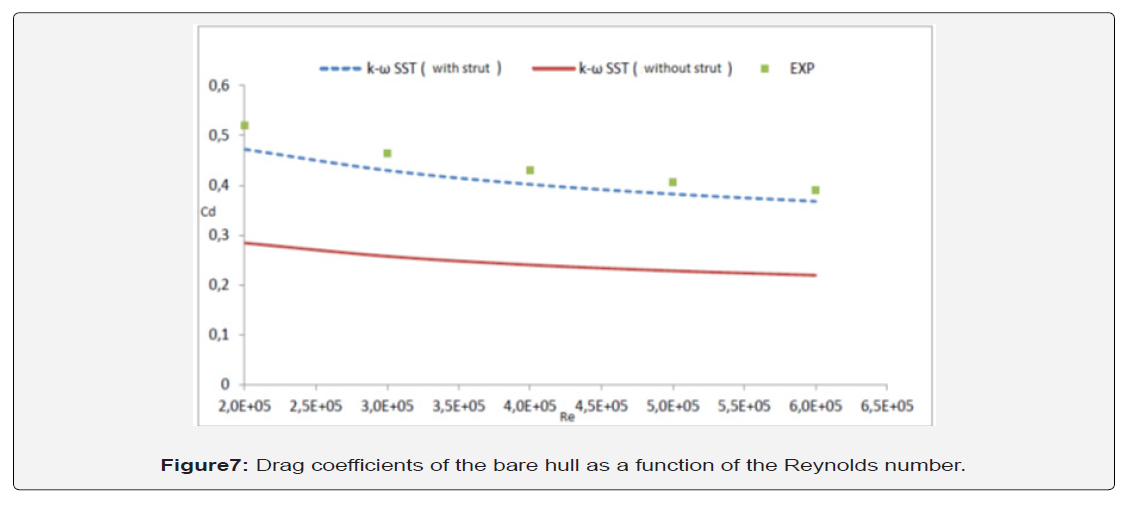
Effect of Reynolds Number: In this section, the calculations of drag coefficient were performed on the hull after being compared with measurements made in the towing tank for velocities that varied between 0.2 m/s and 0.6 m/s and which corresponds to the Reynolds numbers Re = 2.105 and Re = 6.105 respectively. The installation of the AUV model with a balance system reproduces the entire geometrical configuration of the strut in full CFD simulations in order to display the numerical results. In Figure 6, the numerical results of the drag coefficient with a strut are showed in good agreement with experimental measurements inspite of a slight difference varied from 5 to 11%. Thus, the respective differences were observed due to the relative unstable parallelism of the model with the direction of flow during the development of the submerged towing tests. It has also been noted that the effect of the shape of the strut and its location in the prediction of the drag coefficient is clearly observed with a difference between the results of the two configurations (with and without strut). Thus, the results varied between 50% and 80% of the total drag (Figure 7).
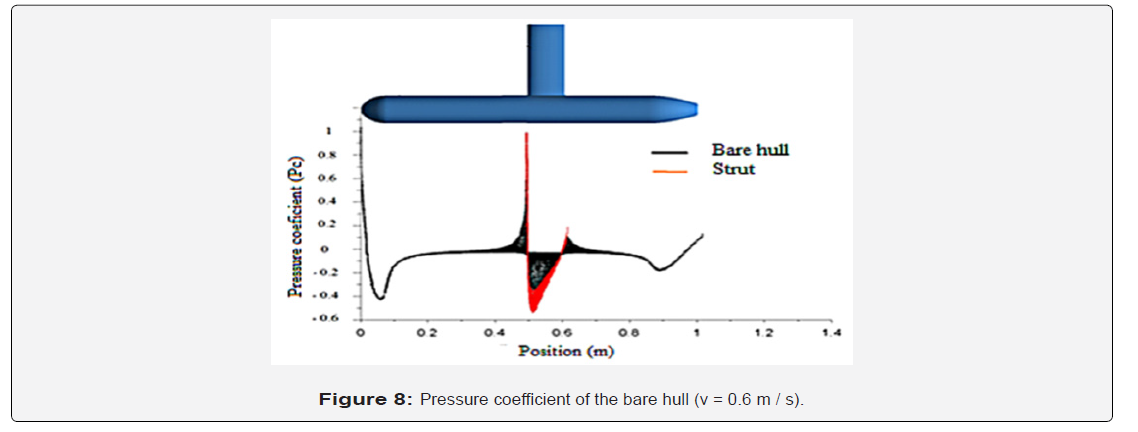
The distribution of the pressure around the AUV model wiith the presence of a holding strut fixed on the central part of the hull is described in figure 7 for a speed v = 0.6 m/s, corresponding to a Reynolds number Re = 6.105. For this geometric configuration, we clearly observe the effect of integration of the lever on the hydrodynamic structure and the pressure where it has been noted a sufficiently developed overpressure rate on its leading edge of the holding lever. This overpressure is mainly related to the zone of interference between the bare hull and the lever because of the abrupt shearing phenomenon of the boundary layer in this region. A clear difference between the drag values for the models with and without shown in Figure 6 is due to the development of the pressure drag around the strut. The exclusion of the configuration of the lever in the numerical simulation, even with the adaptation of a good mesh is already studied with the presence of the strut cannot consider the zone of interference which remains always a source of sudden disturbance of the flow (Figure 8)
Effect of the Attack’s angle: The evolution of the hydrodynamic coefficients of the bare hull for different angles of attack (α) by CFD will be examined below in order to compare them with the experimental measurements. For this study, the static angle of attack (α) used for this study is equal to 0 °, 5 °, 10 ° and 15 ° at a speed v = 0.6 m/s (Re = 6.105). The angle of attack is adjusted by loosening and tightening the locking screw of the AUV holding collar in the desired position during the test
Figure 8 shows the variation of the drag coefficient Cd as a function of the angle of attack α. From these results, the coefficient Cd increases with the increase of the angle of attack α. Indeed, for α between 0 ° and 5 °, the Cd coefficient increases by about 11%. This value increases by about 23% for an angle α between 10° and 15°. Moreover, it is observed that the difference between the numerical results of the two configurations (with and without strut) reaches 70% of the total drag, which shows the dominant effect of the presence of the strut on the value of the drag. This difference is due mainly to the unstable development of the pressure drag around the strut and more precisely the zone of its interference with the bare hull. Also, it is clearly observed that the difference between the experimental and the numerical results of the drag coefficients increases progressively as a function of the angle of attack which reaches 15% for α = 10° and 18% for α = 15°. As a result, it can be noted that for a speed v = 0.6 m/s, the measurements with the balance system with are limited to 10° as the maximum angle of attack (Figure 9).
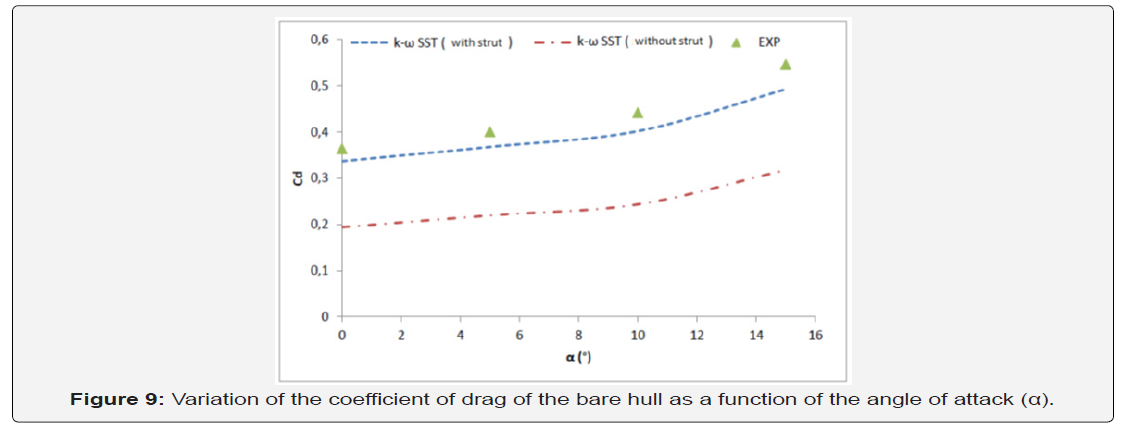
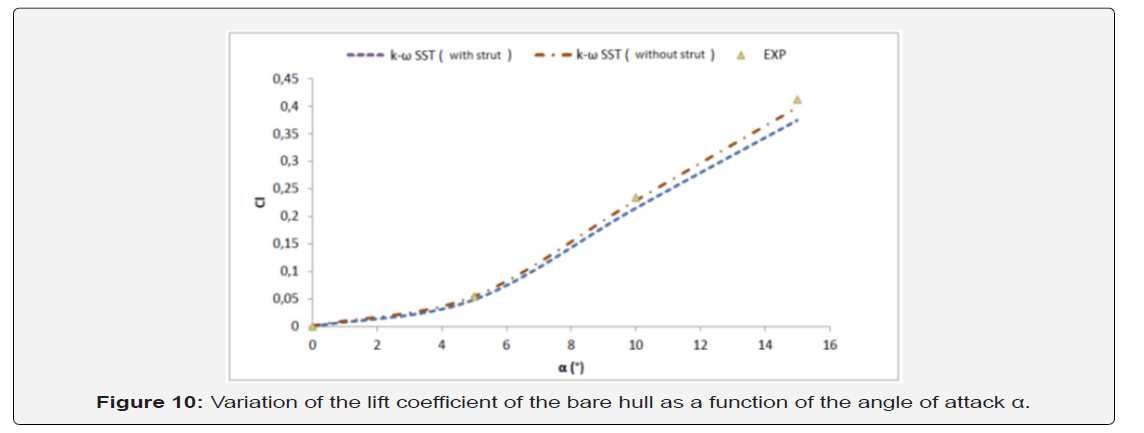
Figure 9 shows that the lift coefficient Cl increases with increasing the angle of attack α. The evolution of this coefficient is gradual and does not exceed 12% for an angle less than 5°. Beyond 5° the lift coefficient Cl increases by about 70% marked by a greater slope for α between 10 ° and 15 °. The main source of Cl increase is due to the displacement of the flow separation point towards the nose of the hull as the angle of attack increases. The increase of the coefficient C1 causes an increase of the pressure in the ascending direction Z. On the other hand, it is noted that the difference between the numerical values without and with strut is relatively small. It is since the lift force is applied to the pressure center of the hull which is usually placed near the position of the strut. We also note from the figure that the difference between the numerical and experimental results of the lift coefficients is acceptable for α <10° and varies between 13 % for α = 10 ° and 19 % for α = 15 °. The difference between the two types of results necessarily depends on the dimensional limitation of the test pool as well as the configuration of the adopted measurement system (Figure 10).
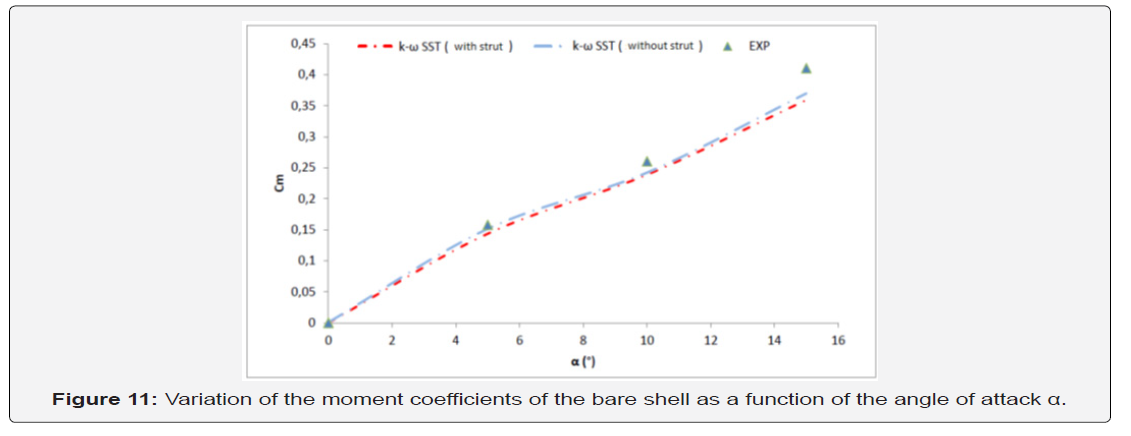
The coefficients of numerically calculated and experimentally measured pitch moments Cm are shown in Figure 10 for different angles of attack α between 0 ° and 15 °. We observe that the moment coefficient is proportional to the angle of attack. Thus, the CFD results follow the same trend as the experimental measurements but with rather large deviations, especially for the highest angles of attack with a difference between the two types of results which varies between 12% for α = 10 ° and 17% for α = 15 °. Furthermore, the pitching moment is mainly related to the lift forces applied to the different parts of the AUV hull and to the distance between the pressure center and the point of articulation with the strut. For this, the integration of the strut has no significant effect on the prediction of the pitch moment coefficient (Figure 11).
AUV model with Control Surfaces
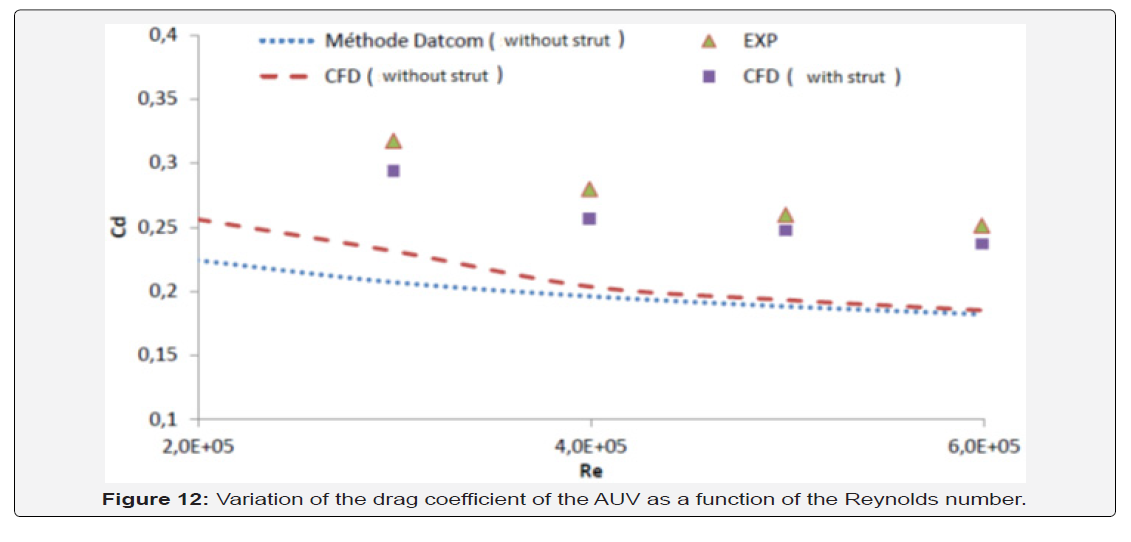
Effect of Reynolds number: The drag coefficients measured both numerically and experimentally are shown in Figure 11 for different Reynolds numbers varying between Re = 2.105 and Re = 6.105, which corresponds to the speeds between 0.2 m/s and 0.6 m/s. From these results, the curves for numerical calculations follow the same general trend as the experimental measurements for the strut configuration. However, the results obtained are in better agreement with the experimental results for Reynolds numbers varying from 5.105 to 6.105. Outside this range, the difference between the two types of results becomes greater than 15%. Thus, the prediction of the drag coefficient by the experimental method is always higher than that of the CFD method, which does not consider factors such as the roughness of the walls of the hull and the towing system of the AUV model during the experiments.
On the other hand, the results obtained by the Dat com method [9] proved to be in good agreement with the results of lever less CFD calculation, especially for speeds above v = 0.4 m/s. This fact has proved that the adaptation of this aerodynamic analysis method is also valid for a reasonable estimate of the hydrodynamic forces on the body. From Figure 9, it is observed that the drag coefficient Cd decreases with increasing Reynolds number. Thus, the turbulent flow separates from the wall and moves further downstream of the body, creating a much smaller wake as the Reynolds number increases (Figure 12).
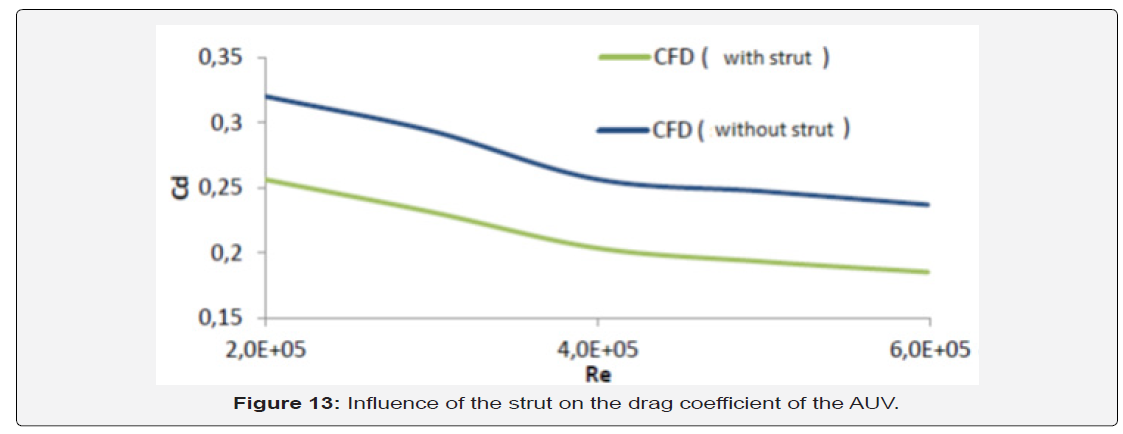
Effect of the Strut: The results for the CFD analysis of the two configurations with and without strut are presented in figure 12. From these results, the strut has a significant effect on the prediction of the drag force coefficient. This is proved by the percentage difference in the drag coefficient between the two configurations varying between 36% and 40% (Figure 13).
Pressure Distribution: Figure 13 shows the distribution of the pressure around the AUV model involving the behavior of the strut on the straight-line flow at a velocity equal to v = 0.6 m/s. The booster pressure zone at the bow represents a relatively high pressure, which also indicates the points of stagnation along the vehicle where the flow pressure is highest. Negative values of the pressure rather indicate a depression leading to a generation of a zone of low pressure. Depression regions at the strut leak edges also indicate that the highest velocity occurs in this region because of Bernoulli’s theorem. Indeed, the pressure difference generated by a depression at the trailing edge of the strut and the leading edge of the opposite control surface causes the creation of a turbulence zone (Figure 14).
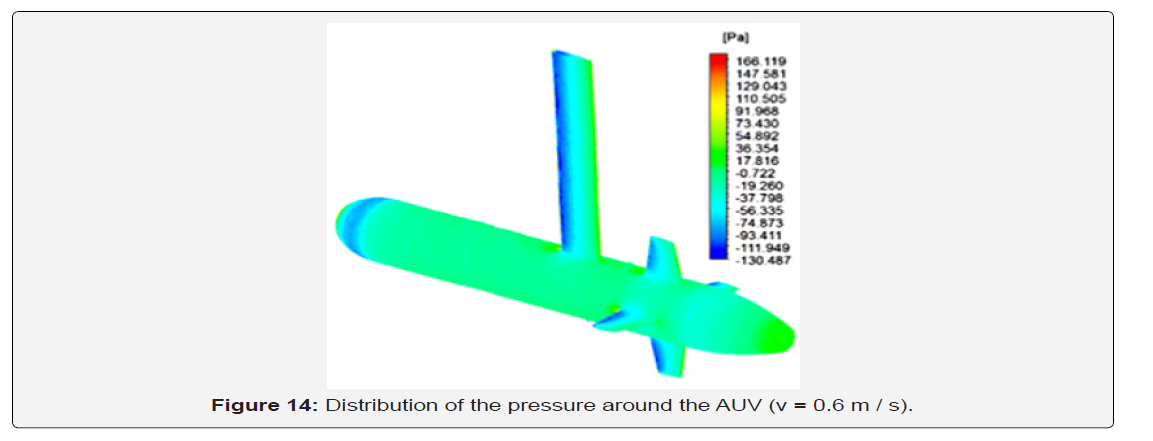
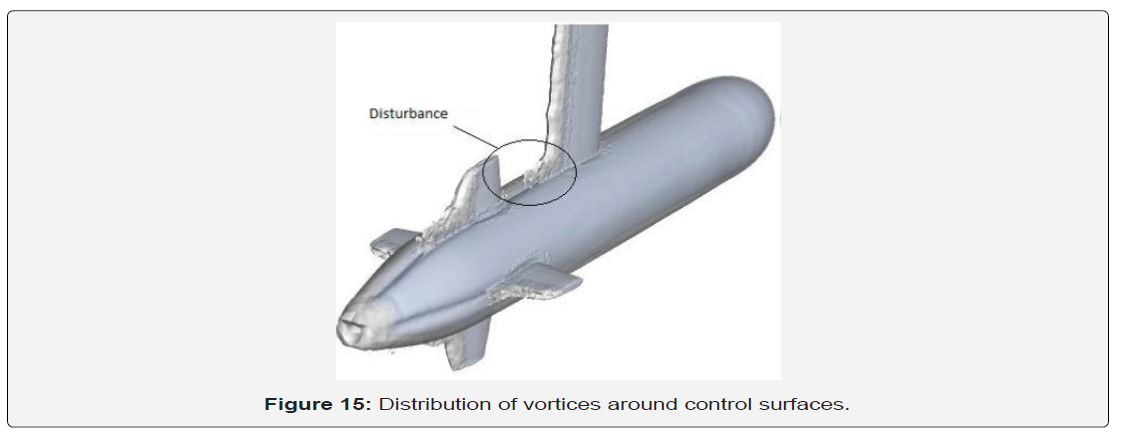
Vortex: Figure 14 shows the vortex distribution upstream of the vehicle shows how the wake created by the strut destabilizes the laminar boundary layers just downstream of the upper control surface. Indeed, this phenomenon develops by increasing the speed and as the AUV model approaches the walls of the basin at the end of the race of the test because of the development of the reflective waves during the braking phase. These results clearly show the difference between the levels of flow disturbance moving away from the wall of the AUV model. Thus, the vortex of junction is visible, following the winding of the boundary layer at the trailing edge of the strut and the control surfaces. Thus, the zone of excessive turbulence between the strut and the upper control surface has another source of disturbance during the tests other than defects in instrumentation and symmetry. Then, the delicacy of the balance system can be explained by the diversity of the sources of disturbances during hydrodynamic force measurements which widen the margin of error evaluated by the results of the numerical simulation (Figure 15).
Conclusion
>The main objective of this paper is to study the hydrodynamic coefficients of an autonomous underwater vehicle (AUV) with the numerical modeling under ANSYS Fluent as well as the submerged tests in the towing tank using the balance system. The results of CFD simulation using SST k −ω model show the good performance of this fully turbulence model to the analysis of the low Reynolds flow around AUV model depending on the developed meshing of the boundary layer. This turbulence model provides results in good agreement with experimental measures as well as the good detection of the onset and level of flow separation. The force measurement with the balance system (6 DOF) is performed in the tow tank on the bare hull and the AUV model with its control surfaces. The results prove that the balance system is more adaptable to the shape of the bare hull because of its axisymmetric shape without empennage which reduces the rate of disturbance of flows affecting the experimental measurements. On the other hand, the analysis of the AUV model with its control surfaces using the balance system proved incapable to predict all hydrodynamic forces applied due to the high disturbance level, notably created between the holding strut and the opposite control surface. n
References
- Finck R (1978) USAF stability and DATCOM. In: McDonald Douglas Corporation, United States.
- Pitts W C, Nielsen J N, Kataari G E (1957) Lift and center of pressure of wing-body-tail combinations at subsonic, transonic, and supersonic speeds. Tech Rep NACA
- Nielsen J N (1960) Missile Aerodynamics. In: McGraw-Hill, New York, USA, pp. 403-416.
- Jorgensen L H (1977) Prediction of static aerodynamic characteristics for slender bodies alone and with lifting surfaces to very high angles of attack. NASA Tech Rep TR-R-474.
- Nahon M (1996) A simplified dynamics model for autonomous underwater vehicles, Autonomous Underwater Vehicle Technology, AUV’ 96: 373-379.
- Prestero T (2001) Verification of a six-degree of freedom simulation model for the Remus autonomous underwater vehicle. Master Thesis, MIT.
- Ridley P, Fontan J and Corke P (2003) Submarine dynamic modeling. Robot Autom Brisbane Australia.
- Techy L, Tomokiyo R, Quenzer J, Beauchamp T, and Morgansen K (2010) Full-ScaleWind Tunnel Study of the Seaglider Underwater Glider. Department of Aeronautics & Astronautics, University of Washington Seattle WA, 98195-2400.
- Allen B, Vorus SW, Prestero T (2000) Propulsion System Performance Enhancements on REMUS AUVs, OCEANS 2000 MTS/IEEE Conference and Exhibition (3): 1869-1873.
- Thomas R, Bose N, Williams D C (2002) Propulsive Performance of The Autonomous Underwater Vehicle: C-SCOUT. OCEANS 2003, Proceedings, (4): 2170-2183.
- Lloyd E JA, Von Ellenrieder DK (2006) Hydrodynamic testing of a Vectored-Thruster Propelled UUV, OCEANS 2006: 1-4.
- Atkins D, Ranmuthugala SD (2006) Experimental testing of the Mullaya AUV, Bachelor of engineer thesis, October 2006, Australian Maritime College library, Newnham, Tasmania.
- Brady L, Ranmuthugala SD (2007) Hydrodynamics of AUV's through experimental and CFD investigations, Bachelor of engineer thesis, Australian Maritime College library, Newnham, Tasmania.
- Jagadeesh P and Murali K (2005) Application of low-Re turbulence models for flow simulations past underwater vehicle hull forms. Journal of Naval Architecture and Marine Engineering 1: 41-54.
- Sakthivel R, Vengadesan S, Bhattacharyya S K (2011) Application of non-linear k-ε turbulence model in simulation of flow over underwater axisymmetric hull at higher angle of attack. Journal of Naval Architecture and Marine Engineering 8(2): 147-163.
- Dantas JLD, and de Barros EA (2013) Numerical Analysis of Control Surface Effects on AUV Manoeuvrability. Applied Ocean Research 42: 168-181.
- Myring D F (1976) A theoretical study of body drag in subcritical axisymmetric flow. Aeronautical Quarterly 27(3): 186-194.
- ANSYS (2010) Ansys Fluent theory guide. In: Canonsburg, USA.
- Schlichting H, Gersten K (2000) Boundary Layer Theory. In: Mc Graw hill, Germany.


