Ocean Thermal Expansion: In Theory and by a Simple Experiment
Nils-Axel Mörner1* and Stein Storlie Bergmark2
1Paleogeophysics & Geodynamics, Sweden
2Former Assistant. Professor, University of Agder, Norway
Submission: July 16, 2019; Published: July 31, 2019
*Correspondence author: Nils-Axel Mörner, Paleogeophysics & Geodynamics, Stockholm, Sweden
How to cite this article:Nils-Axel Mörner, Stein Storlie Bergmark. Ocean Thermal Expansion: In Theory and by a Simple Experiment. Oceanogr Fish Open Access J. 2019; 10(3): 555787. DOI: 10.19080/OFOAJ.2019.10.555787
Abstract
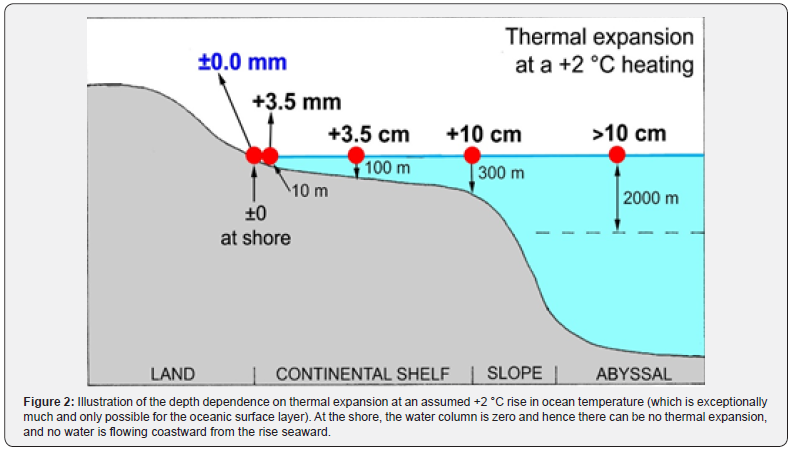
Temperature changes in the ocean water masses affect the vertical height of the water column by expansion at heating and contraction at cooling. The surface change is a function of the amount of heating and the depth of heating (or cooling). A heating of 0.55 °C as observed for the upper 100 m of the ocean surface would correspond to a sea level expansion of 9 mm. A heating of 2.0 °C would rise a 300 m water column by +10 cm, a 100 m water column by +3.5 cm and a 10 m water column by +3.5 mm. At the shore there will be no rise at all, as there is no water to expand, and the offshore expansion will not flow laterally to the shore (Thermal Expansion, Encyclopedia of Coastal Science, 2017). We will demonstrate this with a simple physical experiment (communicating vessels), which can be repeated by anyone.
Keywords: Thermal Expansion; Sea Level Changes; Theory and Experiment
Introduction
Thermal expansion is a concept of sea level changes quite frequently discussed today. The concept goes far back in time and was then known as steric changes in sea level caused by change in temperature or salinity [1]. The Holocene sea level oscillations on a centennial bases were sometimes proposed to be driven primarily by steric sea level changes [2]. Mörner showed [3] that the sea level changes were dominated by glacial eustasy up to about 6000-5000 BP (regardless of tectonic differentiation) and thereafter was dominated by the redistribution of water masses. When satellite altimetry commenced in 1992, the lateral redistribution of water masses over the oceans was well monitored [4], whether caused by lateral dislocation of water masses or by differential thermal expansion (or rather a combination of both). Thermal expansion became a part of the concept of global warming [5], claiming that the general warming from 1970 to 2000 also generated a global sea level rise component due to thermal expansion. Often it is used without basic anchoring in physical and oceanographic facts as straightened out in the Encyclopedia of Coastal Science [6].
The Theory of Thermal Expansion
The water column of the ocean varies from 0 (zero) at the shore to about 6000 m in the abyssal. Only the upper part is susceptible for thermal expansion, however. The largest changes are in the upper 100 to 300 m. Some heating is observed down to 700 m and even 2000 m [7].
Thermal expansion refers to the tendency of matter to change its shape, area and volume in response to a change in temperature. The application of thermal expansion to the evaluation of sea level changes has been discussed by several authors [6]. The accumulated effect during a century was estimated at 5 cm by [8] and 10 cm by [3]. In the estimate of expected sea level changes in the future, it is necessary to consider the frames within which one must work [9]. Figure 1 gives the relations among water expansion, temperature and water column affected [3,6,9]. A rise of 0.55 °C in the upper 100 m [10] would rise sea level by +9 mm, and a rise in temperature of 0.4 °C in the upper 700 m [11] would generate a rise of +4.5 cm (Figure 1).
Figure 2 gives the changes with depth from the open ocean to the shore at a heating of +2 °C, which is quite much and can only affect the uppermost ocean layer. It may therefore be regarded as an overestimate for the 2000 m depth, 300 m depth, and maybe even the 100 m depth. The figure is included in order to illustrate the decrease in thermal expansion towards the shore, and the absence of any sea level rise at the very shore, where most tide gauges are located, and where changes in shore morphology and shore criteria provide evidence of sea level changes [12].


A simple Experiment

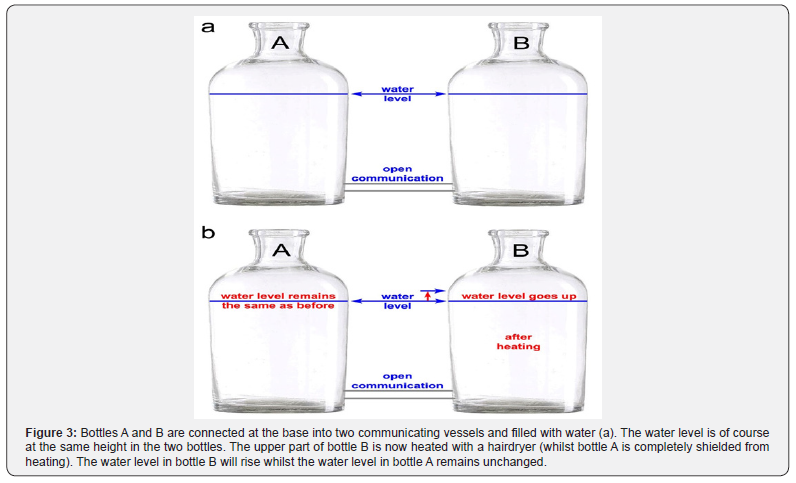
One of us (SSB) designed the following experiment (Figure 3), tested it and double-checked it a couple of times. 1. Two bottles (A & B) were connected by an open communication at the base into two communicating vessels (Figure 3a). They were filled with water, which – in accordance with the law of two communication vessels – was at the same level in the two bottles (Figure 3). The bottom water pressure (weight/area) is now the same in bottle A and bottle B. 2. The upper part of bottle B was heated with a hairdryer (whilst bottle A was completely isolated from heating). 3. After heating, the water level in bottle B rose whilst the water level in bottle A remained unchanged (Figure 3b).
Heating implies a change in volumetric mass density forcing the water level to expand and rise in bottle B. This does not change the weight of the water in bottle B, which implies that the water pressure (weight/area) at the bottom of bottle B remains unchanged, and still is the same as the water pressure at the bottom of bottle A. Consequently, there is no pressure imbalance, no water will flow between the bottles, and the water level in bottle A will remain unchanged.
This provides an excellent experimental test of the theoretical thermal expansion irregular distribution as a function of temperature increase and height of the water column heated as illustrated in Figure 2 and Figure 1, too. The experiment is simple, costless and expressive. It can be recommended for schools, but also for deeper climatic and sea level research at universities. Instead of our bottles, we would recommend the use of two graduated measuring cylinders with an open connection at the base.
Conclusion
Thermal expansion is an important factor. It is often exaggerated, however. Heating of the oceans is confined to the surface layer; i.e. the upper 100-300 mm but even reaches down to 700–2000 m. This heating is always cyclic; never linear over multi-decadal and longer periods. The contribution to sea level changes is estimated not to exceed 10 cm by year 2100. Whatever the thermal expansion may be in the open ocean, it continuously decreases landwards with the decrease in water depth (i.e. the water column of expansion) and becomes zero at the shore, where there is no water column to expand (Figure 2). There is no flow towards the shore from the offshore water expansion (Figure 1). The theory is solid [6]. Figure 3 provides a simple experiment showing that, indeed, when two bottles are connected at the base as communicating vessels, and one bottle is heated, the water level will rise in this bottle but remain unchanged in the other.
References
- Fairbridge RW (1961) Eustatic changes in sea level. Physics and Chemistry of the Earth 4: 99-185.
- Schofield J (1980) Postglacial transgressive maxima and second-order transgression of the southwest Pacific Ocean. In: N A Mörner (ed.) Earth Rheology, Isostasy and Eustasy. Wiley, Chichester, England, Pp. 517-521.
- Mörner N A (1996) Sea level variability. Marine Science 102: 223-232.
- Fu LL (2014) Ocean surface topography. In: EG Njoku (ed.) Encyclopedia of Remote Sensing, Springer, pp. 455-461.
- IPCC (Intergovernmental Panel on Climate Change) (1990) First assessment report – climate change: the IPCC scientific assessment. Cambridge University Press, pp. 410.
- Mörner N A (2017) Thermal expansion. In: Encyclopedia of Coastal Science, Springer Intern, DOI 10.1007/978-3-319-48657-4_375-1.
- Agro (2019) http://www.argo.ucsd.edu
- Nakibogul SM, Lambeck K (1991) Secular sea-level changes. In: R Sabadini, K Lambeck, E Boschi (eds), Glacial isostasy, sea-level and mantle rheology. Kluwer Academic Press, Dordrecht, Netherlands, Pp. 237-258.
- Mörner N A (2011) Setting the frames of expected future sea level changes by exploring past geological sea level records. In: DJ Easterbrook (ed), Evidence-based climate science, Elsevier, Amsterdam, Netherlands, PP. 185-196.
- NOAA (2019) National Oceanographic Data Centre, http://www.climate4you.com/Text/Climate4you_May_2019.pdf.
- Cheng LJ, Zhu J, Abraham J (2015) Global upper ocean heat content estimation: Recent progress and the remaining challenges. Atmostpheric and Ocean Science Letters 8 (6): 333-338.
- Mörner NA (2019) Biology and shore morphology: keys to proper reconstruction of sea level changes. Journal of Marine Biology and Aquascape, https://www.auctoresonline.org/images/article/155179161705-03-2019J__Marine_Biology___Aquascape.PDF


