Determining Benchmarks for Cargo Throughput Performances of Privatized Seaports in Nigeria
Nwokedi Theophilus C*, Chukwuemeka Ezembu, Gbasibo Lawrence Addah and Nwoloziri Chinyeaka Nwokodi
Department of Maritime Management Technology, Federal University of Technology, Nigeria
Submission: April 08, 2019; Published: June 28, 2019
*Correspondence author: Nwokedi Theophilus C, Department of Maritime Management Technology, Federal University of Technology, Owerri, Nigeria
How to cite this article:Nwokedi T C, Chukwuemeka E, Gbasibo L A, Nwoloziri C N. Determining Benchmarks for Cargo Throughput Performances of Privatized Seaports in Nigeria. Oceanogr Fish Open Access J. 2019; 10(1): 555780. DOI: 10.19080/OFOAJ.2019.10.555780
Abstract
There exists the challenge of seeming lack of empirically determined cargo throughput benchmark models for the privatized West African port terminals particularly in Nigeria, as target benchmarks which terminal operators and port authorities must drive towards to ensure that the current improvement in port productivity experienced in the post concession era is sustained. The study was therefore aimed at developing benchmarks for the cargo throughput performances of the privatized five Nigeria ports of Apapa (Lagos), Port-Harcourt, One, Warri and Calabar. Such benchmarks developed for each seaport must be higher than the pre-privatization cargo throughput performances of the seaport. This became important following the improvements observed in the cargo throughput performances of the various ports from the year 2006 after the privatization of the ports and the recent recession faced in the Country which seems to have retarded the cargo throughput performances and other measures of seaport performance in the various Nigeria ports.
Using Cp1, CL1, Cw1, Co1, Cc1, to represent the base year 2006 cargo throughput performances of Port-Harcourt, Lagos, Warri, Onne and Calabar seaport respectively; and n, d, to represent the number of post privatization years covered in the study and common difference in cargo throughput performances; the study used a historical design approach in which time series data on cargo throughput performances of the ports were obtained from the Nigeria ports Authority (NPA) annual statistical reports were analyzed using the converging and diverging arithmetic series mathematical modeling tool and MATLAB software, to determine benchmark models, for ensuring that the improved cargo throughput performances of the various seaports, are sustained to remain higher that the pre-privatization cargo throughput performances. The study developed the following Cargo throughput benchmark models for each seaport as findings. Lagos port = CL1 + (n – 1)d ≥ 15223340; Onne port = Co1 + (n -1)d ≥ 15820381; Port-Harcourt port = Cp1 + ( n -1)d ≥ 28016979; Warri = Cw1 + ( n-1)d ≥4643128; Calabar = Cc1 + (n-1)d ≥ 7963434. It was recommended that to improve port revenue which is a dependent factor on cargo throughput and vessel call rate, cargo throughput benchmarks model developed for the individual seaports should be used to empirically model quantum s of cargo throughput needed to economically sustain and improve the level of port operations. It should equally influence port marketing drives. This will ensure that the performance of the ports does not recede into the poor performance indices experienced in the pre-privatization era.
Keywords: Benchmarks; Cargo throughput; Privatized seaports
Introduction
The Webster online dictionary (2018) defines a benchmark as standardized reference point, level or mark that serves as a basis for projecting, evaluation or comparison of subsequent marks, points or performance levels; noting that benchmarks serve as a standard by which subsequent marks and quality may be measured or judged. In terms performance and/or quality, benchmarks represent minimum acceptable performance and/or quality levels to organizational managers and corporate decision makers; below which quality and /or performance are to be adjudged as poor and unacceptable [1]. Quality and performance are thus expected to progressively improve from the benchmark values to positive infinity in order to remain within the acceptable quality and or performance regions (on or beyond benchmarks). The privatized ports of Nigeria followed the drive and resolve of the Federal government to improve the performances of the seaports. The port reforms policy embarked upon by the Federal Government of Nigeria in 2006 saw the privatization of all the major ports in Nigeria inclusive of the Apapa ports (Lagos), Onne port, port-Harcourt port complex, Warri port and Calabar port. That was in a bid to provide solutions to the numerous challenges that led to poor performance of the ports
Thus, the introduction of 2006 port reform that brought about port concession and privatization enabling the ceding of the port infrastructures and operation of port facilities to private port operators called the terminal operators while the Nigerian ports Authority (NPA) becomes their landlord. It is expected that the post privatization life of the Nigeria ports will stamp out the port challenges and poor management which led to long ship turnaround time, low berth occupancy rate, low cargo throughput, low port revenue earnings, poor ship call rates, etc., witnessed in the pre-privatization life of the ports and subsequently improve the post privatization performances of the ports [2]. Ambati et al. [3] notes that the cargo throughput of a port represents the aggregate total tonnage of cargo including export and import cargo of various types handled and/or facilitated by the port. Cargo throughput is an important variable for measuring the performance of a port system because the revenue earnings capacity of the port is dependent on the cargo dues and ship charges handled by the port.
Thus, for higher revenue performance, the port must attract higher number of vessels calls to berth and subsequently higher cargo traffic flow (cargo throughput) (NPA, 2015). When cargo throughput value is low, it indicates a dwindling poor performance and a pointer to the fact that the port may equally be suffering from poor revenue generation. Higher cargo throughput performances are indicative of good and improved port performance and a pointer to higher revenue earnings since revenue is mostly dependent on cargo and ship charges while port cargo throughput is dependent on vessel traffic statistics and size. The implication is that ports will need strategic management tools which must proactively seek to project and enable them to be achieving higher cargo throughput performances. This can be possible through the process of benchmarking by which minimum cargo throughput targets are set as benchmarks which ports must achieve in order to competitively remain in business. These benchmarks may equally be determined for other port performance measurement parameters/variables such port revenue, ship traffic size, etc. as a basis for ensuring sustainable port operations.
In the port logistics sector, it has been determined that benchmarks help investors and port authorities to communicate performance and quality wishes in empirical terms to port managers [2]. Thus, it is useful in assigning the managers to have a performance benchmark and indexes with which to project/ forecast and compare subsequent ports performances and service qualities. A good performance benchmark appropriately reflects the seaport portfolio’s investment style and strategy as well as the investor’s return expectations. In terms of cargo throughput performances, it reflects the port authorities expectations of the volume and tonnage of cargo to be handled by the port or terminal per period of time (per annum) which equally is indicative of the revenue expectations of the port operators since an increasing relationship has been found to exist between port revenue earnings and cargo throughput performances of Nigeria seaports [4]. It is however expected that the different ports of Nigeria will vary in their cargo throughput benchmarks. This is because the benchmark values for each port must reflect the level of port capacity and investment presented by each port.
Ambati et al. [3] underscores the importance of developing benchmarks. In the case of West Africa, developing cargo throughput, revenue, vessel traffic etc, benchmarks for the Nigeria ports and terminals is important because comparing current performances and returns to a benchmark enables authorities to measure a port and/or terminal manager’s skill and helps to answer the question of what additional value was created or added by the manager’s decisions. The difference in the current performance level and the benchmark quantifies and represents the value created or added. The added value gives terminal managers, port authorities and port operators an idea of how the port performance indicator in question (cargo throughput, port/terminal revenue, vessel traffic volume, quality of service) oscillate around its benchmark or how volatile the port performance indicator is relative to its benchmark. Poor and unacceptable port performance levels will thus necessitate intervention actions and policies aimed at redirecting it to meet and /or surpass benchmarks. Such intervention actions and policies may include adoption of extra port marketing strategies, service quality improvement strategies, port pricing strategies and port capacity improvement strategies [5].
The implementation of these strategies as mentioned above implies that the port authority and /or terminal operators may need to increase his investment risks in order to ensure that port performances meet up with or exceed determined benchmarks. The level of investment risks required in closing the gap between performance benchmark and current poor performance level will be determined by relating the risk to benchmark per capital investment. Benchmarks therefore not only measure returns, but also measure risk as well as help the port operators determine whether the value added adequately compensates for the investment risk involved [6]. Smith [7], Sharma [8] and Surez- Alemn [9] view Benchmarking as a management tool that has been defined as the process of comparing one’s business processes and performance metrics to industry bests and best practices from other companies. In project management benchmarking can also support the selection, planning and delivery of projects and may serve as tool by which a firm compares its performance metrics to already internally established target benchmarks without recourse to best practices in other (similar) firms. Invernizzi, Locatelli & Brookes [6] note that dimensions typically measured in benchmarking are mostly quality, time and cost and production quantity.
Since the product of the port logistics sector is most times cargo services and other forms of services rendered to ship owners and port users, the production quantity for the port authority or terminal operator may be expressed in terms of tones and volumes of cargo and ship traffic handled via the port terminals. In the process of best practice benchmarking therefore, port management may identify the best firms( ports) in their industry where similar processes of port capacity exist , and compare the performance (cargo throughput, revenue, ship traffic etc.) results of those studied (ie, targets) to one’s own performance results. This enables them to learn how well the targets are met; more importantly, they learn the business processes that explain why these ports are successful. Ports can equally determine internally performance targets as benchmarks which contributing departments must meet in their drive to maximize organizational output. However, defining what performance benchmark should be met by Nigeria ports in terms of cargo throughput volume/ tonnage, port revenue, ship traffic etc., and consistently meeting the set benchmarks remain a big challenge for the ports in the developing West African Country.
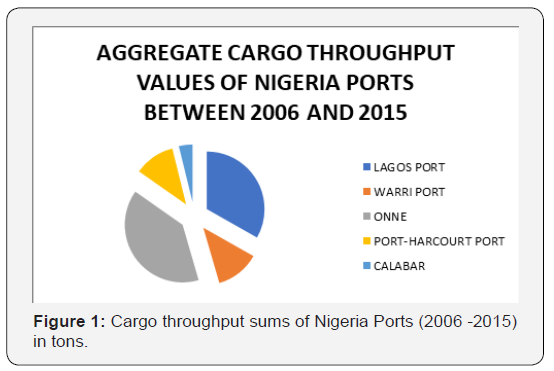
But to maximize the economic contribution of the port logistics sector in Nigeria, developing benchmarks for the cargo throughput, port revenue and ship traffic statistics of Nigeria ports in the post privatized port era is very inevitable as it provides basis for projecting the performances of the ports. Various studies like those of Okeudo [10], Bassey & David [11] note that the privatization policy has enhanced ports performance since commencement of its implementation. It has improved the cargo throughput, berth occupancy rate, ship turnaround time, labour productivity, port revenue generation and ship traffic over the years. For example, the aggregate cargo throughput of each of the privatized Nigeria ports in the period between 2006 and 2015 is as show in the pie chart below (Figure 1). These studies were however based solely on comparisons of the pre and post privatization performances of the ports; for example, comparing the pre and post concession cargo throughput performances of the ports. To be able to determine whether or not and how the post privatization cargo throughput, port revenue, ship traffic statistics etc., of the ports continues improve, benchmarks must be determined for the performance indicators of each port so that the performance metrics of each port can be compared with determined post privatization benchmarks of each performance indicator.
The difference between the cargo throughput performance metric and cargo throughput benchmarks for example will indicate the quantum of cargo throughput value added/created; and similarly, for port revenue, etc. At present, the Nigeria ports and terminal seems to lack these performance benchmarks. No studies are known to have developed benchmarks for post privatization cargo throughput performance of all Nigerian seaports. The current study therefore seeks to development benchmarks for the post privatization cargo throughput performance of the Nigeria seaports terminals of Apapa port complex Lagos, the Onne port complex, warri port, calabar port and the port-Harcourt port complex as case studies. These benchmarks currently do not exist, and the ports seem to operate without having cargo throughput performance targets each year. This has a way of impeding the optimal realization of the improved performance objectives of the port privatization exercise. If port performance must be optimized, strategic development of cargo throughput targets and benchmarks which must be equally pursued with Virgo by the port operators is key and important for improving the productivity levels of the Nigerian seaports [12], Nwokedi, Emeghara, Ikeogu [13].
Objectives of the Study
The objective of the study is to develop benchmarks and benchmarking models for post privatization cargo throughput performance of Nigeria seaports of Apapa port, Onne port, Warri port, Calabar port and Port-Harcourt port. The specific objectives of the study are: i. To develop benchmarks for the post privatization cargo throughput performance of Apapa (Lagos) port complex, Warri seaport, Port-Harcourt port, Onne seaport and Calabar port. ii. To forecast a 10-year post privatization cargo throughput performance targets/benchmarks for the ports of Apapa (Lagos), Onne, Warri, Calabar and Port-Harcourt from 2015 to 2025. iii. To compare the 10-year post privatization cargo throughput performance benchmarks/targets determined for the seaports.
Methodology
Time series data on cargo throughput performances of the Nigeria seaports of Apap ports, Onne port, Calabar port, Warri port and Port-Harcourt ports covering the post privatization period from 2006 to 2015 were collected from the Nigerian Port Authority (NPA) and will be analysed using the infinite arithmetic series quantitative method and the MATLAB software. The infinite arithmetic series method will be used to develop benchmarks for the various seaports studied. The statistical method of Analysis of Variance (ANOVA) method will be used to compare the 10 years cargo throughput performance benchmarks developed for each of the ports [14]. Employing the arithmetic series method, ten years (2006 – 2015) period cargo throughput of each port namely: Lagos Port, Warri Port, Port Harcourt Port, Onne Port, and Calabar Port were analysed using infinite arithmetic series and differences in cargo throughput sequences of the each of the five ports from the 2006 base year in comparison to the privatized ports base year cargo throughput performances. Using the symbols XL1, Xw1, Xo1-- Xp5 and XC1 to represent the post privatization cargo throughput performances of each of Lagos, Warri, Onne, Port-Harcourt, and Calabar seaports from the base year 2006 to 2015 representing a 10 year period; the differences between the base year performance value and the subsequent year cargo throughput performance of each port will be employed ascertain levels of variation from base year performance [15] values from the base year values and thus the sustainability of the cargo throughput performances of each port from base year to positive infinity(diverging series) and from positive infinity to improved post privatization base year cargo throughput values of the seaports. Since the study covers a 10 years period; we may assume that n = 10, thus 10th year deviation in cargo throughput performance from the base year for Lagos port is written as: Xln – Xl1; and similarly, for the other ports [16].
The benchmark models for cargo throughput performance may thus be determined by using CL, CW, CP, CO, CC, to symbolize cargo throughput performances of Lagos, Warri, Portharcourt, Onne, Calabar respectively; we write the performance sequence for each port as:
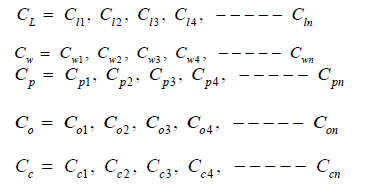
Where Cl1, Cw1, Cp1, Co1, and Cc1= base year (1st term) cargo throughput, performances of the various Lagos, Warri, Port- Harcourt, Onne and seaports; Cln , C wn, C pn , C on and C cn = 10th term (10th year) cargo throughput, performances of the various seaports [2,17]. For an arithmetic series/progression performance is expected to be sustained at or beyond the 1st term (base year improved cargo throughput performance levels) and not below it for each seaport. We have that:
U = a, a + d, a + 2d, − − − − − − a + n – 1(d ) − − − − − − − −(i).
Where U = series, a = 1st term of the sequence, d = common difference. The difference is however found not to be common for the performance values from the 1st term to the 10th term as shown by the data collected but for purposes of planning, forecasting and projection, a common difference will be found using the sum of the first 10 terms of the sequence as used in this study [2]. With reference to the performance indicator used which is cargo throughput we have the general form:

Where C1= 1st term of the sequence = base year (2006) post privatization cargo throughput performance level of each port. d = common difference. n = number of terms = 10. To determine the common difference for benchmarking and planning purposes, we use the sum of an arithmetic series as:

The sums for cargo throughput performances for each seaport will thus be given as:

Thus, the common difference ‘d’ for the cargo throughput performance parameter for each seaport covered in the study can be determined for purposes of developing benchmarks using equations (vi) and making ‘d’ the subject of the equations. Having obtained the common differences for cargo throughput performance of each port, the nth term for the cargo throughput performance benchmark of each port in each year can be thus developed using the formula:
nthterm = C + n −1 d − − − ix for cargo throughout performance [2].
The 1st term (2006 base year) cargo throughput performance of each seaport in the post privatization era showed improved post privatization cargo throughput value than the pre privatization years; the study assume that the 2006 base year (1st term) performance levels of each port is within acceptable performance region. We thus develop a benchmark around it that: ( ) 1 th 1 ; L n term = C + n − d for Lagos port, and similarly for each of the ports of Onne, Warri, Calabar and Port-Harcourt.
Cargo throughput benchmarks are thus developed around CL1, Co1, Cw1, cc1, and cp1 for Lagos, Onne, Warri, Calabar and Port- Harcourt seaports respectively. The expectation that subsequent cargo throughput values are to diverge from the benchmarks to positive infinity in favourable economic conditions; and in adverse economic conditions; are monitored to converge on the benchmarks (1st terms) and not allowed to recede below it. Performances below these benchmarks are evidences of receding of performances into the poor performance region of the pre privatization era and this is unacceptable. Using the methods discussed above, the study was carried out in other to achieve the research objectives. The data collected will be analysed using the MATLAB software.
Results and Discussion of Findings

(Table 1) The result of the analysis indicates that the subsequent post privatization cargo throughput performance of the Lagos port for the periods (years) after 2006 base year was progressively beyond that of the 2006 base year performance value of 1522340 except in the year 2007 when performance was less than the 2006 base year value by 410268. The years , 2008, 2009, 2010, 2011, 2012, 2013, 2014 and 2015 which shows positive Nth term – a values witnessed higher cargo throughput performance than the base year; an indication that the cargo throughput performance of the port in 2006 post privatization base year was sustainably surpassed in the subsequent years. Since cargo throughput performance of the port is a measure of the aggregate of cargo traffic that called at or was handled at the port over the period, it is an important factor which influences port revenue generation and cargo (customs) charges; since both revenue and customs charges are dependent variables on cargo traffic of the port. The implication is that, increasing trend of cargo throughput performance may at the long run induce revenue and customs collections among other variables dependent on it to take increasing trend. A cargo throughput Benchmark is therefore needed to ensure that cargo throughput performance of the Lagos port is progressively sustained to retain values beyond or at the base year value and subsequent year values.

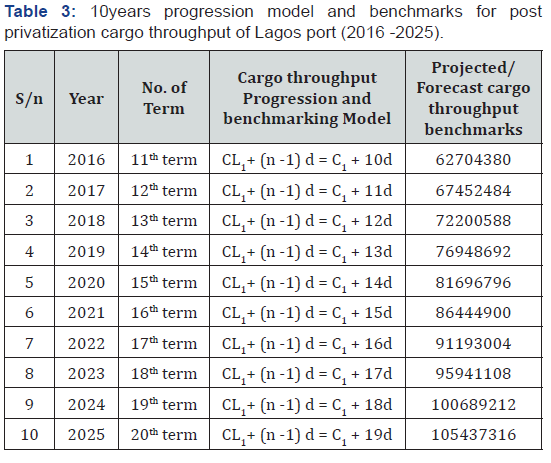
The (Table 2) indicate that the aggregate of 19496634 tons of cargo was handled at the Lagos (Apapa) port over the period, for purposes of determining benchmark for cargo throughput planning, a common difference ‘d’ – 4748104 has been determined. Using the common difference of 4748104, the post privatization cargo throughput performance of Lagos port is projected/extrapolated for the next 10 years starting with 2016 as shown in the table below as cargo throughput benchmarks/ targets which the seaport should achieve. The (Table 3) shows the progression/benchmarking models determined based on the result of the analysis for planning to ensure that cargo throughput performance of the Lagos seaport does not fall below performance targets. Thus, the port authority and terminal operators should for example target to achieve a cargo throughput performance of 105437316 tons in the year 2025, following the previous performance sequence. Thus, cargo throughput performance figure below benchmark of 105437316 in the year 2025 is an indication that performance target or benchmark was not met. Comparison with performance benchmark will thus indicate if post privatization performance was sustained at, above or below benchmark value. From the result, the overall post privatization performance benchmark for cargo throughput of Lagos (Apapa) port is a = C1 = 15223340 tons. From this improved post concession cargo throughput performance value/point, performances can progressive diverge to infinity or converge to benchmark. Performances below 15223340 tons are indicative of diminishing performance into poor performance trend of the pre privatization era. Thus, for continuous improvement of post privatization cargo throughput performance of Lagos port; ( ) 1 1 1 L L C + n − d ≥ C . ie; ( ) 1 1 15223340 L C + n − d ≥ tons are a condition/benchmark that must be met.
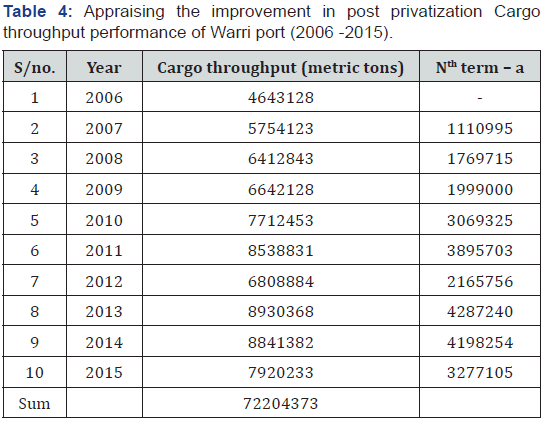
The result of the analysis indicates that the subsequent post privatization cargo throughput performances of the Warri port for the periods (years) after 2006 base year was progressively beyond that of the 2006 base year performance value of 4643128 (Table 4). The years 2008, 2009, 2010, 2011, 2012, 2013, 2014 and 2015 which shows positive Nth term – a values witnessed higher cargo throughput performance than the base year; an indication that the cargo throughput performance of the port in 2006 post privatization base year was surpassed in the subsequent years. By implication, increasing trend of cargo throughput performance will at the long run induce revenue and customs collections among other variables dependent on it to take increasing trends. A cargo throughput performance benchmark is therefore needed to ensure that cargo throughput performances of the Warri port continues to be progressively sustained to retain values beyond the base year value as benchmark and subsequent year performance values.

The Table 5 indicates that the aggregate of 72204373 tons of cargo were handled at the Warri port over the 10year post privatization period used in the study; for purposes of determining benchmark for cargo throughput performance of Warri port, a common difference ‘d’ 2863677 has been determined. Using the common difference of 2863677, the post privatization cargo throughput benchmark targets of Warri port is projected for the next 10 years starting with 2016 as shown in the table below as benchmarks which the seaport should achieve in each of the years. The (Table 6) shows the cargo throughput progression and benchmarking models for Warri port determined based on the result of the analysis for planning to ensure that cargo throughput performances of the Warri seaport do not fall below performance targets. Thus, the port authority and terminal operators should for example target to achieve a cargo throughput performance of 59052991 tons in the year 2025, following the previous performance sequence.

Thus, cargo throughput performance figure below benchmark of 59052991tons in the year 2025 is an indication that performance target or benchmark was not met. Comparison with performance benchmark will thus indicate if post privatization performance was sustained at, above or below benchmark value. From the result, the post privatization performance benchmark for cargo throughput of Warri port is a = Cw1 = 4643128 tons. From this improved post privatization cargo throughput performance value/level; performances can progressive diverge to infinity or converge to benchmarks. Performances below 4643128 tons are indicative of diminishing performance trend. Thus, the condition for continuous sustenance of post privatization cargo throughput performance of Warri seaport is: ( ) 1 1 1 w w C + n − d ≥ C . i.e ( ) Cw1 + n −1 d ≥ 4643128 tons are a benchmark that must be met in the yearly operational life of the Warri seaport in the post privatization era.
The result of the analysis on (Table 7) indicates that the subsequent post privatization cargo throughput performance of the Port-Harcourt port for the periods (years) after 2006 base year consistently surpassed that of the 2006 base year performance value of 4643128 except in years 2007 and 2008 where performances were below the base year performance by 263815 tons and 1654893 tons respectively. This shows that no added values were created in 2007 and 2008; rather values were lost from previous base year performance. The years 2009, 2010, 2011, 2012, 2013, 2014 and 2015 which shows positive Nth term – a values indicating that each witnessed higher cargo throughput performance than the base year; an indication that the new cargo throughput performance values were created and/or added in those years. To ensure that additional cargo throughput values are continuously created in each in the post privatization life of the port; cargo throughput performance benchmark need to be determined for the Port-Harcourt port complex. The (Table 8) indicates that the aggregate of 67007029tons of cargo was handled at the Port-Harcourt port over the period, for purposes of determining benchmark for cargo throughput planning in the port, a common difference ‘d’ 4332248.8 has been determined. Using the common difference of 4332248.8, the post privatization cargo throughput performance benchmarks of Port-Harcourt port is projected and panned for the next 10 years starting with 2016 as shown in the table below.
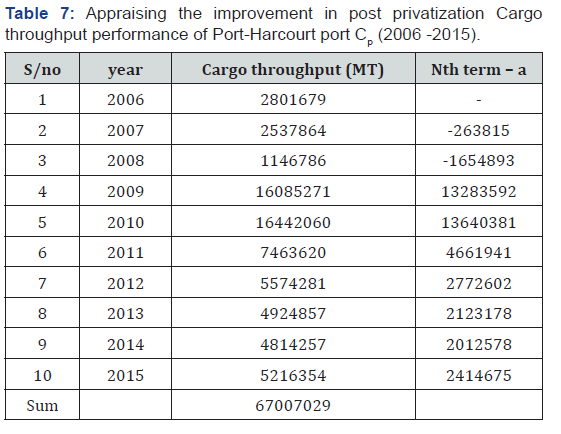
The (Table 9) shows the benchmarking and progression models for post privatization cargo throughput of Port-Harcourt port determined based on the result of the analysis for to ensure that cargo throughput performance of the Port-Harcourt seaport does not fall below performance target. Thus, the port authority and terminal operators should for example target to achieve a cargo throughput performance of 85114406 tons in the year 2025, following the previous performance sequence. Thus, cargo throughput performance figure below 85114406 in the year 2025 is an indication that performance target or benchmark was not met. Comparison with performance benchmark will thus indicate if post concession performance was sustained at, above or below benchmark value. From the result, the post privatization cargo throughput performance benchmark for Port-Harcourt port is: a = Cp3 = 2801679 tons. From this improved post privatization cargo throughput performance benchmark, performances can progressive diverge to positive infinity or converge to benchmark. Performances below 2801679 tons are indicative of diminishing performance trend. Thus, for continuous sustenance of post privatization cargo throughput performance of Port- Harcourt port must ensure the condition: ( ) 3 3 1 p p C + n − d ≥ C . ie ; ( ) 3 1 2801679 p C+ n − d ≥ tons is a benchmark that must be met.


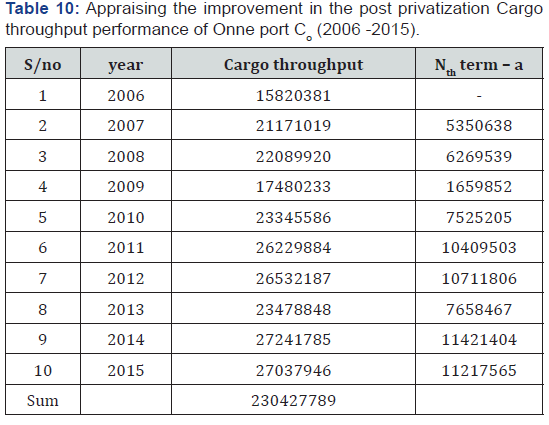
(Table 10) The result of the analysis indicates that the subsequent post privatization cargo throughput performance of the Onne port for the periods (years) after 2006 base year consistently surpassed that of the 2006 base year performance value of 15820381. The years 2007, 2008, 2009, 2010, 2011, 2012, 2013, 2014 and 2015 which also show positive Nth term – a values indicating that each witnessed higher cargo throughput performance than the base year. Benchmark can however be determined based on this relationship for the post privatization cargo throughput performance of Onne seaport. This will enable the post privatization cargo throughput performance of the port to continuously improved and sustained. The Table 11 indicates that the aggregate of 230427789 tons of cargo was handled at the Onne port over the period; for purposes of determining benchmark for cargo throughput planning, a common difference ‘d’ 8024887 has been determined.

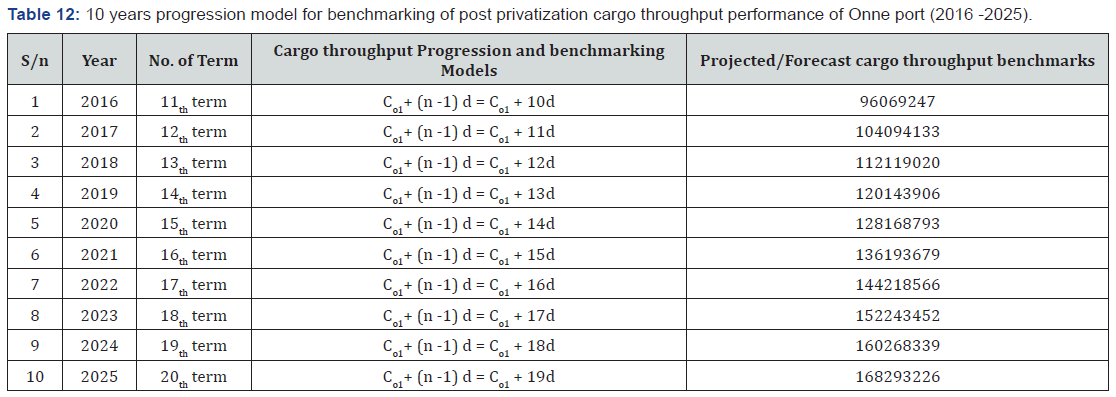
Using the common difference of 8024887, the post privatization cargo throughput performance of the port is projected and panned for performance for the next 10 years starting with 2016 as shown in the table below as benchmarks which the seaport should achieve The (Table 12) above shows that the cargo throughput performance benchmarks for Onne seaport in each year from 2016 to 2025. Thus, the port authority and terminal operators should for example should target to achieve a cargo throughput performance of 168293226 tons in the year 2025, following the previous performance sequence. Thus, cargo throughput value below 168293226 in the year 2025 is an indication that performance target and/or benchmark was not met. From the result, the post privatization performance benchmark for cargo throughput of Onne port is a = Co1 = 15820381tons. From this improved post privatization cargo throughput value; performances can progressively diverge to positive infinity or converge to benchmark. Thus, for continuous sustenance of post privatization cargo throughput performance of Lagos port is: ( ) 1 1 1 o o C + n − d ≥ C . ie ; ( ) 1 1 15820381 o C + n − d ≥ tons is a benchmark that must be met.
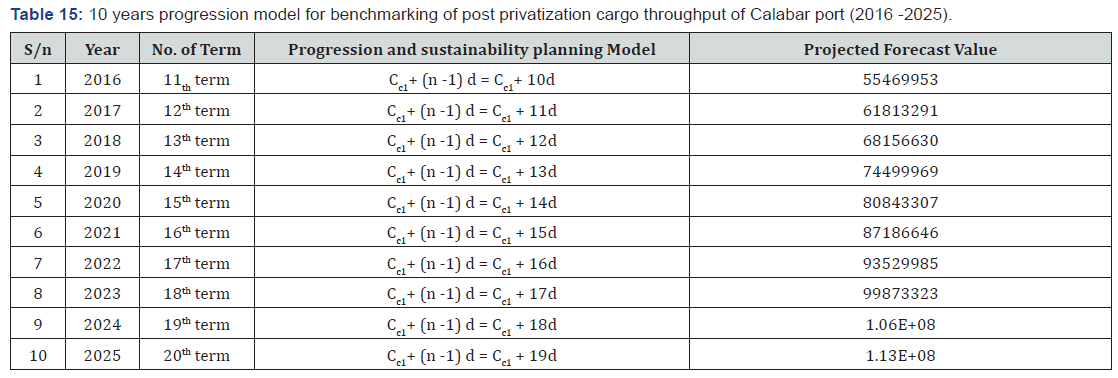
The result of the analysis indicates that the post privatization cargo throughput of the Calabar port for the periods (years) after 2006 base year was consistently higher than that of the 2006 base year value of 7963434 (Table 13). The years 2007, 2008, 2009, 2010, 2011, 2012, 2013, 2014 and 2015 which shows positive nth term – a value indicates that each witnessed year higher cargo throughput performance than the base year. The implication is that additional cargo throughput values were created in the each of the years to achieve higher performance level than the base year value. The (Table 14) indicates that the aggregate of 22544292 tons of cargo was handled at the Calabar port over the period; for purposes of determining benchmark for cargo throughput of the port, a common difference ‘d’ = 6343338.68 has been determined. Using the common difference of 6343338.67, the post privatization cargo throughput performance of the port is projected and for the next 10 years starting with 2016 as shown in the table below and benchmarks are determined which the seaport should achieve in each year.


The Table 15 shows the benchmarks for cargo throughput performance of the Calabar seaport from 2016 to 2025. For example, it indicates that the port authority and terminal operators should target to achieve a cargo throughput of 112560001 tons in the year 2025, following the previous performance sequence. Thus, cargo throughput performance figure below 112560001 in the year 2025 is an indication that performance benchmark was not met. From the result, the post concession performance benchmark for cargo throughput of Calabar port is a = Cc1 =7963434 tons (Table 16). From this improved post privatization cargo throughput performance benchmark, performances can progressive diverge to positive infinity or converge on benchmarks. Cargo throughput Performances below 15820381 are indicative of diminishing poor performances. Thus, the generic benchmark for cargo throughput Calabar port is: ( ) 1 1 1 c c C + n − d ≥ C . ie ; ( ) 1 1 7963434 c C+ n − d ≥ tons.
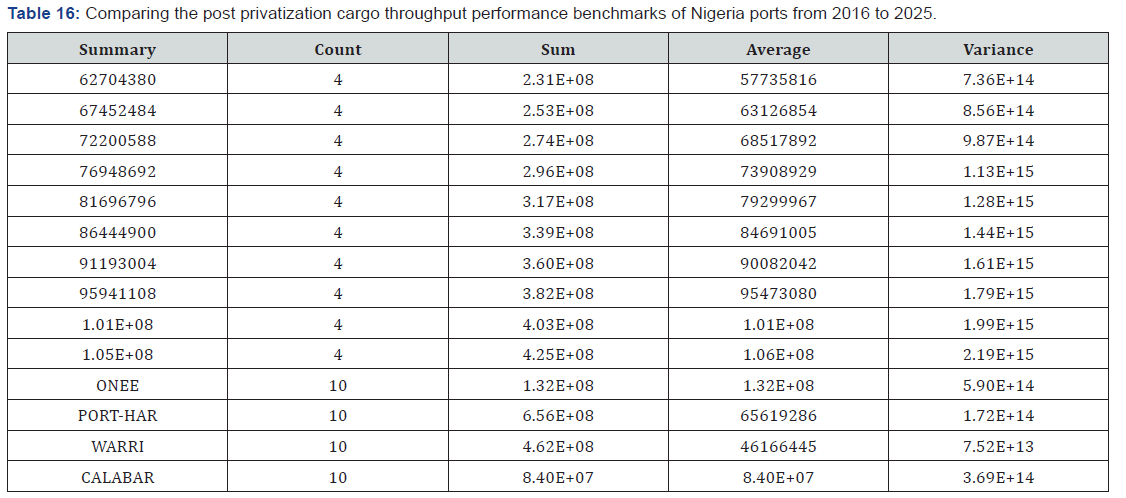
The table 4.6 above shows the result of the comparison carried out to determine if a significant difference exists among the cargo throughput benchmarks developed for the five ports. The result shows an F-score of 22.7166, p-value of 2.24E-10 and F-critical of 2.2501 per annum. This indicates that for every year between 2016 and 2025, significant differences exist between the cargo throughput benchmarks and targets with the Lagos seaport having the highest performance benchmark per annum followed by Onne seaport. Furthermore, over the 10 years period 2016-2025, the F-score is 289.527 with p-value of 1.24E-20 and F- critical of 2.960. This also shows the existence of a significant difference in cargo through benchmarks/targets among the seaports, with the seaport of Apapa Lagos having the highest performance benchmark. This is in line with the general publication expectation that the Lagos port should handle greater cargo given the higher port capacity and level of investment in the port in comparison with the capacity of other ports used in the study
Conclusion
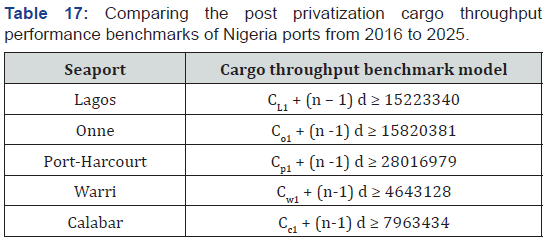
The objectives of the study have been realized and the study determined the following models as the post privatization benchmarks of the Nigerian ports used in the study. The post privatization cargo throughput benchmark models for each port in Nigeria used in the study are summarized below (Table 17)
Recommendation
It was recommended that to improve port revenue which is a dependent factor on cargo throughput and vessel call rate, cargo throughput benchmarks model developed for the individual seaports should be used to empirically model quantum s of cargo throughput needed to economically sustain and improve the level of port operations. It should equally influence port marketing drives. This will ensure that the performance of the ports does not recede into the poor performance indices experienced in the pre-privatization era. Ushering in competition in port management, administration and operation is a major reason for port privatization; terminal operators should therefore apply the benchmark models and the result of the comparison of benchmarks in charting a favourable port completion strategy.
References
- Boxwell Jr, Robert J (1994) Benchmarking for Competitive Advantage. In: McGraw-Hill, New York, p. 225.
- Nwokedi TC, Emenike GC (2018) Sustainability Planning and Benchmarking of Post Concession Performance of Nigerian Seaports: The Case of Onne Seaport. Journal of ETA Maritime Science 6(3): 181-197.
- Ambati J R, Totakura B R, Hiranmoy R, Nookala B P (2017) Benchmarking and Probing its Applicability: Major Seaports of India. SCMS Journal of Indian Management 35-53.
- Buhari SO, Ndikom OB, Nwokedi TC (2017) An assessment of the relationship among cargo-throughput, vessel turnaround time and port-revenue in Nigeria. (A study of Lagos port complex). Journal of Advance Research in Business, Management and Accounting 3 (7).
- Yasin M M (2002) The theory and practice of benchmarking: then and now. Benchmarking: An International Journal 9.
- Invernizzi D C, Locatelli G, Brookes N J (2017) How benchmarking can support the selection, planning and delivery of nuclear decommissioning projects. Progress in Nuclear Energy (99): 155-164.
- Smith A M (2000) Using consumer benchmarking criteria to improve service sector competitiveness. Benchmarking: An International Journal 7(5): 373-388.
- Sharma M (2009) Performance based stratification and clustering for benchmarking of container terminals. Expert Systems with Applications, 36(3): 5016-5022.
- Surez-Alemn A (2016) When it comes to container port efficiency, are all developing regions equal? Transportation Research Part A: Policy and Practice 86: 56-77.
- Okeudo GN (2013) Effect of Port Reform on Cargo Throughput Level at Onne Seaport Nigeria. A Comparative Study Before and After Reform Policy Implementation. IOSR Journal of Business and Management 12 (1): 71-78.
- Bassey J B, David D E (2014) The impact of Concessioning on Performance of Calabar Seaport. Multidisplinary Jouraial of Research on Developmental Perspectives 3(1): 56-62.
- Olaogbebikan J E, Njoku I, Faniran A O, Okoko E (2014) Performance Evaluation of Nigerian Ports: Pre and Post Concession Eras. Civil and Environmental Research 6(2).
- Nwokedi TC, Emeghara GC, Ikeogu C (2015) Trend Analysis of Impacts of Cargo Pilferage Risk on Post Concession Cargo Throughput Performance of Nigerian Seaport Terminals. International Journal of Research Commercial and Management. 5(7): 11-
- Moriarty B (2008) A theory of Benchmarking. University of Wisconsin PhD Thesis.
- Ndikom OB (2006) Kernel concept of shipping operations, policies and strategies: the industry overview. In: Bunmico publishers, Lagos, Nigeria.
- NPA (2015) Nigeria Ports Authority (NPA) brand manual.
- Webster M (2018) Webster online English dictionary.


