Influences of Temporal Changes in Pelagic Scattering Layers on Short-Finned Pilot Whales Behavior
Adrienne M Copeland1*, Whitlow W L Au1 and Jeffrey Polovina2
1University of Hawaii, United States of America
2Hawaii Institute of Marine Biology, University of Hawaii, United States of America
Submission: December 19, 2018; Published: February 13, 2019
*Correspondence author: Adrienne M Copeland, University of Hawaii, Honolulu, Hawaii, United States of America
How to cite this article:Adrienne M Copeland, Whitlow W L Au, Jeffrey Polovina. Influences of Temporal Changes in Pelagic Scattering Layers on Short- Finned Pilot Whales Behavior. Oceanogr Fish Open Access J. 2019; 9(2): 555758. DOI: 10.19080/OFOAJ.2019.09.555758
Abstract
To understand the distribution of deep diving odontocetes, it is important to investigate the relationship between the foraging whales and their prey. Short-finned pilot whales mainly feed on squid and occasionally fish. Foraging short-finned pilot whales off the Island of Hawaii were located using trained visual observers and a passive acoustic hydrophone or a hydrophone array. A 500 meter by 500-meter survey box was set up over the foraging sites. A two-frequency split-beam echosounder collected micronekton backscatter over foraging and non-foraging control sites of the same location and similar time of day. Nautical Area Scattering Coefficient (NASC) (m2nmi−2) profiles were compared over the water column between foraging and non-foraging populations to analyze the relationship between micronekton density and short-finned pilot whale foraging. Using a generalized additive mixed model and a generalized linear mixed model, it was determined that short-finned pilot whales were able to exploit the daily variation of micronekton preferring to forage when the relative biomass was higher, and the deep scattering layer was found at shallower depths suggesting that there was more prey at accessible depths for the whales to feed on.
Abbrevations: NASC: Nautical Area Scattering Coefficient; NOAA: National Oceanic and Atmospheric Administration; SOI: Schmidt Ocean Institute; SSL: Shallow Scattering Layer; DSL: Deep Scattering Layer; GAMM: Generalized Additive Mixed Model; IA: Index of Aggregation; MBC: Mesopelagic Boundary Community
Introduction
The term “patch dynamics” was first quantified by Thompson [1], describing the dynamics of a system’s heterogeneity (patches) [2]. As seen in terrestrial systems, biological variability can persist on a multitude of spatial and temporal scales [3]. This patchiness has also been documented in marine environments and can also exist on a diversity of spatial scales from meters to thousands of kilometers and time scales from hours to years [4], with the implications affecting organisms ranging from small plankton to larger marine mammals [5,6]. Spatial variability in the marine environment with patchiness of primary productivity and prey abundance in pelagic waters can lead to the heterogeneous distribution and aggregations of higher trophic level predators [5,6]. Patchiness of productive waters can be enhanced by transient processes such as cyclonic and anticyclonic eddies due to the convergent and divergent zones of currents that upwell and down well water increasing the local nutrients and phytoplankton and zooplankton [7,8]. Patches due to eddies have been documented to aggregate top predators including melon-headed whales, Peponocephala electra, off the Hawaiian Islands with whale tracks being focused toward the outer edge of the cyclonic eddies [6], providing further evidence of a link between primary producers and high-level consumers, with the melon headed whales foraging mostly on pelagic and mesopelagic squid and fish [9-11].
Spatially persistent patchiness of pelagic organisms can be enhanced by proximity to [12]. This increased productivity has been documented throughout the Pacific Ocean with higher biomass of phytoplankton being found closer to islands and atolls [13,14]. Past work has demonstrated that the proximity to land appears to also influence the distribution of higher tropic levels with relative micronekton biomass being higher closer to land [15]. Micronekton are organisms ranging in size from 2 cm - 20cm, including abundant small fishes (mostly myctophids), crustaceans (mostly larger euphausiids and shrimp), and cephalopods [16,17]. Near island aggregations of micronekton appear to attract short-finned pilot whales along the Kona coast of the Island of Hawaii [18]. Short-finned pilot whales forage mostly on squid and occasionally fish and these squid feed on micronekton [19-25], demonstrating both a direct and indirect link between the spatial patchiness of micronekton and whale distribution and signifies that short-finned pilot whales can exploit the spatial variability or patchiness of their prey as well as the forage items of their prey
In addition to spatial variability in prey fields, temporal variability is likely to exist, but little is known about short-finned pilot whales’ ability to exploit such variability along with the spatial variability of their prey or their prey’s forage
To further understand the link between temporal variability of ocean organism biomass and short-finned pilot whale foraging activity, the authors investigated if a. There was a daily change in the horizontal micronekton backscatter and composition b. If the vertical structure of micronekton changes temporally c. If these changes were correlated with short-finned pilot whale foraging Since a relationship between the locations of foraging short-finned pilot whales and the spatial variability of micronekton has been documented along the Kona coast of the Island of Hawaii [18], the connection with the temporal variability will be assessed in this paper in this area.
Methods
Data Collection
The data were collected at four sites (PW0, PW1, PW2, and PW3) in leeward waters of Hawaii Island during June 2013 and February 2014. The June 2013, data were collected onboard the National Oceanic and Atmospheric Administration (NOAA) R/V Oscar Elton Sette, while the February 2014 data were collected aboard the Schmidt Ocean Institute (SOI) R/V Falkor. Shortfinned pilot whales were located from both platforms using trained visual observers. Foraging individuals were confirmed by the presence of echolocation clicks using a single hydrophone or a hydrophone array deployed in the vicinity of the whales. The echolocation clicks of this species were easily detectable audibly using the known frequency range of the species documented in the Hawaiian Islands with Baumann-Pickering et al. [26] reporting an average center frequency of 25.2 kHz.
Sampling locations: The sample locations in the leeward waters of the Island of Hawaii. During the June 2013 cruise, a six-element hydrophone array with a 250 kHz sampling rate was used to localize the vocalizing whales and confirm foraging. The hydrophones in the array included APC piezoceramic elements with an approximate sensitivity (including pre- amplier gain) of -150±5 dB re 1 V/mPa between 500 Hz - 400 kHz, and Teledyne-Reson TC4013 hydrophone elements used for recording higher frequencies had a sensitivity of approximately -211±3 dB re 1 V/μPa between 1 kHz-170 kHz. From the array, the approximate location of the signaler was further validated using a phone-pair bearing in the digital signal-processing program ISHMAEL and Whale Trak to graphically map the location. During February 2014, the whale location was estimated by observers, and foraging was confirmed using a single hydrophone with a sensitivity of about 160 dB re 1V/uPa and recorded on a Micro track recorder with a sample rate of 96 kHz (Figure 1).

Once foraging was confirmed, a 500 m by 500 m sample grid was centered at four sites over the localized clicking whale. Relative micronekton density of the area was estimated from in situ acoustic backscatter data collected on both platforms using a calibrated hull mounted Simrad EK60 split-beam two frequency echosounder with the 38 kHz and 70 kHz frequencies operating at 2000W and 750 W, respectively. The pulse duration for both frequencies was set to 512 μs. The frequencies were calibrated using a 38.1 mm diameter tungsten-carbide reference sphere and standard techniques [27,28].
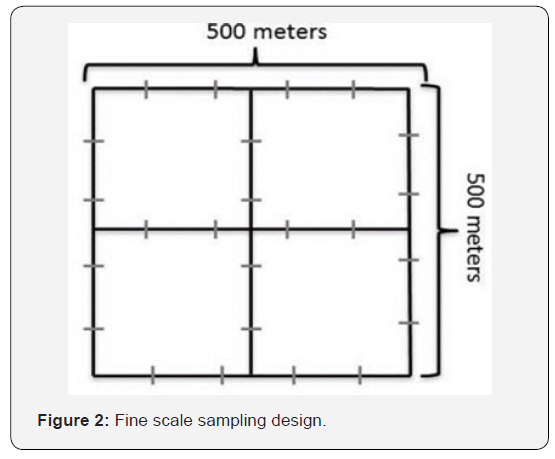
Fine Scale Sampling Design: Pictorial representation of the 500 by 500 meters fine scale (grid) sampling design to measure the nautical area scattering coefficients (NASC) near foraging shortfinned pilot whales and during control times when the foraging whales were absent. The grey dashes are the 100-meter sampling increments. A threshold of -80 dB mean volume backscattering strengths (Sv; units: dB re 1 m-1), a proxy for relative density [29], was used to remove backscatter from plankton and other smaller organisms. Noise and missing data were excluded in ECHOVIEW 5.4 using standard cleaning techniques [30,31]. Mean volume backscattering strength was binned into cells with 100 m horizontal resolution and 10 m vertical resolution down to 1060 m and 670 m for the 38 kHz and 70 kHz frequencies, respectively. The depth of the sampling was limited by the frequency of the echosounders with the 38 kHz penetrating deeper than the 70 kHz unit; but the 70 kHz unit being able to resolve smaller scatterers. The cells were vertically integrated to obtain the nautical area scattering coefficients (NASC) in m2/nmi2. Each 500 X 500 m grid sample was averaged horizontally to obtain one value for each 10-meter vertical depth bin (Figure 2).
Trawling was not available for accurate sizing and species identification of the organisms within the area of interest, so the NASC represents the relative biomass of scattering organisms if the daily scattering properties of the micronekton do not change significantly [15,29]. The change in volume backscattering strength ( 70 38 δ Sv − ) (dB re 1 m–1) calculated to investigate relative species composition by subtracting the 38 kHz volume backscattering strength from the 70 kHz volume backscattering strength. Frequency differencing has been used successfully in the past to determine species composition based on frequencydependent backscatter characteristics of organisms [29,32,33].
Analysis
All statistical analyses were done using R 3.0.1 [34]. Micronekton formed discrete scattering layers that were defined by the 15th percentile threshold of the NASC median values of each vertical depth bin for all the data collected. Two layers were defined using this technique, a shallow scattering layer (SSL) and a deep scattering layer (DSL). A mixed- effects model from the lme4 package [35], was used to test the difference between the shallow and deep layer (“Layer” parameter) NASC values when whales were present and absent (“Whale” parameter), with the variance of the random intercept of sample location (“αi”). The log (NASC + 1) was tested for the different locations (i = 1, …, 4). The “Whale” parameter for equations 1 - 3 equated to 1 for whales foraging presence and 0 for the control and the β parameter for each equation was the intercept.

The vertical structural differences of the scattering layers were identified using a Generalized Additive Mixed Model (GAMM) from the gamm4 package [36]. The GAMM equation is detailed below with a separate smoother function applied to the depth bins for the foraging and control samples

The random factor “αi” accounted for the variation between the four sites. “Depth” was the depth of the NASC value at the 10-meter vertical depth bins. The categorical variable “Whale” represents the different treatments with whale foraging presence and the control. A smoothing function was applied to both whale treatments (“k”). Again “i” denotes the different locations sampled (i = 1, …, 4). A Generalized Additive Model (GAM) from the mgcv package [37] was used to identify the change in species composition for the four locations separately.

The dB difference ( 70 38location δ Sv − ) was tested separately for each location. The 70 38location δ Sv − was calculated by Sv of 70 kHz minus the Sv of 38 kHz signal. The “Depth” parameter is the depth for each 10-meter vertical depth bin, while “Whale” was the forging presence and control. A smoothing function was applied for each whale treatments (“k”). The patchiness of the backscatter (Sv) was assessed using the index of aggregation (IA) which is high when small areas are denser then the surrounding areas. This metric was calculated from the backscatter using the Eco Metrics Python script developed by and described in Urmy et al. [38].
Results
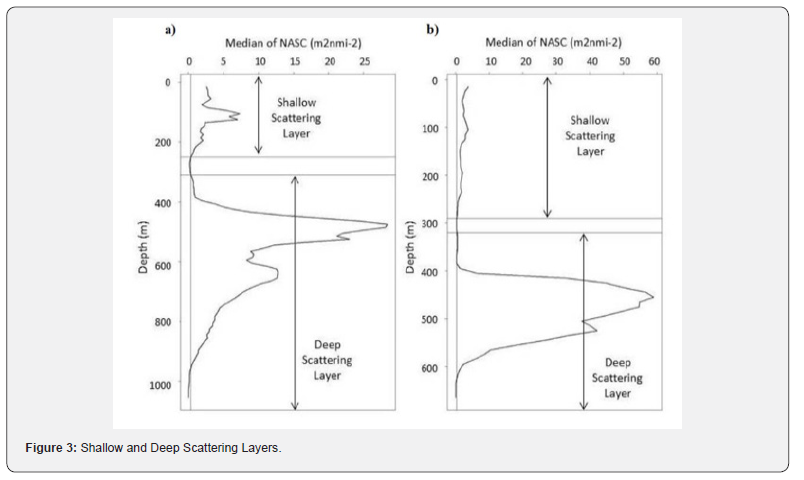
The backscatter at the sampling locations formed two discrete layers varying in depth ranges for the two frequencies. The 38 kHz scattering layers were from 0 – 250 meters for the SSL and 310 – 1060 meters for the DSL; whereas, the 70 kHz scattering layers were from 0 – 290 meters for the SSL and from 320 – 670 meters for the DSL. These layers were defined based on the median threshold of the NASC value at 0.3412 m2/nmi2 for the 38 kHz signal and 0.3496 m2/nmi2 for the 70 kHz signal.
Shallow and Deep Scattering Layers
The separation of the daytime shallow (SSL) and deep (DSL) scattering layer for: a) 38 kHz and b) 70 kHz frequencies. The median threshold used to define the scattering layers for each frequency was denoted by a vertical line at 0.3412 m2/nmi2 for the 38 kHz signal and 0.3496 m2/nmi2 for the 70 kHz signal. For the 38 kHz, the SSL was defined from 0 – 250 m and the DSL was defined from 310 – 1060 m. The 70 kHz SSL and DSL were defined from 0 – 290 m and from 320 – 670 m, respectively. NASC values were calculated for locations containing foraging short-finned pilot whales once on June 23, 2013 (PW0), twice on February 19, 2014 (PW1 and PW2), and once on February 20, 2014 (PW3). Four controls were collected at each of the study sites, as close to the same time of day as the whale surveys but sometimes limited by other cruise tasks. The date and time of data collection is summarized in Table 1 and visualized in (Figure 3).

38 kHz Backscatter
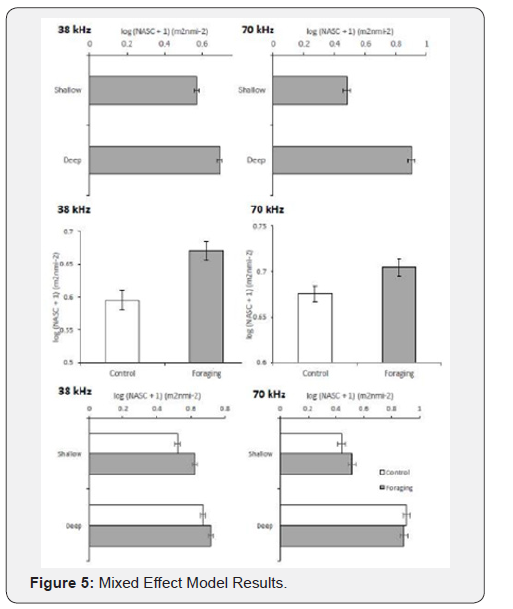
The 38 kHz backscatter (Sv; units: dB re 1 m-1) values plotted in color as a function of depth (m) and the distance along the fine scale grid sample (m) for each location: PW0, PW1, PW2, and PW3. The Sv values are represented in the color bar to the right of each graph. The more green and yellow the color the higher the backscatter; conversely, the greyer the color the lower the backscatter. Accounting for sampling location variability, there were higher NASC values in the deep scattering layer than the shallow layer for both the 38 kHz (GLMM: χ2 = 339.685, p < 0.0001) and the 70 kHz (GLMM: χ2 = 2143.797, p < 0.0001) frequencies Figure 4. This relationship was expected because fewer scattering organisms are in the SSL during the daytime. The inverse is seen at nighttime after a subset of the DSL organisms migrate towards the surface [39]. In past trawl samples off the Island of Oahu, approximately 90% of the mean total micronekton standing stock biomass was found deeper than 400 m during the daytime [39, 40]. The NASC values for scattering organisms was higher during foraging surveys than during control surveys for both frequencies: 38 kHz (GLMM: χ2 = 113.720, p < 0.0001) and 70 kHz (GLMM: χ2 = 6.884, p = 0.009) Figure 4. However, the difference in scattering strength for the 70 kHz was less pronounced most likely due to the depth limit of 670 meters. The interaction between the scattering layer and whale presence for both frequencies, 38 kHz (GLMM: χ2 = 17.817, p < 0.0001) and 70 kHz (GLMM: χ2 = 26.747, p < 0.0001), was highly significant suggesting a mixed pattern of effects. The 38 kHz shallow and deep scattering layers had higher NASC values during foraging than control. The backscatter was visually higher in the SSL and DSL for all locations during foraging compared to the control Figure 4. However, for the 70 kHz signal only the shallow scattering layer had significantly higher NASC values during foraging. There was no difference in NASC values in the defined deep scattering layer at 70 kHz.

Mixed effect Model Results
The left column contains the graphs of the 38 kHz frequency and the right column is the 70 kHz frequency. The top graphs are the shallow scattering layer versus deep scattering layer test. The middle graphs are the test of the control versus foraging for the log of NASC. The bottom graph is the interaction test of control and foraging for each scattering layer. For this plot, the control is colored white and the foraging samples are in grey. A significantly higher NASC during foraging (38 kHz: GAMM: t= 5.225, p < 0.0001; 70 kHz: GAMM: t = 18.73, p < 0.0001) was found when not separating the data into their respective layers but by investigating the water column’s vertical distribution of the scattering organisms while still accounting for sampling location variability for both frequencies.
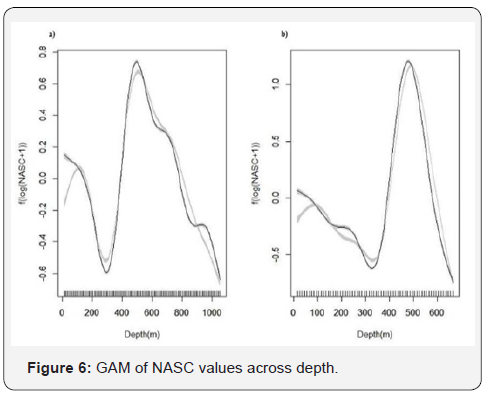
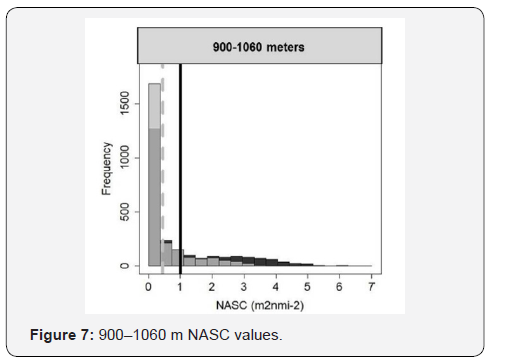
The smoother of the 38 kHz data identified an increase in NASC from about 900 – 1060 meters during foraging as denoted by the black line in Figure 5. This is further demonstrated by the histograms of the NASC values for this depth range where mean and maximum NASC values are greater for the foraging samples than the control. Furthermore, in Figure 5, locations PW2 and PW3 clearly show an extension of the DSL past 900 m only during foraging and location PW1 shows an extension past 800 m only during foraging. The depth of the bottom of the DSL is shallower for the control at PW0, PW1, and PW3 locations. This relationship was not seen in the 70 kHz results due to depth limitation. The vertical structure smoothers for both frequencies identified a shallowing of the deep scattering layer for the foraging samples with a peak at about 515 meters shifting to about 495 meters for the 38 kHz and 495 m shifting to 475 m for the 70 kHz signal. There was also a greater maximum NASC value for the foraging samples at about 500 meters for both frequencies when compared to the control samples (Figure 5).
GAM of NASC values across Depth
Generalized additive model with a smoother of depth as a function of the log (NASC + 1) for a) 38 kHz and b) 70 kHz signal. The foraging smoother is denoted by the black line and the grey is the control. Tick marks on the x-axis correspond to the sampling distribution. The grey shading indicates two times the standard error for each smooth function (Figure 6).
900 – 1060 m NASC Values
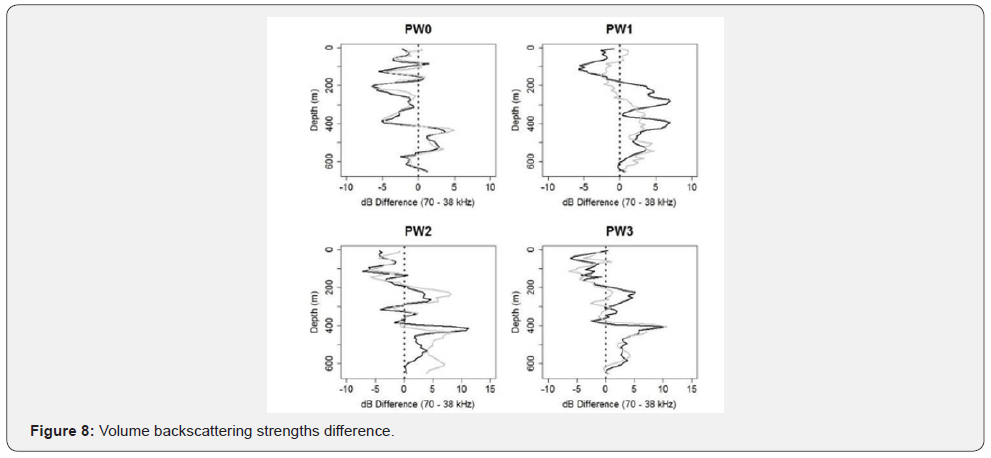
Histogram of the NASC values for the depth range from 900 – 1060 meters. The control histogram in grey is plotted on top of the foraging samples in black. The mean for the control samples is represented by the grey dashed line and the foraging mean is denoted by a black solid line. The composition of the scattering layers was investigated using the Sv (dB re 1 m-1), “dB difference,” of the 70 kHz frequency minus the 38 kHz. The mean of the dB difference across depth varied for the four locations Figure 7. There did not appear to be a clear pattern other than a strong positive peak from about 400 – 500 meters at the four locations. There was a strong daily variation of the mean for the four locations with the offshore location, PW0, having what appears to be the least daily variation even with one of the larger time differences between the control and foraging samples for this location Figure 7. Modeling the data for the four locations, when comparing the whale foraging to the control, there was a significant daily variation for all four locations: PW0: GAM: t = -17.25, p ≤ 0.0001; PW1: GAM: t = 3.933, p ≤ 0.0001; PW2: GAM: t = -41.76, p ≤ 0.0001; PW3: GAM: t = 17.63, p ≤ 0.0001. While the modeled smoothers of the dB difference for all four locations were significantly different from the control, the trend of the offshore location (PW0) seemed to vary less than the three near-shore locations (PW1, PW2, and PW3) (Figure 7).
Volume Backscattering Strengths Difference
The mean of the volume backscattering strengths (dB) difference between the 70 and 38 kHz frequency across depth. The black lines indicate the foraging samples and the grey is the control for the four locations: PW0, PW1, PW2, and PW3(Figure 8).
GAM of 70 38location δ Sv
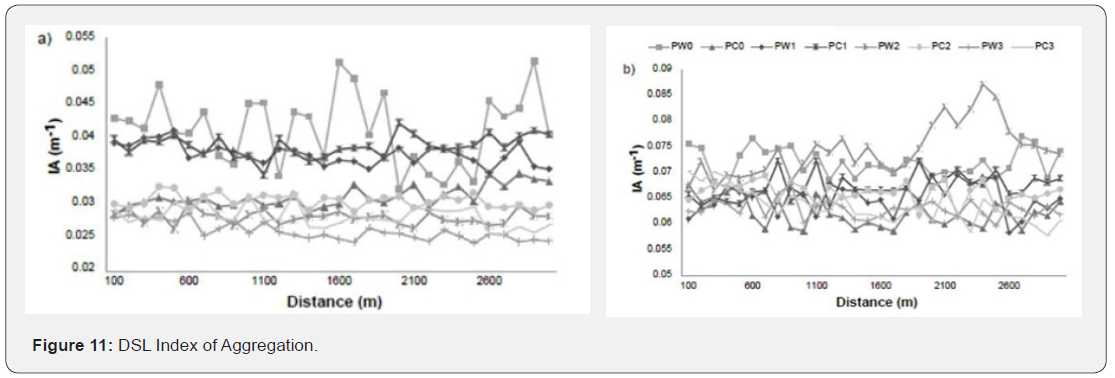
Generalized additive model (GAM) smooth functions of the mean of the volume backscattering strengths (dB) difference of the 70 and 38 kHz frequency across depth. The black lines indicate the foraging samples and the grey is the control for the four locations: PW0, PW1, PW2, and PW3. Tick marks on the x-axis correspond to the sampling distribution. The grey shading indicates two times the standard error for each smooth function. The patchiness of the backscatter was assessed using the index of aggregation (IA). Higher IA values indicated more vertical patchiness with backscatter densities being higher over a smaller area when compared to other areas. For the 38 kHz and 70 kHz frequencies, the water column and DSL IA values for each location varied drastically. The highest level of patchiness from surface to 1060 m for the 38 kHz frequency was found at location PW1 when whales were absent (PC1) with a value of 0.0359 m-1. The lowest value of 0.0193 m- 1 was recorded at PW3 when whales were present (PW3). The 70 kHz frequency showed a different relationship with location PW2 when whales were present having the highest IA value of 0.0694 m-1 calculated from 0 – 670 m (PW2) and PW0 when whales were absent having the lowest value of 0.0371 m-1 (PC0). For the DSL only, the highest level of patchiness for the 38 kHz occurred at PW0 site when whales were present (PW0) with a value of 0.0515 m-1 and the lowest value was recorded at PW3 when whales were present with a value of 0.0242 m-1 (PW3). For the 70 kHz, the highest level of DSL patchiness was at PW2 location when whales were present (PW2) and the lowest value was 0.0578 m-1 at PW3 when whales were absent (PC3). For all calculations except the 38 kHz from surface to 1060 m, the highest IA occurred when whales where present in the area (Figure 9).

Water Column Index of Aggregation
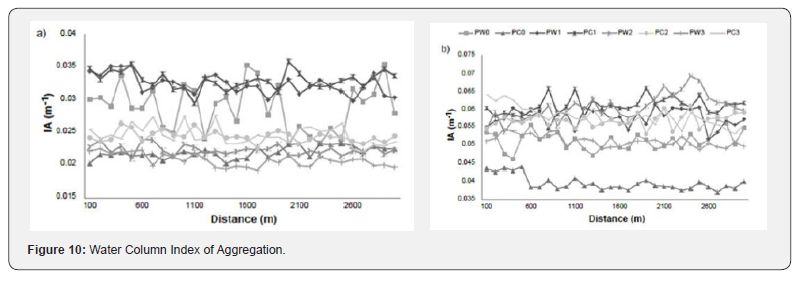
The index of aggregation from surface to depth for the a) 38 kHz and b) 70 kHz frequencies for the four locations 0 - 1. PW indicates a sample when whales were present, and PC is a sample when whales were absent. The IA was calculated from 0 – 1060 m for the 38 kHz and from 0 – 670 m for the 70 kHz (Figure 10).
DSL Index of Aggregation
The index of aggregation of the DSL for the a) 38 kHz and b) 70 kHz frequencies for the four locations 0 - 1. PW indicates a sample when whales were present, and PC is a sample when whales were absent. The IA was calculated from 310 – 1060 m for the 38 kHz and from 320 – 670 m for the 70 kHz (Figure 11).
Discussion
>Foraging short-finned pilot whales in the leeward waters off the Island of Hawaii appear to temporally select areas when there is higher backscatter of organisms detected for both the 38 kHz and 70 kHz frequency data. Increase of backscatter along a wide spectrum of frequencies indicates higher relative biomass. Due to thresholding, backscatter at both frequencies is mostly due to micronekton. Based on past studies, myctophids are the major component of the micronekton [39,40], that make up the diet of the prey of pilot whales which consists mostly of cephalopods [19-20,41-44]. During whale foraging there was an increase of micronekton in the water column detected by both frequencies. These results were similar to other results documented in and around the Hawaiian Islands. Abecassis et al. [18] found that short-finned pilot whales were attracted to areas with increased biomass of organisms that scatter sound at 70 kHz. Abecassis et al. [18] additionally found the whales were attracted to areas with increased biomass of scattering organism in the 38 kHz, and Hazen and Johnston [45], found that they were attracted to areas with higher 38 kHz scatterers south of the Main Hawaiian Island (MHI) chain probably because their prey were attracted to this increased backscatter.
The results of this study show that micronektonic organisms formed discrete scattering layers like the distribution found in another study [18], in the waters of the Island of Hawaii. For this study, the scatterers were grouped into an SSL and a DSL based on the detections in the data from the 38 and 70 kHz echosounders. The depth of the layers varied depending on the recording frequency; with the 38 kHz SSL was defined from 0 – 250 m and the DSL from 310 – 1060 m; whereas, the SSL detected by the 70 kHz echosounder was from 0 – 290 m and from 320 – 670 m for the DSL. These layer depths were also comparable to those of another study in the leeward waters of Hawaii Island reported in Abecassis et al. [18]: SSL was 0 – 250 m and DSL was 375 – 665 m (70 kHz) or 375 – 725 m (38 kHz). The DSL was slightly shallower in this study, which might be due to the limited horizontal spatial range of the data. The intent of this study was to have a limited spatial range to focus on temporal changes instead of the spatial differences.
While the increase in the SSL detected at 38 kHz and 70 kHz and the DSL detected at 38 kHz organism backscatter indicated foraging whales’ preference, it is interesting that the 70 kHz backscatter from the DSL organisms did not seem to indicate foraging preference. We believe this is due to the depth limitation of the 70 kHz frequency of 670 meters. This depth is shallower than the average depth range of the foraging whales during the daytime. Based on tagged whales in the Hawaiian Islands, shortfinned pilot whales make regular deep dives up to 1296 meters [46], with deepest dives recorded during the day with depths averaging between 600 - 800 m [47]. Additionally, the shorter wavelength at 70 kHz allowed for higher resolution than at 38 kHz permitting the detection of smaller organisms and these smaller organisms might not be as biologically relevant to the short-finned pilot whales and but maybe to their prey.
While past studies have identified potential “hotspots” in the MHI that might attract foraging short-finned pilot whales [18], they did not assess daily variation in prey distribution and abundance or the ability of the whales to exploit this potential temporal variability, or the response of these layers to foraging whales. Our analysis shows that there was a significant daily variation in micronekton at the same location, both abundance and composition. Further the whales foraged when micronekton abundance was greater, an expected pattern based on previous studies [18,45]. The variation of behavior in response to temporal patchiness of prey has been documented in pinnipeds, specifically the Antarctic fur seals (Arctocephalus gazelle), whose prey (krill) form patches [48]. It has also been documented in dolphins, specifically spinner dolphins (Stenella longirostris), whose prey (small fishes, shrimps, and squid) also form discrete patches [5, 49,50]. Fur seals can change the temporal variability of their dives in relationship to the spatial pattern of their prey and spinner dolphins are able to vary their behavior based on the diurnal vertical and horizontal migration of their prey [5,48].
In addition to high temporal variation in backscatter of the layers, the vertical structure of the layers varied daily. To the authors’ knowledge, this study was the first attempt to directly measure the structure of the scatterers during short-finned pilot whale foraging. Other studies have analyzed the relationship between deep divers and overall biomass, DSL biomass [18,51], or surface layer biomass. While results of this study suggest that overall relative biomass of micronekton is highly variable and their specific composition might attract foraging whales, there may be characteristics of the vertical structure that also influence the distribution of short-finned pilot whales in Hawaiian waters. The highest levels of patchiness in the DSL were recorded during whale foraging suggesting that high patchiness of micronekton might be attracting more prey of the odontocetes. Additionally, the shallower distribution of the DSL could make the potential prey more accessible, thus attracting whales. Another reason for this vertical structure change could be due to the scatterers avoiding the foraging whale which typically dive to depths deeper than this shallowing DSL depth of about 495 meters for the 38 kHz 366 signal and 475 m for the 70 kHz signal seen in this study [46,47].
The authors saw an increase in the DSL backscatter during foraging for the depth from about 900 to 1060 meters. The average dive depth during the day of tagged pilot whales is from 600 to 800 m [47] which is right above the depth of increased DSL backscatter. While the recorded dive depths are shallower than the depth of higher backscatter, the whales have been recorded to dive deeper [46,52], suggesting they can target the higher biomass in this depth during foraging. Additionally, the increase of backscatter below the dive depth might be due to micronekton avoidance or being chased by the echolocating whales. Micronekton have been observed to dive deeper when startled by manned submersible (Drazen, pers. comm.); therefore, it wouldn’t be farfetched to assume that these micronekton might be swimming deeper to avoid the foraging whales resulting in higher backscatter below the foraging depth when whales are present.
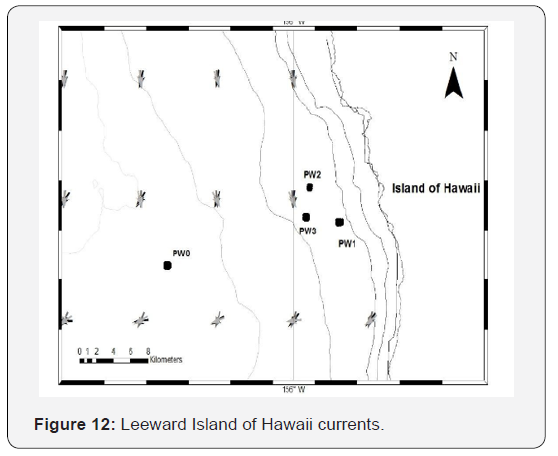
The composition of the scattering layers showed high daily variability. Myctophids, a documented prey item of large cephalopods eaten by pilot whales [19-20,41-44], make up a large component of the deep scattering layer off the Island of Hawaii [40] and have been documented to have a different δ Sv than other organisms [32,53,54]. Since we found a change in positive and negative values between the samples collected during whale foraging and the control, we can conclude that the composition varied between the samples. However, it is hard to generalize what species were present because the micronekton is comprised of a diverse array of species and the only study in Hawaiian waters comparing the 70 38 δ Sv − were of micronekton in very shallow or surface waters and not at depth [53, 54]. The depth and orientation of the different species can affect the backscatter values. It will be important for future studies to compare the 70 38 δ Sv − and trawl composition to have a better understanding of how differing concentrations of the different species will affect the 70 38 δ Sv − values recorded. There was some concern that the changes in composition might be due to changes in the current structure at our sampling locations. However, reviewing the currents in the sampling area during the dates of sampling showed a consistent pattern which did not vary temporal leading to the assumption that ocean currents are not driving this relationship.
Leeward Island of Hawaii Currents
The ocean surface currents in the sample area with the dates sampled overlaid on top of one another, February 19 is in black, February 20 in dark grey, and February 21 is in light grey. There was minimal variability in direction and magnitude over the sampling dates. The currents were obtained from the daily NRL HYCOM + NCODA Global 1/12-degree model from http:// coastwatch.pfeg.noaa.gov/ (Figure 12).
There was not a clear pattern of scattering layer composition relative to the presence of foraging whales. Another deep diving odontocete, Cuvier’s beaked whales off southern California, appear to have the ability to detect and exploit the different composition in the deep scattering layers by preferring habitats with a higher amount of larger squid clustered together [55]. A similar pattern might arise for short-finned pilot whales if the sample size is increased or if there is better sampling of the composition of the scattering layer at the foraging depth either through trawling or with high frequency in situ acoustic methods [56].
The daily variation of organism composition was less apparent at the offshore site (PW0) even with the larger time delay between samplings with the near shore sites having higher variability (PW1, PW2, and PW3). The authors speculate that this variation between sites might be due to the proximity of the coast of Hawaii Island. The Island of Hawaii has a mesopelagic boundary community (MBC) near shore that is different in composition to the offshore locations [17]. The MBC is comprised of a distinct composition of fish, shrimp, and squid that is different from the pelagic deep scattering layer [16]. Potentially this nearshore MBC organism composition could be more variable than the offshore DSL. To have a better understanding of this, it would be important to conduct daily trawl sampling at depth for these locations offshore and near shore to see if the MBC composition is truly more variable than the oceanic DSL.
This paper suggests that specific changes in amount of backscatter and vertical distribution of micronektonic organisms in the scattering layers influence foraging short-finned pilot whales’ behavior. This study also indicates that the short-finned pilot whales can exploit the temporal variability along with the spatial patchiness of their prey and their prey’s forage as documented in Abecassis et al. [18] along Hawaii Island’s Kona coast. Future research should examine the vertical structure as well as species composition of scattering layers when trying to understand the appeal of the area to foraging deep diving odontocetes
Acknowledgement
The authors thank the officers, crew, scientists, and volunteers of the R/V Oscar Elton 427 Sette and the R/V Falkor for their assistance with data collection. Specifically, the authors 428 thank Jessica Chen for training the marine mammal observers that assisted with spotting the 429 short-finned pilot whales, Ali Bayless for helping with the passive acoustic system deployment, and Reka Domokos for providing acoustic input.
References
- Thompson JN (1978) Within-patch structure and dynamics in Pastinaca Sativa and resource availability to 434 a specialized herbivore. Ecology 59(3): 431-639.
- Pickett STA, White PS (1985) The ecology of natural disturbance and patch dynamics. In: 436 Academic Press, New York, USA.
- Delcourt HR, Delcourt PA, III TW (1983) Dynamic plant ecology: The spectrum of vegetational change 438 in space and time. Quaternary Science Reviews 1: 153-175.
- Steele JH (1978) Spatial pattern in plankton communities. In: Plenum Press, New York, USA.
- Benoit-Bird KJ, Au WWL (2003) Prey dynamics affect foraging by a pelagic predator (Stenella 441 longirostris) over a range of spatial and temporal scales. Behavioral Ecology and Sociobiology 53(6): 364-373.
- Woodworth PA, Schorr GS, Baird RW, Webster DL, McSweeney DJ, et al. (2012) Eddies as offshore foraging grounds for melon-headed whales (Peponocephala electra). Marine Mammal Science 28(3): 638-647.
- Seki MP, Polovina JJ, Brainard RE, Bidigare RR, Leonard CL, et al. (2001) Biological enhancement at cyclonic eddies tracked with GOES thermal imagery in Hawaiian waters. Geophysical Research Letters 28(8): 1583-1586.
- Landry MR, Decima M, Simmons MP, Hannides CC, Daniels E (2008) Mesozooplankton biomass and grazing responses to Cyclone Opal, a subtropical mesoscale eddy. Deep Sea Research Part II: Topical Studies in Oceanography 55(10): 1378-1388.
- Best PB, Shaughnessy PD (198) First record of the melon-headed whale, Peponocephala electra, from South Africa. Annals of the South African Museum 11(1): 23-34.
- Sekiguchi K, Klages NTW, Best PB (1992) Comparative analysis of the diets of smaller odontocetecetaceans along the coast of southern Africa. South African Journal of Marine Science 12(1): 843-861.
- Spitz J, Cherel Y, Bertin S, Kiszka J, Dewez A, et al. (2011) Prey preferences among the community of deep-diving odontocetes from the Bay of Biscay, Northeast Atlantic. Deep Sea Research Part I: Oceanographic Research Papers 58(3):273-82.
- Doty MS, Oguri M (1956) The Island Mass Effect. J Cons 22:33-37.
- Gilmartin M, Revelante N (1974) The ‘island mass’ effect on the phytoplankton and primary production of the Hawaiian Islands. Journal of Experimental Marine Biology and Ecology 16(2):181-204.
- Gove JM, McManus MA, Neuheimer AB, Polovina JJ, Drazen JC, et al. (2016) Near-island biological hotspots in barren ocean basins. Nature Communications 7: 10581.
- Domokos R (2009) Environmental effects on forage and longline fishery performance for albacore (Thunnus alalunga) in the American Samoa Exclusive Economic Zone. Fisheries Oceanography 18(6): 419-438.
- Young RE (1983) Oceanic bioluminescence: An overview of general functions. Bulletin of Marine Science 33(4): 829-845.
- Reid SB, Hirota J, Young RE, Hallacher LE (1991) Mesopelagic-boundary community in Hawaii: micronekton at the interface between neritic and oceanic ecosystems. Marine Biology 109(3): 427-440.
- Abecassis M, Polovina J, Baird RW, Copeland A, Drazen JC, et al. (2015) Characterizing a foraging hotspot for short-finned pilot whales and Blainville’s beaked whales off the west side of the Island of Hawai with tagging and oceanographic data. PLoS One 10(11): 1-22.
- Clarke MR (1996) Cephalopods as Prey. III. Cetaceans. Philosophical Transactions: Biological Sciences 351(1343):1053-1065.
- Pauly D, Trites AW, Capuli E, Christensen V (1998) Diet composition and trophic levels of marine mammals. ICES Journal of Marine Science 55(3): 467-481.
- Clarke MR (1996) The role of cephalopods in the world's oceans: general conclusions and the future. Philosophical Transactions of the Royal Society-Ser B-Biological Sciences 351(1343): 1105.
- Phillips KL, Jackson GD, Nichols PD (2001) Predation on myctophids by the squid Moroteuthis ingens around Macquarie and Heard Islands: stomach contents and fatty acid analyses. Marine Ecology Progress Series 215: 179-89.
- Ohizumi H (2002) Dietary studies of toothed whales: A review and new topics. Fisheries science 68: 264-267.
- Markaida U, Sosa-Nishizaki O (2003) Food and feeding habits of jumbo squid Dosidicus gigas (Cephalopoda: Ommastrephidae) from the Gulf of California, Mexico. Journal of the Marine Biological Association of the UK 83(3): 507-22.
- Parry M (2006) Feeding behavior of two ommastrephid squids Ommastrephes bartramii and Sthenoteuthis oualaniensis off Hawaii. Marine Ecology Progress Series 318:229-35.
- Baumann-Pickering S, Simonis AE, Oleson EM, Baird RW, Roch MA, et al. (2015) False killer whale and short-finned pilot whale acoustic identification. Endangered Species Research 28(2): 97-108.
- Foote KG, Vestnes G, Maclennan DN, Simmonds EJ (1987) Calibration of acoustic instruments for fish density estimation: a practical guide. ICES Cooperative Research Report 144: 1-81.
- Demer DA, Berger L, Bernasconi M, Bethke E, Boswell K, et al. (2015) Calibration of acoustic instruments. ICES Cooperative Research Report 326: 1-133.
- Simmonds J, MacLennan DN (2005) Fisheries Acoustics: Theory and Practice. In: (2nd edn). Blackwell Publishing, UK, p. 456
- Echoview software (2013), Echoview Software Pty. Ltd., Hobart, Australia.
- De Robertis A (2007) Higginbottom I. A post-processing technique to estimate the signal-to-noise ratio and remove echosounder background noise. ICES Journal of Marine Science 64(6):1282-1291.
- De Robertis A, McKelvey DR, Ressler PH (2010) Development and application of an empirical multifrequency method for backscatter classification. Canadian Journal of Fisheries and Aquatic Sciences 67(9): 1459-1474.
- Fernandes PG, Korneliussen RJ, Lebourges-Dhaussy A, Massé J, Iglesias M, et al. (2006) The SIMFAMI project: Species identification methods from acoustic multifrequency information. Final report to the EC i-486.
- R Development Core Team (2014) R: A language and environment for statistical computing. R Foundation for Statistical Computing, Vienna, Austria.
- Bates D, Maechler M, Bolker B, Walker S (2015) Fitting linear mixed-effects models using lme4. Journal of Statistical Software 67(1): 1-48.
- Wood S, Scheipl F (2014) gamm4: Generalized additive mixed models using mgcv and lme4. R package version 02-3.
- Wood SN (2006) Generalized Additive Models: An introduction with R. In: (2nd edn) Chapman and Hall, CRC press, US.
- Urmy SS, Horne JK, Barbee DH (2012) Measuring the vertical distributional variability of pelagic fauna in Monterey Bay. ICES Journal of Marine Science: Journal du Conseil 69(2): 184-96.
- Maynard SD, Riggs FV, Walters JF (1975) Mesopelagic micronekton in Hawaiian waters: faunal composition, standing stock, and diel vertical migration. Fishery Bulletin 73(4): 726-36.
- Drazen JC, De Forest LG, Domokos R (2011) Micronekton abundance and biomass in Hawaiian waters as influenced by seamounts, eddies, and the moon. Deep Sea Research Part I: Oceanographic Research Papers 58(5): 557-66.
- Seagars DJ, Henderson JR (1985) Cephalopod remains from the stomach of a short-finned pilot whale collected near Santa Catalina Island, California. Journal of Mammalogy 66(4): 777-779.
- Sinclair EH (1992) Stomach Contents of Four Short-Finned Pilot Whales (Globicephala Macrorhynchus) from the Southern California Bight. Marine Mammal Science 8(1): 76-81.
- Clarke M, Goodall N (1994) Cephalopods in the diets of three odontocete cetacean species stranded at Tierra del Fuego, Globicephala melaena (Traill, 1809), Hyperoodon planifrons Flower, 1882 and Cephalorhynchus commersonii (Lacepede, 1804). Antarctic Science-Institutional Subscription. 6(2): 149-154.
- Gannon DP, Ready AJ, Craddock JE, Mead JG (1997) Stomach contents of long‐finned pilot whales (Globicephala melas) stranded on the US mid‐Atlantic coast. Marine Mammal Science 13(3): 405-418.
- Hazen EL, Johnston DW (2010) Meridional patterns in the deep scattering layers and top predator distribution in the central equatorial Pacific. Fisheries Oceanography 19(6): 427-33.
- Andrews RD, Schorr GS, Baird RW, Webster DL, McSweeney DJ, et al. (2011) New satellite-linked depth-recording LIMPET tags permit monitoring for weeks to months and reveal consistent deep nighttime feeding behavior of short-finned pilot whales in Hawai‘i. Poster presentation at the Fourth International Science Symposium on Bio‐logging, Hobart, Tasmania.
- Baird RW, McSweeney DJ, Heithaus MR, Marshall GJ (2003) Short-finned pilot whale diving behavior: deep feeders and day-time socialities. Abstract submitted to the 15th Biennial Conference on the Biology of Marine Mammals, Greensboro, Carolina.
- Boyd I (1996) Temporal scales of foraging in a marine predator. Ecology 77(2): 426-434.
- Norris KS, Dohl TP (1979) Behavior of the Hawaiian Spinner Dolphin'Stenella longirostris'(Schlegel,1841). DTIC Document.
- Benoit-Bird KJ, Au WWL (2009) Cooperative prey herding by the pelagic dolphin, Stenella longirostris. J Acoust Soc Am 125(1): 125-137.
- Hazen EL, Nowacek DP, St Laurent L, Halpin PN, Moretti DJ (2011) The relationship among oceanography, prey fields, and beaked whale foraging habitat in the Tongue of the Ocean. PLoS One 6(4): 1-10.
- Aguilar Soto N, Johnson MP, Madsen PT, Diaz F, Dominguez I, et al. (2008) Cheetahs of the Deep Sea: Deep Foraging Sprints in Short-Finned Pilot Whales off Tenerife (Canary Islands). Journal of Animal Ecology 77(5): 936-947.
- Au WW, Benoit-Bird KJ (2008) Broadband backscatter from individual Hawaiian mesopelagic boundary community animals with implications for spinner dolphin foraging. J Acoust Soc Am 123(5):2884-2894.
- Benoit-Bird KJ (2009) The effects of scattering-layer composition, animal size, and numerical density on the frequency response of volume backscatter. ICES Journal of Marine Science 66(3): 582-93.
- Benoit-Bird KJ, Southall BL, Moline MA (2016) Predator-guided sampling reveals biotic structure in the bathypelagic. Proc Biol Sci 283(1825): 20152457.
- Giorli G, Au WW (2017) Combining passive acoustics and imaging sonar techniques to study sperm whales' foraging strategies. The Journal of the Acoustical Society of America 142(3): 1428.


