Modelling the Marine Microplastic Distribution from Municipal Wastewater in Saronikos Gulf (E. Mediterranean)
Kalaroni S, Hatzonikolakis Y, Tsiaras K, Gkanasos A and Triantafyllou G*
Hellenic Centre for Marine Research, Institute of Oceanography, Greece
Submission:January 02, 2019; Published:January 25, 2019
*Correspondence author: Triantafyllou George, Hellenic Centre for Marine Research, Institute of Oceanography, 46.7 km Athens-Sounio Ave, PO Box 712 Anavyssos, Attica, GR-190 13, Greece.
How to cite this article: Kalaroni S, Hatzonikolakis Y, Tsiaras K, Gkanasos A, Triantafyllou G. Modelling the Marine Microplastic Distribution from Municipal Wastewater in Saronikos Gulf (E. Mediterranean). Oceanogr Fish Open Access J. 2019; 9(1): 555752. DOI:10.19080/OFOAJ.2019.09.555752
Abstract
A three-dimensional hydrodynamic model is coupled with a Lagrangian-Individual Based Model to simulate the floating microplastics (<300μm) dispersal and transport in the Saronikos Gulf. Considering municipal wastewaters as their main source, simulations were carried out over 2011–2012. A comparison with hydrodynamic observational data has shown that the model qualitatively reproduces the main circulation structure and hydrodynamic features. To explore the fate and distribution of microplastics, model results were analyzed taking into account the seasonal variability of near-surface circulation. Simulation results gave a qualitative description of affected areas from microplastics pollution, suggesting that the most affected part of Saronikos Gulf is the coastal area that extends from Psitallia Waste water treatment plant to the east. Despite some limitations, this is a first model attempt to explore the dispersal and distribution of microplastics in the Saronikos Gulf.
Abbrevations: WWTP: Wastewater Treatment Plants; IBM: Individual Based Model; SI: Super-Individuals; GEBCO: General Bathymetric Chart of the Oceans; ΜDT: Mean Dynamic Topography; SLA: Sea Level Anomalies; SSH: Sea Surface Height
Introduction
Most of the world’s marine pollution comes from the land according to the Joint Group of Experts on the Scientific Aspects of Marine Environmental Pollution [1], while the 60-80% of marine pollutants are made of plastics [2]. Microplastics are plastic particles with diameter less than 5 mm, originating from the breakdown of larger plastic pieces and also from a variety of substances, such as personal care products and textiles, entering the ocean mainly from wastewater treatment facilities [3-5]. Many studies have shown that microplastics can be ingested by numerous marine organisms [6-10], due to their small sizes and large volume-to-surface area ratio. Furthermore, recently microplastics have been detected in human stools [11].
A significant population growth has occurred in Mediterranean coastal regions (from 95 million in 1979 to 143 million in 2000) [12], due to both touristic and industrial activities, contributing to an increased plastic pollution of the marine environment. Wastewater Treatment Plants (WWTP) are an effective solution towards the reduction of microplastics input to the marine environment, showing retention efficiencies that may reach ~99% [13]. However, given the very large amount of wastewater discharge from the major coastal cities and the significant number of smaller cities that still lack of wastewater treatment facilities, a considerable amount of microplastics is released into the marine environment, especially smaller particles (<3mm) for which the treatment is less efficient.
Saronikos Gulf is a semi enclosed area that receives an increased load of wastewater from the populous city of Athens (>4 million inhabitants), especially through the WWTP of Psitallia. To assess the current status of plastic pollution, identifying the main pathways and accumulation areas of marine microplastics in Saronikos Gulf, a modelling tool has been developed and applied to simulate the dispersion and pathways of microplastics, after their release from WWTPs.
Materials and Methods
Model description
A Lagrangian Individual Based Model (IBM) is on-line coupled with the three dimensional (3-D) hydrodynamic Princeton Ocean Model [14,15], which provides ocean currents and diffusion coefficients (horizontal and vertical) that are used for the transport of the Lagrangian particles.
The hydrodynamic model: POM is a primitive equation, time-dependent, free surface and sigma-coordinate 3-D circulation model that has been extensively described in the literature and is accompanied by a comprehensive user’s guide [16]. It is a widely spread community model that has been used both for coastal and open ocean studies [17-22]. POM prognostic variables are temperature, salinity, velocity, sea surface height and turbulent kinetic energy. The model uses a bottom-following sigma coordinate system and an Arakawa-C staggered grid in the horizontal. The vertical eddy viscosity and diffusivity coefficients are computed using the Mellor-Yamada 2.5 turbulence closure scheme [23], while horizontal diffusion is calculated along sigmalevels following a Smagorinsky formulation [24]. Time integration is performed with a split (external/internal) time step.
Langrangian-IBM plastic dispersion model: The Lagrangian-IBM plastic dispersion model is based on Pollani et al. [24] and follows the concept of Super-Individuals (SI) for computational efficiency. Each SI represents a group of particles, sharing the same attributes (position, weight, origin, type of plastic etc.). The position of every SI is described by its coordinates (x, y, z) in a Cartesian system, which are updated every time-step using the 3-D displacement produced by currents and waves, obtained by bi-linear interpolation at the SI location (x, y, z)

where uc, vc and wc are the ocean current velocity field components, obtained (on-line) from the hydrodynamic model. The terms uw and vw represent the wave stokes drift, obtained (offline) from POSEIDON operational wave model (www.poseidon. hcmr.gr).
This is assumed to decrease exponentially with depth as follows:

where uw0 and vw0 represent the stokes drift at surface, k is the wave number and Z is the depth of the water column. The stochastic horizontal displacement (Rx, Ry) of particles depends on the horizontal diffusion as follows:
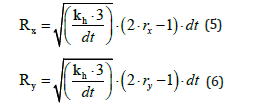
where Kh is the horizontal diffusion, obtained from the hydrodynamic model and the terms rx and ry represent random numbers between [0, 1]. The stochastic vertical displacement (Rz) is derived as:

where kz is the vertical turbulent diffusion, obtained from the hydrodynamic model, rz represents a random number between [0, 1] and Κw is the vertical displacement from wave that decays exponentially with depth as follows:

where Wh is the significant wave height, while Wt and k are the wave period and number, respectively.
Sources: Microplastics inputs in the Saronikos Gulf through wastewater treatment facilities were estimated, considering the wastewater discharge from all coastal cities with more than 2000 inhabitants. Inputs data were obtained from UNEP/MEDPOL 2011 report. The amount of microplastics in the wastewater, depending on the type of treatment, was estimated using available data from the literature. Untreated wastewater was assumed to contain ~450.000 particles/m3 [13] with size varying between 20μm and 300μm. The microplastics concentration was assumed to decrease by 25% and 75% respectively, when primary and secondary treatment is applied, based on existing studies [25,26]. A slightly lower (10%) decrease was applied for pre-treatment and a slightly higher (85%) for tertiary treatment. Recent studies report efficiencies up to 98%, although these are often related to additional filtering, such as reverse osmosis.
Model setup
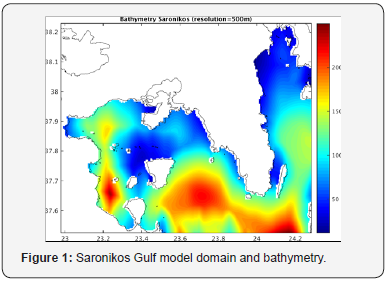
The 3-D coupled hydrodynamic-Lagrangian-IBM model domain covers the entire Saronikos Gulf (2.9792ο Ε to 24.3844ο Ε and 37.5250ο Ν to 38.2292ο Ν) Figure 1, with a resolution of 1/240o ×1/240o (~500 ×500m) in the horizontal and 24 sigma-levels in the vertical, following a logarithmic distribution approaching the surface and bottom layers. The General Bathymetric Chart of the Oceans (GEBCO; www.gebco.net) was used to build the model bathymetry using bi-linear interpolation into the model grid. The atmospheric forcing (10m wind speed, 2m air temperature, 2m relative humidity, precipitation, incoming long-wave radiation and net short-wave radiation) was obtained from the POSEIDON atmospheric dataset [27]. The initial conditions for temperature and salinity were obtained from simulations of the 3D operational POSEIDON hydrodynamic model for the Aegean Sea [28,29]. The Saronikos Gulf plastic dispersion model has a south-eastern open boundary, where boundary conditions for temperature, salinity and ocean current velocity were also obtained from the operational POSEIDON Aegean model. The Lagrangian-IBM model was initialized with a homogeneous distribution of microplastics of 0.5 *106 particles/km2. After a 3-year model spin-up, a simulation with the 3-D on-line coupled model was performed over 2011-2012 period.
Hydrodynamic observational data
The observational data that were used for the model validation of the Saronikos Gulf hydrodynamics are Mean Dynamic Topography (ΜDT, spatial resolution: 0.0625ο X 0.0625ο) for the 1993-2012 period, obtained from the European AVISO+ altimetry data base [30], and daily Sea Level Anomalies (SLA, spatial resolution: 0.125ο X 0.125ο) that were obtained from the European Copernicus data base (http://marine.copernicus. eu/). Additionally, satellite remote sensing daily Sea Surface Temperature data (SST, spatial resolution: 0.04ο X 0.04ο) were used, obtained also from the Copernicus data base [31,32]. To compare with the model outputs, all satellite data were interpolated at the model grid.
Results and Discussion
Model validation against satellite hydrodynamic data
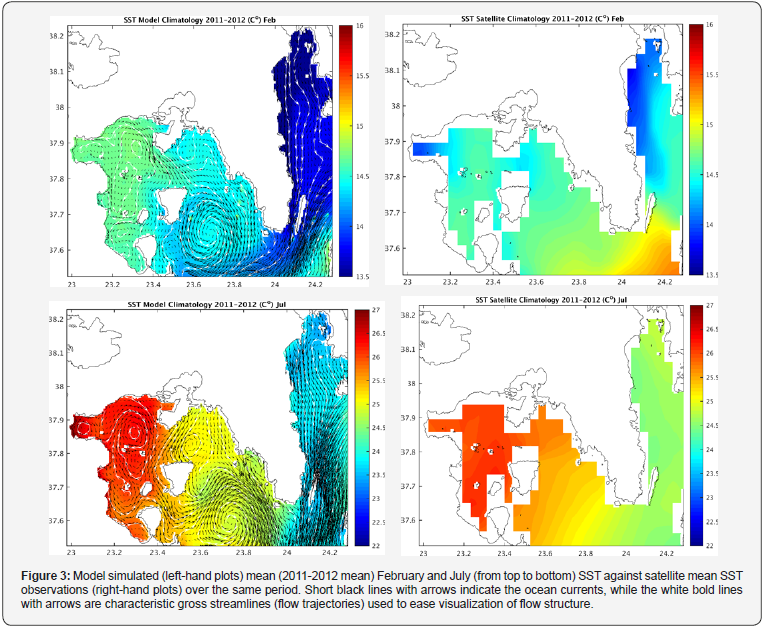
In Figures 2 and 3, the model simulated mean February and July, SST and sea surface height (SSH), for the 2011-2012 period, are compared against satellite data over the same period. The near-surface circulation of Saronikos Gulf is also overlapped. A general west-to-east flow is observed during both winter (February) and summer (July), which is consistent with in situ measurements of Kontoyiannis [32]. The eastward flow, following a broad anticyclonic loop in the north-western sub-basin, forms a cyclonic meander in the north-eastern area of Saronikos Gulf. The main flow exits to the south forming a closed anticyclonic loop in the south-eastern sub-basin.
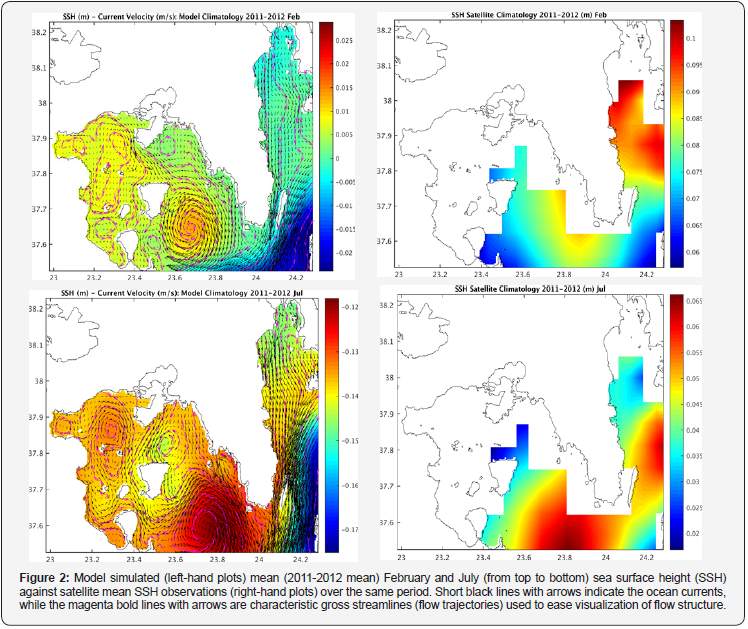
A more quantitative validation of the simulated near-surface circulation can be obtained comparing the model simulated SSH pattern with satellite altimetry data, given that low/high SSH areas represent cyclonic/anticyclonic flows. Our results show that the model captures quite well the observed SSH pattern Figure 2, although a model deviation from the observed values was produced. Given the Mediterranean basin scale SSH variability, differences between simulated and observed absolute values are expected. Nevertheless, the model simulates the main SSH horizontal variability. More specifically, the simulated southern anticyclone (indicated by high SSH) is consistent with the observed one, with a slight westward displacement. Although satellite observations are limited in the north-eastern sub-basin, the model captures the decrease of SSH. Finally, in the western sub-basin, an increase of SSH is simulated, which is associated with the anticyclonic loop.
The model successfully reproduces the observed spatial variability of the Saronikos SST characterized by an eastward decreasing gradient Figure 3, associated with the inflowing colder Aegean waters. The north-western area is occupied by relatively warmer waters due to the anticyclonic flow, while inside the north-eastern cyclonic meander the surface temperature is colder. In the southern anticycloclic loop, the colder blob indicates that it contains cold water quantities of Aegean Sea origin. Simulated SST is quite close to the satellite observations during both winter (February) and summer (July) period. However, the model tends to underestimate the southern SST during wintertime, which can be attributed to the underestimated simulated inflowing Aegean waters. A slight overestimation is also simulated in the northwestern anticyclonic loop, which is probably related to the coastal upwelling that is not simulated by the model [33,34].
Preliminary results of microplastics distribution
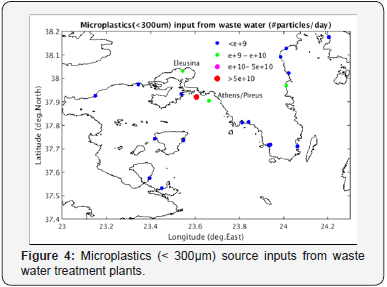
The simulated distributions appear to be significantly affected by both the source mapping and the mean nearsurface circulation. The input of microplastics from municipal wastewaters in the Saronikos Gulf is shown in Figure 4, with the most important source being the Psitallia WWTP. Moreover, there is a contribution of microplastics from the open boundary with the Aegean Sea, mainly during February and March. The seasonal microplastics concentration, overlapped with the near-surface (0 – 5m) currents, are shown in Figure 5. For 2011 winter, the strong south -westward current with inflowing Aegean waters, turned into a strong westward current inside the basin that ended to an anticyclone in the western sub-basin, while in the central sub-basin, a relatively weaker current was simulated but with the same anticyclonic pattern [34]. This resulted to an entrapment of the pollutants to the north-eastern and southern parts of the Saronikos Gulf. During spring, the anticyclonic circulation in the western and central area of the Gulf became stronger, strengthening the microplastics dispersion from Psitallia WWTP to the west. However, microplastics concentration in the northeastern sub-basin remained high.
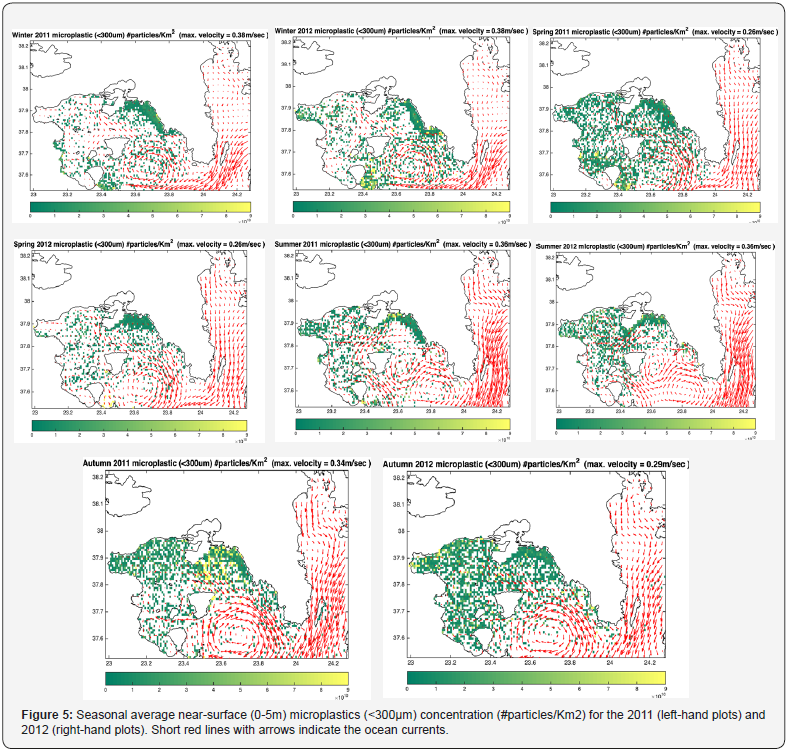
The summer microplastics distribution pattern resembled that of spring, though some difference could be found due to the weakening of the cyclonic circulation east of the Psitallia WWTP. Finally, during autumn microplastics concentration was increased in the north-eastern and the western sub-basin. This is mainly attributed to the strong anticyclonic structure of the near-surface circulation that tends to accumulate microplastics in the western sub-basin. In the second year of the simulation (2012), the seasonal microplastics distribution is quite similar to that of the first. The main differences can be related to the increasing microplastics concentrations due to the previous year’s contributions. This is apparent in all seasons except for spring, which can be attributed to the 2012 May, where the western anticyclone that spreads microplastics from the source to the western sub-basin, is weakened in comparison to that of the same period of 2011.
Conclusion
In the present study, a 3-D coupled hydrodynamic-Lagrangian- IBM model was developed and applied to simulate the microplastics (< 300 μm) distribution of municipal wastewaters origin in the Saronikos Gulf. Hydrodynamic features were validated against satellite data and historic in situ observations. Due to the lack of available in-situ data, microplastics dispersion was qualitatively described, based on the near-surface circulation. We should note that microplastics with diameter less than 300 μm have been proved difficult to be measured in the field, since the sampling nets that are commonly used, have a net-mesh size larger than 300 μm.
The analysis of a 2-year simulation output of the 3-D coupled model (2011-2012) qualitatively reproduces the main hydrodynamics and gives an overall description of microplastics distribution in the Saronikos Gulf. On average, the model simulated hydrodynamics are in line with the observed structure of the near-surface circulation. Bearing in mind that microplastics dispersion is mainly depended on the near-surface circulation, dispersion model results can be considered as a preliminary qualitative description of affected areas from microplastics pollution. Additionally, model results have shown that the most affected area of the Gulf is the coastal area that extends from Psitallia WWTP to the east. This part of the Saronikos Gulf exhibits a microplastics accumulation during the entire year, mainly due to its proximity to the WWTP and the lack of strong permanent currents that would transport pollutants off-shore.
However, there are certain limitations in the model, which have been identified. The microplastics input from municipal wastewaters is just an estimation based on literature, and thus may suffer from significant uncertainties. Therefore, the initial concentration of microplastics that were dispersed in the marine environment, could be overestimated. Additionally, inputs from other sources (rivers load, coastal and marine human activities, fragmentation of larger particles etc.) have not been taken into account. Moreover, the biofouling effect on microplastics is missing from the model, while this seems to have a countable contribution to their sinking. Recently, Kaiser et al. [33] have proved that biofouling changes the buoyancy of microplastics, causing their sinking to lower levels of the water column. Furthermore, the permanent anticyclonic flow in the southern open boundary of the basin would normally result into an accumulation of microplastics. However, this had the opposite effect on microplastics distribution, which is attributed to the computational domain that not includes the whole area where the southern-east anticyclonic loop is formed. Finally, future comparisons with observations are clearly necessary to confirm the model results, which emphasizes the need for a more systematic in situ sampling of microplastics in the marine environment. This will help to a better calibration of the model and a further examination of the pollutant’s distribution in the Saronikos Gulf.
The 3-D coupled hydrodynamic-langragian-IBM model presented here is a first attempt to simulate the dispersal and distribution of microplastics in the Saronikos Gulf. The model shows real promise for the future and will form the basis of several theoretical and modelling studies on marine plastic pollution. Preliminary simulation results suggest that the proposed 3-D model approach can be considered as a valuable tool to describe the current status of microplastic pollution in the Saronikos Gulf and contribute to risk assessment solutions.
Acknowledgement
This work was funded under the EU project CLAIM (Cleaning Litter by developing and Applying Innovative Methods in european seas, H2020 Grant agreement ID: 774586) and the national project GLAFKI - KRIPIS (Blue growth with innovation and application in Greek Seas, MIS: 5002438). We would like to thank Kontoyannis Harilaos for his valuable contribution in the hydrodynamic model results analysis.
References
- GESAMP (1991) The State of the Marine Environment. In: Blakewell Scientific Publications, London, Pp. 128
- Moore CJ (2008) Synthetic polymers in the marine environment: A rapidly increasing, long-term threat. EnvironmentalResearch 108(2): 131-139.
- McCormick A, Hoellein T, Mason S, Schluep J, Kelly J (2014) Microplastic is an Abundant and Distinct Microbial Habitat in an Urban River. Environ Sci Technol 48(20):11863-11871.
- Napper I, Bakir A, Rowland S, Thompson R (2015) Characterisation, quantity and sorptive properties of microplastics extracted from cosmetics. Mar Pollut Bull 99(1-2): 178-185.
- Blair R, Waldron S, Phoenix V, Gauchotte-Lindsay C (2017) Microand Nanoplastic Pollution of Freshwater and Wastewater Treatment Systems. Springer Science Reviews 5(1-2): 19-30.
- Cole M, Lindeque P, Fileman E, Halsband C, Goodhead R, et al. (2013) Microplastic Ingestion by Zooplankton. Environmental Science & Technology 47(12): 6646-6655.
- Romeo T, Pietro B, Pedà C, Consoli P, Andaloro F, et al. (2015) First evidence of presence of plastic debris in stomach of large pelagic fish in the Mediterranean Sea. Marine Pollution Bulletin 95(1): 358-361.
- Van Cauwenberghe L, Claessens M, Vandegehuchte M, Janssen C (2015) Microplastics are taken up by mussels (Mytilus edulis) and lugworms (Arenicola marina) living in natural habitats. Environmental Pollution 199: 10-17.
- Digka N, Tsangaris C, Torre M, Anastasopoulou A, Zeri C (2018) Microplastics in mussels and fish from the Northern Ionian Sea. Marine Pollution Bulletin 135: 30-40.
- Wieczorek A, Morrison L, Croot P, Allcock A, MacLoughlin E, et al. (2018) Frequency of Microplastics in Mesopelagic Fishes from the Northwest Atlantic. Frontiers in Marine Science 5.
- Hoffmann T, Williams J, Fischer H, Lelieveld J, Crowley J N (2018) Direct measurement of NO3 radical reactivity in a boreal forest. Atmospheric Chemistry and Physics 18(5): 3799-3815.
- UNEP/MAP (2011) Inventory of municipal wastewater treatment plants of coastal Mediterranean cities with more than 2,000 inhabitants (2010). In: UNEP(DEPI)/MED WG.357/Inf.7, Greece, Pp. 225
- Talvitie A, A Mikola, O Setala, M Heinonen (2017) How well is microlitter purified from wastewater? A detailed study on the stepwise removal of microlitter in a tertiary level wastewater treatment plant. Water Research 109: 164-172.
- Blumberg A F, Mellor G L (1983) Diagnostic and prognostic numerical circulation studies of the South Atlantic Bight. JGR Oceans 88(C8): 4579-4592.
- Blumberg A F and Mellor G L (1987) A description of a threedimensional coastal ocean circulation model. American Geophysical Union 4.
- Mellor GL (2002) Users guide for a three-dimensional, primitive equation, numerical ocean model. Ocean Model 8544: 710.
- Zavatarelli M, Mellor GL, Zavatarielli M, Mellor GL (1995) A numerical study of the Mediterranean Sea circulation. J Phys Oceanogr 25: 1384- 1414.
- Lascaratos A, Nittis K (1998) A high-resolution three-dimensional study of intermediate water formation in the Levantine Sea. JGR Oceans 103(C9), 18 497-18 511.
- Korres G, Lascaratos A (2003) An eddy resolving model of the Aegean and Levantine basins for the Mediterranean Forecasting System Pilot Project (MFSPP): implementation and climatological runs. Analles Geophysicae Part I 21: 205-220.
- Zavatarelli M, Pinardi N (2003) The Adriatic Sea modelling system: a nested approach, Annales. Geophysicae 21: 345-364.
- Kourafalou V H, K Tsiaras (2007) A nested circulation model for the North Aegean Sea. Ocean Science 3: 1-16.
- Topper R P M, P Th Meijer (2015) Changes in Mediterranean circulation and water characteristics due to restriction of the Atlantic connection: A high-resolution ocean model. Climame of the Past 11(2): 233-251.
- Mellor, GLT Yamada (1982) Development of a turbu- lence closure model for geophysical fluid problems. Review of Geophysics 20(4): 851-875.
- Smagorinsky J (1963) General circulation experiments with the primitive equations: I. The basic experiment. Weather Rev 91: 99-164.
- Pollani A, Triantafyllou G, Petihakis G, Konstantinos N, Dounias K, et al. (2001) The Poseidon operational tool for the prediction of floating pollutant transport. Marine Pollution Bulletin 43(7-12): 270-278.
- Kalcikova G, Alic B, Skalar T, Bundschuh M, Zgajnar Gotvaj A (2017) Wastewater treatment plant effluents as source of cosmetic polyethylene microbeads to freshwater. Chemosphere 188:25-31.
- Papadopoulos A, Kallos G, Katsafados P, Nickovic S (2002) The Poseidon weather forecasting system: an overview. The Global Atmosphere and Ocean Systems 8: 219-237.
- Nittis K, L Perivoliotis, G Korres, C Tziavos, I Thanos (2006) Operational monitoring and forecasting for marine environmental applications in the Aegean Sea. Environmental Modelling and Software 21(2): 243- 257.
- Korres G, Nitti K, Perivoliotis L, Tsiaras K, Papadopoulos A, et al. (2010) Forecasting the Aegean Sea hydrodynamics within the POSEIDON-II operational system. J Oper Oceanogr 3: 37-49.
- Rio, M H, Pascual A, Poulain P M, Menna M, Barceló B, et al. (2014) Computation of a new mean dynamic topography for the Mediterranean Sea from model outputs, altimeter measurements and oceanographic in situ data. Ocean Science 10: 731-744.
- Buongiorno Nardelli B, Tronconi C, Pisano A, Santoleri R (2013) High and Ultra-High resolution processing of satellite Sea Surface Temperature data over Southern European Seas in the framework of MyOcean project. Remote Sensing of Environment 129(15): 1-16.
- Pisano A, Buongiorno Nardellia B, Tronconia C, Santoleria R (2016) The new Mediterranean optimally interpolated pathfinder AVHRR SST Dataset (1982-2012). Remote Sensing of Environment 176: 107-116.
- Kontoyiannis H (2010) Observations on the circulation of the Saronikos Gulf: a Mediterranean embayment sea border of Athens, Greece. JGR Oceans 115(c6).
- Kaiser D, Kowalski N, Waniek J (2017) Effects of biofouling on the sinking behavior of microplastics. Environmental Research Letters 12: 124003.
- Petihakis G, Triantafyllou G, Tsiaras K (200) Eastern Mediterranean biogeochemical flux model—simulations of the pelagic ecosystem. Ocean Science 5: 29-46.


