Estimation of Maximum Sustainable Harvest Levels and Bioeconomic Implications of Babylonia spirata Fisheries in Pakistan by Using CEDA and ASPIC
Muhammad Mohsin1,2, Yong Tong Mu1*, Muhammad Noman1, Yin Hengbin2 and Ana Mehak1
1College of Fisheries, Ocean University of China, Qingdao, 266003, China
2College of Economics, Ocean University of China, Qingdao, 266003, China
Submission: April 17, 2018; Published: May 18, 2018
*Correspondence author: Yong Tong Mu, College of Fisheries, Ocean University of China, Qingdao, 266003, China.
How to cite this article: Muhammad M, Yong T M, Muhammad N, Yin H, Ana M. Estimation of Maximum Sustainable Harvest Levels and Bioeconomic Implications of Babylonia spirata Fisheries in Pakistan by Using CEDA and ASPIC. Oceanogr Fish Open Access J. 2018; 7(3): 555715. DOI:10.19080/OFOAJ.2018.07.555715
Abstract
Pakistani fisheries sector is a victim of “the tragedy of the commons”. This sector performance matches with the description of Gordon-Schaefer Model. Therefore, in this study maximum economic harvest levels of B. spirata from Sindh, Pakistan are estimated by using maximum sustainable yield (MSY) proxy for maximum economic yield (MEY). For this purpose, fishery input (effort) and fishery output (catch) data of B. spirata is analyzed by using two specialized fishery software CEDA (catch and effort data analysis) and ASPIC (a stock production model incorporating covariates). Three surplus production models viz. Fox Model, Schaefer Model and Pella-Tomlinson Model were used in CEDA along with three error assumptions viz. normal error assumption, log normal error assumption and gamma error assumption. Whereas, in ASPIC two surplus production models viz. Fox Model and Logistic Model were employed for data analysis. MSY estimates for B. spirata by using CEDA and ASPIC were between 80-182t and 180-202t correspondingly. The calculated MSY range does not overlap so much. Furthermore, CEDA remained conservative in MSY estimation in contrast to ASPIC. ASPIC results showed higher values of R2. Thus, considering MSY estimates, it is concluded that for maximum economic gain target reference point for MSY in Pakistani marine waters along the Sindh coast is between 175-180t. However, harvesting of this fishery resource beyond 200t should be considered as limiting reference point which will result in economic loss.
Keywords: Babylonia spirata; MEY; MSY; Maximum economic utility; CEDA; ASPIC
Introduction
Bioeconomics emerged in close association with the advancement of fisheries economics. Fundamental theory in the science of fisheries economics was presented by a Canadian economist Scott Gordon [1]. Later on, Schaefer used these ideas to develop a mathematical model in an attempt to establish a relationship between biological growth and fishing activities. This model is known as Gordon-Schaefer model (GSM) and is the basic model of bioeconomics. The maximum capacity of the environment to support the highest fishery stock biomass (B) is referred to as carrying capacity (K). At K, the growth rate of the fishery stock virtually becomes zero. Figure 1 graphically represents total revenue of the fishery with a constant price. In this figure, parabola corresponds to either equilibrium amount of fishing effort or the equilibrium of B. The straight line represents total cash flow when the operating and fixed costs are constant. The slope of this line is equal to the cash flow per fishing effort. Economic rent is represented by the difference of the cost line and revenue curve. This economic rent is supposed to be derived from the fishery stock. The highest difference between the cost line and revenue curve is regarded as the BMEY. At BMEY, the value of economic rent is the maximum. The point at which revenue curve is intersected by the cost line is known as the open access equilibrium (OAE).
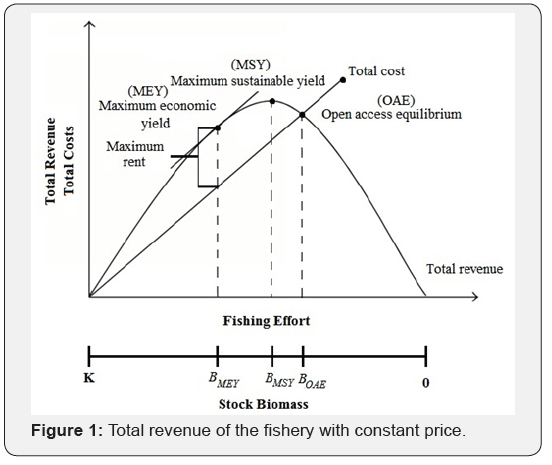
Fishing effort and B at this point are known as FOAE and BOAE respectively. When the fishing effort is greater than FOAE, fishermen shall earn a handsome profit and it may result in the expansion of fishing effort. On the other hand, when the fishing effort is lesser than FOAE economic loss will occur which may compel marginal fishermen to leave fishery. The location of BOAE as compared to BMSY depends upon the price of the fish. At OAE, revenue equals to the costs resulting in the dissipation of the rent.
It has been generally believed that fishing sector can get more benefit by managing this sector it at MEY level rather than MSY level [2]. Moreover, economists have always stressed that economic yield of fishery resource shall automatically conserve it [1,3]. However, the predicted results of MEY are not witnessed until now, even in planned economies. According to Tabureguci [4], benefits of MEY over MSY are not clear. In fact, the idea of MEY relies on the individual fishing fleets ignoring the other segments of fishing industry such as processing, distribution, marketing etc. [2]. Thus, logically it pops up in our mind if fishing sector, individual boats, can make such a higher profit by running at MEY level then why fishing sector, as a whole, cannot make more profit while operating at MSY level? The imperative answer to this question is that catch goes beyond the MSY level due to open access regime [5]. Mostly, considering the economics of fishing sector we miss other part and our calculation remain confined to individual fishing fleets. Rationally thinking, fishing sector is not only composed of fishing fleets rather also includes other segments. The value added chain from sea to plate does add a lot of revenue which is usually not included in the economic calculation for fishing sector. Hundreds of value chain analysis of fishery sector through light on the merits and importance of value addition through distribution, processing and marketing [2].
Moreover, the objective of fishery management is not to maximize the profit of individual fishing fleets but to run whole fishing industry in a sustainable way. Even if the fishing is done at OAE, all the involved parties can earn normal profit [2]. Additionally, cost and price changes unavoidably result in different estimates for the MEY and effort levels. Moreover, sometimes, fishery economists and, most of the time, policymakers fail to fully understand the concept of economic efficiency of fisheries. The solution is not to target MEY and let the whole fishing sector suffer [6]. Instead, as compared to MEY, MSY is a more suitable RP for society as a whole [2].
According to the description of Christensen [2], when we consider fishing sector as a whole, neglecting the profit of individual fishing fleets, MEY becomes very close to MSY, i.e. MEY=MSY, and at this point maximum economic utility of fishery resource is generated. Thus, we have used mainly MSY in this study to estimate maximum economic utility of the Babylonia spirata fishery resource from Sindh, Pakistan.
Several researchers have computed MSY estimates of various fishery resources from Pakistani marine waters [7-11]. However, no published literature documents MSY estimates of B. spirata from Sindh, Pakistan in order to know its maximum economic sustainable contribution.
Materials and Methods
Data procurement
FI (fishery input i.e. effort) and FO (fishery output i.e. catch) statistics, 2001-2009, related to B. spirata were obtained from published fishery statistics book by Marine Fisheries Department of Pakistan viz. Handbook of Fisheries Statistics of Pakistan. It is necessary to mention that there is no published FI or FO data available after the data series, 2001-2009, used in this study related to B. spirata. Thus, this is the most recent data of this fishery resource which we have used in this study.
Data analysis
Three surplus production models (SPMs), including Schaefer Model (SM), were employed in this study to statistically analyze the time series data of FI and FO of B. spirata from Sindh, Pakistan. For this purpose, two fishery specialized software i.e. catch and effort data analysis (CEDA) [12] and a stock production model incorporating covariates (ASPIC) [13] were used. SPMs are also known as biomass dynamic models based on different assumptions which have three different versions on the behalf of three different scientists Fox Model (FM), Schaefer Model (SM) and Pella-Tomlinson (PTM). SM is the most commonly used model, which relies on a logistic population growth of the fishery stock.

While, fox and Pella-Tomlinson model are based on Gompers growth equation and generalized production equation, respectively.

Where, B stands for fish stock biomass, n is shape parameter, t represents for the time (year), B∞ is carrying capacity (K ) and r denotes population increase.
CEDA (Version 3.0.1)
CEDA computer package is a menu driven data fitting tool and has the ability to approximate customized parameters. CEDA uses a confidence interval of 95% through bootstrapping method for all the SPMs i.e. FM, SM and PTM with three error assumptions (EAs) viz. normal error assumption (NEA), log-normal error assumption (LNEA) and gamma error assumption (GEA). It requires an input of IP (B1/K i.e. starting biomass over carrying capacity). For instance, if the input value of IP is zero or close to zero its mean that data is obtained from virgin fishery stock. On the other hand, if the input value is one then it does assume that data is acquired from fully exploited fishery stock. CV (coefficient of variation) is predicted by using confidence intervals. Other key parameters expected by using CEDA are MSY (maximum sustainable yield), K, q (catchability coefficient), r (population increase) and B (biomass).
ASPIC (Version 5.0)
ASPIC software also needs an input of IP. However, in contrast to CEDA, it needs individual input files for each IP value. Two SPMs i.e. Fox Model (FM) and Logistic Model (LM) were employed by using ASPIC. FIT and BOT files, for both of the SPMs, were prepared to calculate CV for all IP values. FIT and BOT represent the program modes used in ASPIC and exists a technical difference between them. The managerial parameters are estimated by ASPIC software during FIT mode while during BOT program mode it uses bootstrapped confidence intervals with many trials for the calculation of parameters. Therefore, the finishing time of BOT mode is much higher than FIT mode. Different Important parameters approximated by using this computer package include MSY, K, q, R2 (coefficient of determination), FMSY (fishing mortality rate at MSY), BMSY (stock biomass giving MSY).
Results obtained for different parameters were considered by comparing R2 values and through the visual inspection of the graphs for model selection.
Results
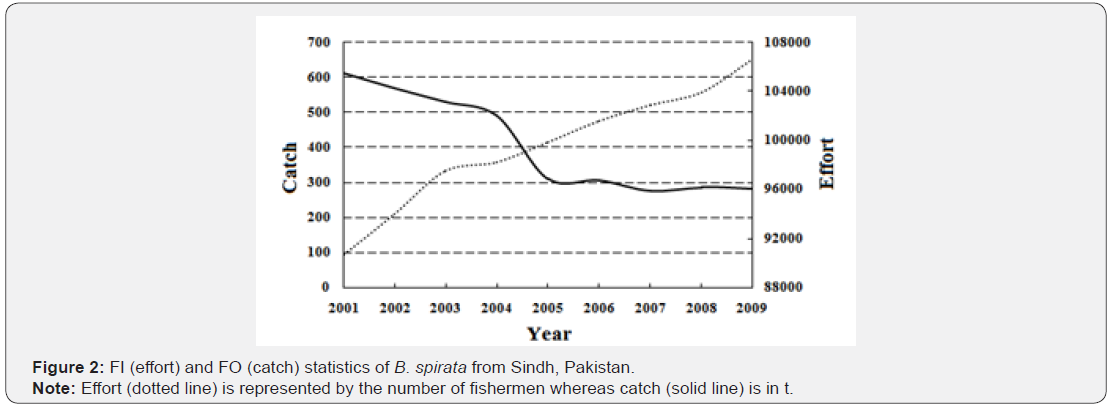
Total landed mass of B. spirata during the study period remained 3657t (tonnes). Maximum catch was observed in 2001 (612t) whereas the minimum catch quantity was recorded in 2009 (280t). The average capture production of this fishery resource remained 406ty-1. There is a deceasing trend in the capture production of this aquaticresource (Figure 2). CPUE has deceased with the passage of time during the study period starting in 2001 (0.0067) it has fallen down considerably to 2009 (0.0026) (Figure 3).
CEDA estimates
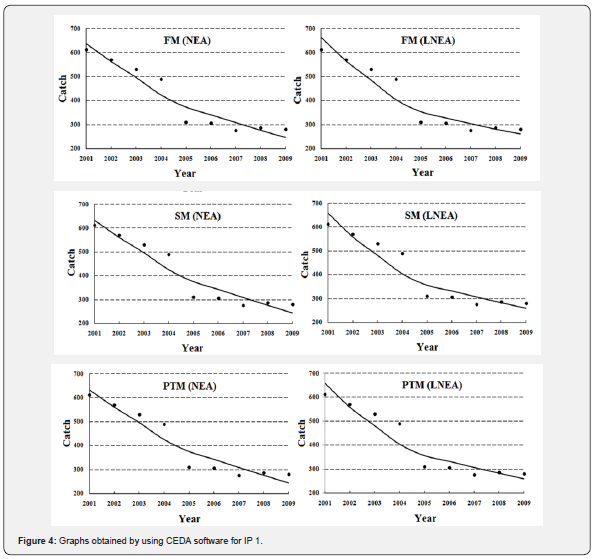
It was observed that CEDA computer package showed sensitivity towards input IP values, 0.1 to 1 (Table 1). This means for various IP values it computed different MSY estimates. For the lower IP values, this package computed the higher MSY estimates and vice versa. Such as for IP 0.1, for NEA, CEDA estimated MSY as 638t whereas for IP 1, for same EA, this software calculated MSY as 92t. Same is the case with other models i.e. SM and PTM. As compared to NEA and LNEA, GEA mostly produced MF. Graphs obtained for expected and observed catches by using CEDA computer package are presented in Figure 4. These graphs look alike however, they differ from each other in minute details.

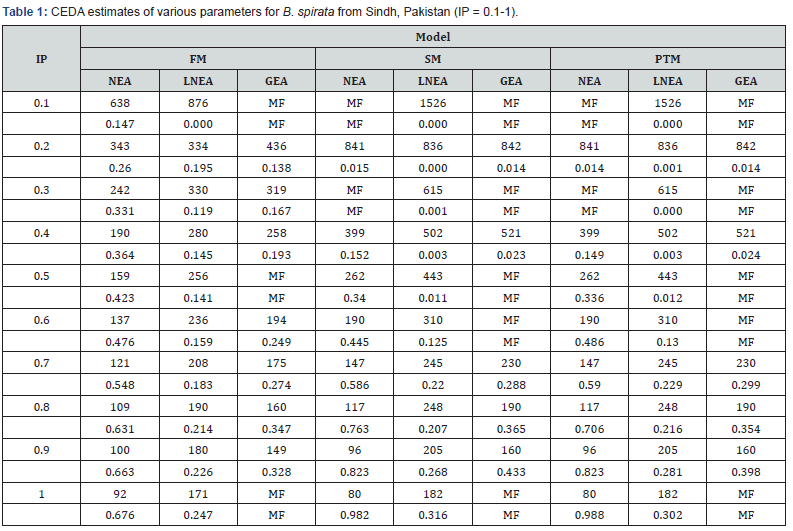
CV: coefficient of variation is written below MSY values; MF: minimization failure; 0.000: these values represent that either computed CV was exactly zero or very close to zero.
Anticipated results by using IP 1 are presented in Table 2. In FM, for NEA and LNEA, the estimated values of MSY and CV remained 92t (0.676) and 171t (0.247) correspondingly. The values of R2 for these EAs were 0.914 and 0.903 in that order. The output values of other parameters viz. K and B, for same EAs, were 4243t, 3460t and 1205t, 997t respectively. BMSY estimates, for same EAs, remained as 1561t and 1273t in that order. In all the models used in this study, GEA produced MF.

Note: MF: minimization failure; K: carrying capacity; q: catchability coefficient; r: intrinsic population growth rate; MSY: maximum sustainable yield; CV: coefficient of variation R2: coefficient of determination; BCUR: current biomass; BMSY: biomass giving MSY.
SM and PTM produced similar results for various parameters such as MSY, K, R2, B and B. Computed estimates of MSY for NEA and LNEA remained 80 t and 182t respectively. The output values of K and R2, for these EAs, remained 4285t, 3281t and 0.912 and 0.896 correspondingly. Parameters B and BMSY were computed, for these EAs, as 1194t, 933t and 2143t, 1641t respectively. Computed CV values were different for SM and PTM. In SM estimated values of CV, for NEA and LNEA, remained 0.982 and 0.316 in that order. Conversely, in PTM, CV values were 0.988 and 0.302, correspondingly.
ASPIC estimates
ASPIC estimates, for IP 1 were obtained by using two routines viz. FM and LM and are listed in Table 3. MSY estimate of FM is 180t whereas LM calculation for MSY is the higher than FM i.e. 202t. For FM computed K, FMSY and BMSY are 3246t, 0.151 and 1194t in that order. On the other hand, LM computed same parameters as 2945t, 0.137 and 1473t correspondingly. Although, the difference is very little but FM showed the higher R2 value (0.923) as compared to R2 value (0.921) of LM. Computed CV, for both the models, remained 0.194 and 0.173 respectively.

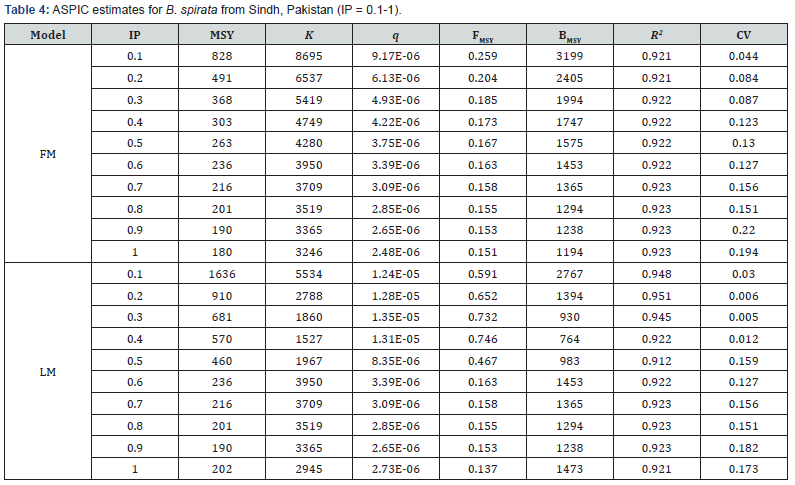
Sensitivity analysis was also performed for ASPIC computer package by using IP values from 0.1 to 1. Results of these IP values are presented in Table 4. Like CEDA this software computed MSY with the higher values against the lower IP values. For example, in FM for IP 0.1 estimated MSY value was 828t whereas for IP 1 its value was 180t. K parameter followed the same pattern like MSY. With the increase of IP value, the FMSY and BMSY showed decreasing trend (Table 4).
Discussion
Obtained results indicate that the investigated B. spirata fishery resource is over-exploited. In addition to economic losses, over-exploitation of fishery resources results into the social disorders either in the form of maximization of private profits or competitive exploitation of the common resources. These social disorders may lead to the extinction of the fishery population, particularly with low reproductive capacity and high economic value. Private owners strive to maximize their profit; therefore, exploitation status of the renewable biological resource is essential in order to continue economic benefits it possesses [17]
Apparently, fishery stock depletion is a result of an attempt to increase discounted economic gain [17]. The stage when B is lower than BMEY, as our analysis shows, there is no point of discussion about the economic benefit to reduce harvest but it depends on how quickly the affected fishery stocks are rebuilt [3]. Fishers usually do not comply with the idea of fishery stock rebuilding. Because species with fast-growth rate can rebuild their stock quickly but species with low-growth rate may take decades to rebuild them. During the process of rebuilding, transition costs indicate why fishers oppose it. In addition to fishers, stakeholders also have a disagreement with the idea of fishery stock rebuilding as they face conflict for whether they need to increase discounted economic gain, increase temporary employment or struggle for the conservation of the ecosystem [18]. Fishers and stakeholders may be attracted by suitable incentives such as the determination of harvesting rights at the community or individual level [19]. By doing so, fishers would feel secure and would be satisfied from fishery stock rebuilding. Moreover, in order to compensate transition costs for fishery stock rebuilding, intertemporal transfers may be encouraged through quota rental charge [20].
In Pakistan, fisheries sector has been a neglected agricultural sub-sector. Nevertheless, national fisheries policy, “The National Policy and Strategy for Fisheries and Aquaculture Development in Pakistan”, legislatively controls the FI and FO and aims to improve fisheries sector in Pakistan [21]. However, practical implementations of objectives stated in this policy are not witnessed in real situations. Neither, FI nor FO has been seriously monitored. Even, a published report in 2014 declares Pakistan a victim of over-capacity and over-exploitation as well. It is reported, that in Sindh, the number of operational trawlers is more than the double of recommended ones [22]. Thus, there is uncontrolled FI which has resulted in the overcapitalization of the fishing fleets. Hence, in Pakistan there exists regulated open access regime which has resulted in the over-exploitation of majority of marine fishery resources, as this study shows.
Local name of B. spirata in the Sindhi and the Balochi language is “Ghonga” [23]. This fishery resource is harvested mainly as a by-catch of shrimp trawl fishery. However, Fishing of this creature is also done by using hands [24]. Studies have shown that B. spirata is a continuous breeder and spawns throughout the year. However, peak spawning occurs during the months of February, May, September and October [25]. The closed fishing season for shrimp fishery resource is during the months of Jun and July, Act no. 1975, SRO 329(1) [22]. It means this creature is harvested, along with shrimp, during the months of peak spawning seasons, as aforementioned. Moreover, the situation becomes worse when coastal waters get polluted by the industrial effluents. Thus, the reproduction of B. spirata is affected severely resulting in decreased biomass production in coming years, as it has been witnessed in this study. Although, B. spirata spawns throughout the year at least ban should be imposed on its catch during its peak spawning season. Thus, it is the need of the hour to make such fishery policies, by involving fishery managers, which conserve this fishery resource for its long-term economic contribution.
Conclusion
MSY estimates for B. spirata by using CEDA and ASPIC were between 80-182t and 180-202t correspondingly. Here, the calculated MSY range does not overlap so much. Furthermore, CEDA remained conservative in MSY estimation in contrast to ASPIC. ASPIC results showed higher values of R2. Thus, considering MSY estimates, it is concluded that for maximum economic gain target reference point for MSY in Pakistani marine waters along the Sindh coast is between 175-180t. However, harvesting of this fishery resource beyond 200t should be considered as limiting reference point which will result in economic loss.
Acknowledgement
We are very thankful to MFD (Marine Fisheries Department) for providing numerical data. The first author is also thankful to the China Scholarship Council (CSC) for funding his PhD degree. This study was supported by China Agriculture Research System (CARS-48).
Conflict of Interest
Authors declare there is on conflict of interest.
References
- Gordon HS (1954) The economic theory of a common-property resource: The fishery. J Pol Eco 62(2): 124-142.
- Christensen V (2010) MEY = MSY. Fish and Fisher 11(1): 105-110.
- Grafton RQ, Kompas T, Hilborn RW (2007) Economics of overexploitation revisited. Science 318(5856): 1601.
- Tabureguci D (2007) Fishing: Pacific management model questioned. Wider discussions needed on options. In: Island Business International.
- Hardin G (1968) The Tragedy of the Commons. Science 162(3859): 1243-1248.
- Bromley DW (2009) Abdicating responsibility: the deceits of fisheries policy. Fisheries 34(6): 280-290.
- Mohsin M, Mu Y, Memon AM, Kalhoro MT, Shah SBH (2016) Fishery stock assessment of Kiddi shrimp (Parapenaeopsis stylifera) in the Northern Arabian Sea Coast of Pakistan by using surplus production models. Chinese J Oceanol Limnol 35(4): 1-11.
- Memon AM, Liu Q, Memon KH, Baloch WA, Memon A et al. (2015) Evaluation of the fishery status for King Soldier Bream Argyrops spinifer in Pakistan using the software CEDA and ASPIC. Chinese J Oceanol Limnol 33(4): 966-973.
- Kalhoro MA, Liu Q, Waryani B, Panhwar SK, Hussain K (2014) Growth and mortality of Brushtooth lizardfish, Saurida undosquamis, from Pakistani Waters. Pakistan J Zool 46(1): 139-151.
- Kalhoro MA, Liu Q, Memon KH, Chang SM, Abdul Nabi Jatt (2013) Estimation of maximum sustainable yield of Bombay Duck, Harpodon nehereus fishery in Pakistan using the CEDA and ASPIC packages. Pakistan J Zool 45(6): 1757-1764.
- Siyal FK, Li Y, Gao TX, Liu Q (2013) Maximum sustainable yield estimates of silver pomfret, Pampus argenteus (Family: Strometidae) fishery in Pakistan. Pakistan J Zool 45(2): 447-452.
- MRAG. 2016. CEDA Version 3. 0. Available at http://www.mrag.co.uk/ resources/fisheries-assessment-software.
- NOAA. 2016. NOAA Fisheries Toolbox, A Stock Production Model Incorporating Covariates (ASPIC). ASPIC Version 5.0. Available at http://nft.nefsc.noaa.gov/ASPIC.html.
- Schaefer MB (1954) Some aspects of the dynamics of populations important to the management of the commercial marine fisheries. Bull Inter-Am Trop Tuna Comm 1(2): 25-56.
- Fox WW (1970) An exponential surplus-yield model for optimizing exploited fish populations. Trans the American Fisher Soci 99(1): 80- 88.
- Pella JJ, Tomlinson PK (1969) A generalized stock production model. Inter-American Tropical Tuna Commission Bulletin 13(3): 416- 497.
- Clark CW (1973) The economics of overexploitation. Science 181(4100): 630-634.
- Hilborn R (2007) Defining success in fisheries and conflicts in objectives. Marine Policy 31(2): 153-158.
- Grafton RQ, Arnason R, Bjørndal T, Campbell D, Campbell HF, et al. (2006) Incentive-based approaches to sustainable fisheries. Canadian J Fisher Aqua Sci 63(3): 699-710.
- Grafton RQ (1995) Rent Capture in a Rights-Based Fishery. J Environ Ecol Manage 28(1): 48-67.
- GoP (2007) National policy and strategy for fisheries and aquaculture development in Pakistan. Ministry of Food, Agriculture and Livestock, Islamabad, Government of Pakistan, Pakistan, p. 1-13.
- Schmidt UW (2014) Fisheries policy report and recommendations for Sindh. USFIRMS Project, USAID.
- MFD (2012) Handbook of fisheries statistics of Pakistan. Marine Fisheries Department. Government of Pakistan. Fish Harbour, West wharf, Karachi, Pakistan.
- FAO (2015) Field identification guide to the living marine resources of Pakistan. Food and Agricultural Organization.
- Mohan A (2007) Eco-biology and fisheries of the whelk, Babylonia spirata (Linnaeus, 1758) and Babylonia zeylanica (Bruguiere, 1789) along Kerala coast, India. Central Marine Fisheries Research Institute, India.


