Population Structure and Genetic Diversity of the Blue Shark Prionace Glauca in the Eastern Tropical Pacific: Evidence and Conservation Implications from Mitochondrial DNA and Microsatellite Analyses
Escovar-Fadul X1*, Caballero S1, Espinoza2 and Bessudo S3
1Laboratorio de Ecologia Molecular de Vertebrados Acuaticos (LEMVA), Departamento de Ciencias Biologicas, Universidad de los Andes, Carrera 1 No 18A-10, Bogota, Colombia
2Department of Marine Research, Puerto Ayora-Isla Santa Cruz, Galapagos National Park. Ecuador
3Fundacion Malpeloy otros Ecosistemas Marinos, Colombia
Submission: March 15, 2017; Published: May 30, 2017
*Corresponding author: Escovar-Fadul X, Departamento de Ciencias Biologicas, Universidad de los Andes, Carrera 1 No 18A-10, Bogota, Colombia, Tel: 9178636700; Email: xies@sas.upenn.edu*
How to cite this article: Escovar-F X, Caballero S, Espinoza E, Bessudo S.Population Structure and Genetic Diversity of the Blue Shark Prionace Glauca in the Eastern Tropical Pacific: Evidence and Conservation Implications from Mitochondrial DNA and Microsatellite Analyses. Ocean & fish Open Access J. 2017; 2(5): 555598. DOI: 10.19080/OFOAJ.2017.02.555598
Abstract
Sharks are top predator marine species with high ecological and economical value mainly due to their trophic status and high demand for fins. The blue shark, Prionace glauca, is one of the main targets of the shark fishing industry. The application of genetic markers is key to understand the population dynamics and management of elasmobranchii species under fishing pressure. In this study, levels of mitochondrial and nuclear genetic diversity of Eastern Tropical Pacific populations of the blue shark were investigated. Results from both markers show interesting differences. mtDNA analyses indicated no significant population differentiation between population units in the Eastern Tropical Pacific and the Western Pacific. Genetic differentiation detected in the microsatellite analyses, indicated more than one blue shark stock in the Eastern Tropical Pacific (FST=0,079, P<,05). Based on the identification of genetically differentiated stocks in this area, this study provides key information for the implementation of management plans for the shark fishing industry in the region, as well as contributes with initial population information to the needed database of this threatened species.
Keywords: Molecular ecology; Shark fisheries; Fishing management; Shark conservation
Introduction
Sharks are top predator marine species, which have considerable ecological and economical value mainly due to their trophic status and the high demand for fins [1-3]. Most sharks are vulnerable to overexploitation due to their slow growth, late reproductive maturity, short longevity and low fertility [4]. The blue shark (Prionace glauca) is a wide-ranging oceanic predator and one of the main targets of the shark fishing industry [2,5]. According to studies by Domingo and collaborators [5], the percentage of blue sharks caught in elasmobranchii fishing ranges between 75 and 85% of the total capture [5]. Additionally, trade record analysis from a study developed by Clarke and collaborators [6], revealed high abundance of blue shark fins in the Hong Kong market, suggesting that blue sharks global exploitation may be exceeding the maximum sustainable yield [2,6]. The blue shark important role in marine ecology, the demand in the fish market, and the IUCN near-threatened status, are characteristics that make this species of special concern [2,7-10]. Unfortunately, there is limited historical and current data regarding blue shark migratory patterns, as well as stock assessment analysis [2,11]. Capture-recapture studies have shown that sharks may undertake extensive seasonal migrations among long-distance movements, enhancing dispersal and low population structure within and between oceans [12-14]. In the Eastern Pacific Ocean, little is known about sharks migration patterns, however, some capture-recapture studies have suggested that many of these large oceanic animals have affinity to specific areas, restricting their movement to much smaller areas than expected [1,12,15-17].
Over the last decade, advances in molecular biology have become of great importance in the identification of sharks stock populations and migration patterns [7,16,17]. These molecular tools are essential for understanding shark migration, identifying population structure and determining philopatric behaviour [15,16,18-20]. Polymorphic genetic traits among populations are very useful to identify stock structure (isolated units that show independent dynamics when using neutral markers) [21]. Differences in allele frequencies (when using nuclear markers) and haplotype frequencies (when using mitochondrial DNA markers) allow detection of neutral meaningful differences among populations; and therefore enable testing of hypotheses related to population differentiation, levels of gene-flow, and possible migration events [21]. Diverse shark population structure studies have shown that shark migrations are characterized by high dispersion and low population structure [16,18], neverthless, recent genetic studies have shown that some shark species have higher population structure than expected, mainly due to sedentary behaviour and fidelity to nursery areas [13,15,18]. Scientists agree that this pattern may be due to the cosmopolitan distribution and philopatric reproductive behavior of some shark species, such as the blue shark [13,15,17]. Ovenden and collaborators [7] in 2009 showed that there is no evidence of genetic subdivision for the blue shark in the territorial fishing zone of Australia and Indonesia, and strongly recommended more studies of population genetic structure to be undertaken for this species [7]. However, little is known about other blue shark genetic stocks, since distribution and seasonal movements have been roughly studied in other parts of the world [11,12,14,20,22], and there are no records to date of blue shark population structure studies in the in the Eastern Tropical Pacific Ocean. Currently, blue shark is one of the most fished shark species in the world, and there is limited information about its migratory patterns and history. Information on blue shark population structure is critical for the application of effective management actions in the region and worldwide. The aim of this study was to provide initial information on the genetic diversity and population structure of blue sharks in the Eastern Pacific to contribute to future studies for this species in the region. This was done by establishing levels of mitochondrial and nuclear genetic diversity in the mitochondrial DNA control region (mtDNA) and by analyses of five microsatellite loci. We also aimed to determine possible connectivity between the sampled Eastern Pacific populations and other previously studied populations in the Western Pacific.
Methods
Sample collection
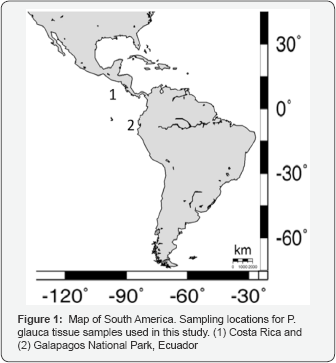
Tissue samples were collected from two areas in the Eastern Tropical Pacific, for a total of 72 P glauca samples. Of these, 63 were sampled from confiscated sharks originally fished and transported from Costa Rica to Bogota, Colombia, in late 2009. Nine tissue samples were collected in Ecuador from confiscated material that originated from illegal fishing activities in the Galapagos National Park protected area (Figure 1).
DNA extraction, amplification and sequencing
DNA was extracted using 200|il of 10% Chelex resin (BioRad) and heating at 60°C for 20 minutes, following the protocol by Hyde and collaborators [23]. The identity of the samples was confirmed by barcoding, amplifying and sequencing the cytochrome oxidase subunit 1 (COI), using the primers and protocols described by Ward and collaborators [24], and performing a BLAST in the NCBI genbank. Once the samples were confirmed as P. glauca with at least 98% similarity, a 1245 base pairs (bp) fragment of the mitochondrial (mtDNA) control region (CR) was amplified using the primers ProL2 (5' CTGCCCTTGGCTCCCAAAGC 3') and PhecacaH2 (5' CTTAGCATCTTCAGTGCCAT 3') designed by Pardini and collaborators [25]. The PCR cycling conditions were: 90s at 94°C, then 35 cycles at 94°C for 10s, annealing at 62°C for 45s and extension at 72°C for 60s, with a final extension at 72°C for 10 minutes. PCR products were purified using polyetylenglycol and sequenced at Macrogen, Korea. To compare and analyze haplotypes, we aligned approximately a 400bp consensus region of the CR with previously published sequences from the Western Pacific (16 haplotypes, FJ161689) [7] ( Supplementary Material Figure 1).
Five microsatellite loci were amplified using primers described by Ovenden and collaborators [7], applied for nontarget species (Cli107, Cli100, CT04, CT06 and Cs02) (Table I) [7]. This study used non-target species primers, since at the time this project was developed, species specific primers for P.glauca had not been developed yet [20,22]. The PCR cycling conditions were: 120s at 94°C, then 35 cycles at 94°C for 10s, annealing at 60°C for 30s and extension at 72°C for 60s, with a final extension at 72°C for 30 minutes. Loci were amplified in separate reactions and multiplexed before running them on an ABI 3100 sequencer at Universidad de los Andes in Bogota, Colombia.

Data analyses
mtDNA control region
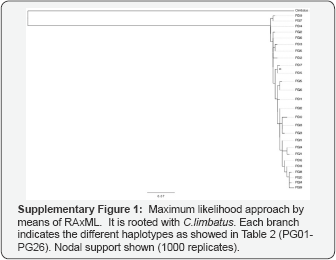
We edited and aligned the CR sequences manually using the software Geneious 5.3 (BioMatters). We determined haplotypes and numbers of variable sites using MacClade v3.08 [26]. We compared the sequences generated in this study with sequences from the Western Pacific previously published by Ovenden and collaborators [7] in order to determine shared haplotypes and genetic population units throughout the Pacific Ocean. Population structure analyses, as well as levels of haplotype diversity (h), nucleotide diversity (n) and tests for population differentiation (conventional Fst and Ost), were calculated using the software Arlequin version 3.12 [27]. The Intraspecific phylogenies among haplotypes were estimated using a maximum likelihood approach by means of RAxML [28] in the CIPRES science portal [29], using 1000 bootstrap replicates under the GTR+I+G model of evolution (Supplementary Figure 1).
Microsatellite loci
For five microsatellite loci, we first identified possible null alleles after analyzing deviations from Hardy-Weinberg equilibrium (Arlequin v 3.12, [27]). Also, we calculated the number of alleles per locus, observed Heterozygocity (Ho) and expected Heterozygocity (He). The software Structure [30] was used to estimate clusters (K) among the Eastern Tropical Pacific locations, and then to calculate population structure between the clusters suggested. Based on Structure results, an Amova analyses was performed using Fst and Rst statistics in order to test for significant differentiation among the clusters identified.
Results
mtDNA control region
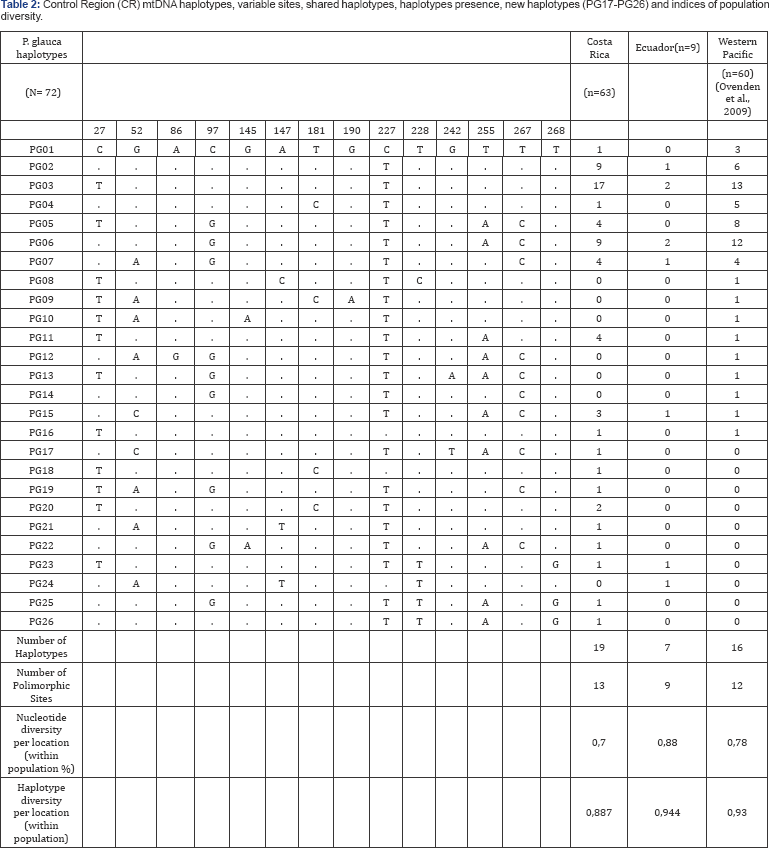
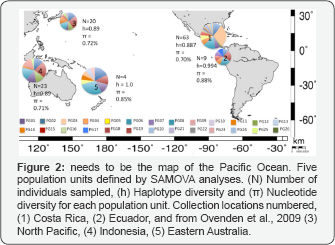
From a total of 72 P. glauca samples analyzed for the Eastern Tropical Pacific, fourteen variable sites defined 20 mtDNA CR haplotypes. When compared with data from the Western Pacific [7] a total of 26 haplotypes were identified. This means that ten new haplotypes were identified in the Eastern Tropical Pacific and ten haplotypes were shared between the Eastern Tropical Pacific and the Western Pacific. The most common haplotype (PG03) was found in every location in both studies, and some uncommon haplotypes were unique to the Eastern Tropical Pacific (PG17 to PG26) (Table 2). All sequences generated in this study (COI and CR) were submitted to genbank under accession numbers XXX to YYY. We performed a SAMOVA [31] analysis for six sample regions (including four sample regions defined by Ovenden and collaborators [7]). The largest mean Fct index was found for five populations units (Fct= 0,0745), referred to as:
1. Costa Rica,
2. Ecuador
3. Eastern Australia
4. Indonesia and Western Australia
5. North Pacific (Figure 2).
Further analyses were performed based on the population units defined. From the population differentiation indices? calculated for the CR, no significant FST and 3> were found among population units (data not shown). The phylogenetic analyses did not show evidence of population structure either, and were characterized by many different haplotypes with a low number of nucleotide substitutions (Supplementary Material Figure 1). High haplotype diversity and low nucleotide diversity were found for each population unit (Table 1). Haplotype and nucleotide diversities were similar across sampled locations and between oceans (Figure 2).
Microsatellite loci
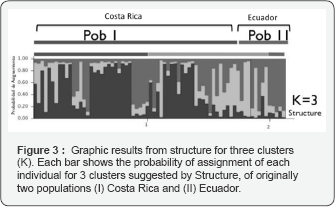
For the microsatellite analyses, five loci were scored for 72 individuals in two locations in the Eastern Tropical Pacific. We found null alleles in one locus (Cli100) and therefore it was not considered for further population structure analyses. The genetic differentiation test indicated slight overall differentiation between the Eastern Tropical Pacific sampling locations (Costa Rica and Ecuador), FST= 0,0794 (P<0.05) (Table 3). In order to further investigate possible genetic differentiation in the region, we ran a Structure analysis. This analysis suggested three clusters (K) grouping the samples from both geographic locations (Costa Rica and Ecuador), but the probability of assignment for every individual in each group did not show evidence of strong population structure (Figure 3). We separated individual samples in each of the three clusters, considering the highest assignment probability obtained to each of these clusters, and we analyzed population differentiation among the three clusters, using the program Arlequin v 3.11, [27]. From the population differentiation indices calculated, no significant FST was found among population units. However, significant RST differentiation was found between cluster 1 and 2, and between cluster 1 and 3 but not between cluster 2 and 3.
Discussion
This study focuses on the population structure of the blue shark in the Eastern Tropical Pacific based on the analyses of two different molecular markers, the mtDNA control region and five microsatellite loci. Results from both markers showed interesting differences. Because P. glauca is an offshore or truly pelagic shark, we did not expect to find strong population subdivision. The expectation was for low genetic subdivision between populations because of their long-distance migration capabilities [7]. mtDNA is maternally inherited and it has been shown to have a low mutation rate in sharks [32]. On the other hand, microsatellite are biparentally inherited, have higher mutation rates compared to mtDNA, and analyses are based on allele frequencies. From analyzing both markers together it is possible to get an idea of the evolutionary history and levels of gene flow found between and among stocks of blue sharks in the Pacific Ocean. For mtDNA analyses we compared haplotype and nucleotide diversity between population units in the Western Pacific and Eastern Tropical Pacific. Haplotype diversity indices were slightly higher in the Eastern Pacific, with low nucleotide diversity indices. Also, this tendency was observed in both locations sampled in this study, as well as in the study by Ovenden and collaborators [7]. Additionally, when comparing haplotype and nucleotide diversity of P. glauca with genetic diversity values of other pelagic shark species, it is possible to identify similar genetic diversity values among pelagic species around the world [17,18 21,25].
When analyzing the obtained sequences, and identifying the different haplotypes, we found ten new haplotypes in the Eastern Tropical Pacific that have not been previously reported for this species in the Western Pacific. These haplotypes may be unique to this area or they may not have been sampled yet in the Western Pacific. Ten haplotypes were shared between the two oceans and six were unique to the Western Pacific. For mitochondrial DNA, no significant FST were found among population units defined for the whole Pacific Ocean (Western and Eastern Pacific) (Supplementary Material Table 1). This could be due to a) historical or present gene flow occurring between areas in the Pacific Oceans or b) due to low mutation rates in shark mtDNA (approx 0,31%/my) there has not been enough time for mitochondrial haplotypes to differentiate significantly between these two geographic regions [33]. This theory is also supported by the haplotype and nucleotide divergences values found for mtDNA, showing high variability in haplotypes but extremely low variability in base pair changes (Figure 2 and Supplementary Material Figure 1). However, it is likely that these results are the combination of two situations: low mutation rate and high migration capacity [33-35]. The hypothesis of high migration capacity described by Stevens et al. (2010) [14] suggests that blue sharks are moving within the ocean, but not between oceans [14], contradicts our findings. However, regarding the different hypothesis, it is not possible to conclude if the levels of gene flow currently reflected in this marker come from present or past migration events. On the other hand, when analyzing four microsatellite loci, we obtained slight population differentiation (Fst=0,07924, P<0,05). However, pairwise comparisons resulted in not significant population structure. The overall Fst value indicated moderate population structure within the Eastern Tropical Pacific Ocean, however, it is important to consider that the high mutation rate of microsatellite loci has relevant consequences for Fst values, and it could result in bias due to mutation rates assumptions that are not yet well understood [36]. However, this slight level of population differentiation and structure was also recovered in the STRUCTURE analyses, which suggested that samples belonged in three clusters. These clusters showed population differentiation at the R level between cluster 1 and 2 and between cluster 1 and 3. Such results suggest that there appears to be some genetic differences in allele frequencies in samples grouped in cluster 1, and are suggestive of some degree of stock differentiation in the Eastern Pacific blue shark population. This result differs from the information presented by Ovenden and collaborators [7], showing no significant population structure within the Western Pacific [7] This interesting result supports findings by other researchers suggesting the presence of more than one population unit of P glauca in the Eastern Tropical Pacific. This result was supported by previous capture-recapture studies, stable isotope analyses and satellite tagging, indicating sexual and mature segregational patterns for P glauca along the Eastern Pacific [37,38]. However, when analyzing the microsatellite outcomes for the Eastern Tropical Pacific, it is important to consider the low sampling number (N=9) from Ecuador. Therefore, although this study shows some interesting results when analyzing microsatellite data, this is initial data and it warrants further investigation to know if there is indeed a finer degree of genetic structure for P glauca in the Tropical Eastern Pacific. We are aware that using heterogeneous primers may obscure additional genetic variations, therefore we recommend future studies to use primers specifically designed for P. glauca [20,22].
Also, this study neither compared nor analyzed microsatellite results between both oceans (Western and Eastern Pacific) since the total number of genotypes and or alleles frequencies from the Ovenden and collaborators [7] study were not available for comparison. However, when comparing the heterozygosity values between the Western and Eastern Pacific, higher values were detected for the Western Pacific than for the Eastern Tropical Pacific (Table 3).

*Significant values for Heterozigositys and H-W deviations.
Management implications
Genetic analyses are an important component for fisheries management and a crucial tool to develop conservation measures [19]. This study is a key starting point to expand population genetic studies in the Eastern Tropical Pacific and contribute to the evolutionary history of P. glauca and other shark species worldwide.
Genetic diversity and population structure (Fst) results are key information that would contribute to further studies testing reductions in P. glauca population size caused by humans activities, in this case fisheries [1,11,39-41]. Moderately high population structure (Fst), and significant (Rst), were found in microsatellite analyses. This leads us to suggest that there appears to be more than one P. glauca stock in the Eastern Tropical Pacific. However, further studies, including increased sample sizes from additional geographic locations, are needed in order to confirm these preliminary results [19].
The effects of stress in threatened species need to be viewed in the context of inbreeding and loss of genetic variation [42]. It has been suggested that losses in genetic diversity may reflect in losses of adaptive evolutionary potential that will be critical under stressful conditions [9,39]. This should be further investigated, as it can be an important point regarding catch numbers on both sides of the Pacific Ocean. An increased sampling and analyses effort for this and other species along the Eastern Tropical Pacific will allow for a better understanding of stock structure and population differentiation. This information will be crucial for current management and conservation plans in countries along the Eastern Tropical coast and at the regional level.
Funding
PADI Foundation (2010), a California non-profit public benefit corporation, and Universidad de los Andes (Assistant Professors Fund).
Acknowledgment
We thank tissue sample collectors from Fundacion Malpelo (Colombia) and the Galapagos National Park (GNP-Ecuador). We are grateful to the GNP for access to laboratory facilities. Financial support for this research was available through Padi Foundation and Universidad de los Andes. We want to thank Jennifer Ovenden and Raewyn Street, for providing key information on molecular markers and laboratory protocols.
References
- Lewallen EA, Anderson TW, Bohonak AJ (2007) Genetic Structure of leopard shark (Triakis semifasciata) populations in California Waters. Marine Biology 152: 599-609. Aires-da-Silva AM, Hoey JJ, Galucci VF (2008) A historical index of abundance for the blue shark (Prionace glauca) in the western North Atlantic. Fisheries Research 92: 41-52.
- Myers RA , Worm B (2003) Rapid worldwide depletion of predatory fish communities. Nature 423: 280-283.
- Skomal G, Natanson L (2002) Age and Growth of the Blue Shark Prionace glauca in the North Atlantic Ocean. Collective Volume of Science Papers 54(4): 1212-1230.
- Domingo A, Menni RC, Forselledo R (2005) Bycatch of the pelagic ray Dasyatis violacea in uruguayan longline fisheries and aspects of distribution in the Southwestern Atlantic. Scientia Marina 69(1): 161166.
- Clarke SC, Magnussen JE, Abercrombie DL, Mcallister MK, Shivji MS (2006) Identification of Shark Species Composition and Proportion in the Hong Kong Shark Fin Market Based on Molecular Genetics and Trade Records. Conserv Biol 20(1): 201-211.
- Ovenden JR, Kashiwagi T, Broderick D, Giles J, Salini J (2009) The extent of population genetic subdivision differs among four co-distributed shark species in the Indo-Australian archipelago. BMC Evol Biol 9: 40.
- IUCN (2011) IUCN Red List of Threatened Species. Version 2011.2.
- MacMillan E, Roth B (2012) By-catch in the saginaw bay, lake huron commercial trap net fishery. Journal of Great Lakes Research 38(2): 353-361.
- Holmes B, Steinke D, Ward R (2009) Identification of Shark and Ray Fins Usind DNA Barcoding. Fisheries Research 95: 280-288.
- Weiwen L, Xiaojie D, Jiangfeng Z, Siquan T, Shan H, et al. (2016) Genetic differentiation in blue shark, Prionace glauca, from the central Pacific Ocean, as inferred by mitochondrial cytochrome b region. Mitochondrial DNA A DNA Mapp Seq Anal 19: 1-4.
- Walsh W, Kleiber P (2001) Generalized additive model and regression tree analyses of blue shark (Prionace glauca) catch rates by the Hawaii- based Commercial Long-line Fishery. Fisheries Research 53: 115-131.
- Hueter RE, Heupel MR (2004) Evidence of philopatry in sharks and Implications for the Management of Shark Fisheries. Journal of Northwest Atlantic Fishery Science 35: 239-247.
- Stevens J, Bradford R, West G (2010) Satellite tagging of blue shark (Prionace glauca) and other pelagic sharks off eastern Australia: depth behaviour, temperature experience and movements. Marine Biology.
- Jorgensen SJ, Reeb CA, Chapple TK, Anderson S, Perle C, et al. (2010) Philopatry and migration of pacific white sharks. Proceedings of the Royal Society B doi:10.1098/rspb.2009.1155.
- Bradshaw CJ A (2007) Swimming in the deep end of the gene pool: Global population structure of an oceanic giant. Mol Ecol 16 (24): 5111-5113.
- Ducan K, Martin A, Bowen B, Coute G (2006) Global Phylogeography of the Scalloped Hammerhead Shark (Sphyrna lewini). Mol Ecol 15(8): 2239.
- Hoelzel AR, Shivji MS, Magnussen J, Francis MP (2006) Low worldwide genetic diversity in the basking shark (Cetorhinus maximus). Biol Lett 2(4): 639-642.
- Molony BW, Lenanton R, Jackson G, Norriss J (2004) Stock enhancement as a fisheries management tool. Reviews in Fish Biology and Fisheries 13(4): 409-432.
- Fitzpatrick S, Shivji MS, Chapman DD, Prodol PA (2012) Development and Characterization of 10 polymorphic microsatellite loci for the blue shark, Prionace glauca, and their cross shark-species amplification. Conservation Genetic resources 3(3): 523-527.
- Keeney D, Heist E (2003) Characterization of microsatellite loci isolated from the blacktip shark and their utility in requiem and hammerhead sharks. Molecular Ecology Notes 3(4): 501-504.
- Taguchi M, Shigenobu Y, Ohkubo M, Yanagimoto T, Sugaya T, et al. (2013) Characterization of 12 polymorphic microsatellite DNA loci in the blue shark, Prionace glauca, isolated by next generation sequencing approach. Conservation Genetics Resources 5(1): 117-119.
- Hyde JR, Lynn E, Humphreys R , Musyl M, West AP, et al. (2005) Shipboard identification of fish eggs and larvae by multiplex PCR, and description of eggs of blue marlin, shortbill spearfish, and wahoo. Marine Ecology Progress Series 286: 269-277.
- Ward RD, Zemlak TS, Innes BH, Last PR, Hebert PDN (2005) DNA barcoding Australia's fish species. Philos Trans R Soc Lond B Biol Sci 360(1462): 1847-1857.
- Pardini AT, Jones CS, Noble LR, Kreiser B, Malcolm H, et al. (2001) Sex- biased dispersal of great white sharks. Some respects, these sharks behave more like whales and dolphins than other fish. Nature 412: 139-140.
- Maddison DR, Maddison WP (2000) MacClade: analysis of phylogeny and character evolution. Sinauer, Sunderland, Massachusetts, USA.
- Schneider S, Roessli D, Excoffier L (2000) Arlequin: a software for population genetics data analysis User manual ver 2.000. Genetics and Biometry Lab, University of Geneva, Switzerland.
- Stamatakis A (2006) RAxML-VI-HPC: Maximum Likelihood-based Phylogenetic Analyses with Thousands of Taxa and Mixed Models. Bioinformatics 22(21): 2688-2690.
- Zwickl DJ (2006) Genetic algorithm approaches for the phylogenetic analysis of large biological sequence datasets under the maximum likelihood criterion. PhD dissertation, The University of Texas at Austin, USA.?
- Pritchard JK, Stephens M, Donnelly P (2000) Inference of population structure using multilocus genotype data. Genetics 155(2): 945-959.
- Dupanloup I, Schneider S, Excoffier L (2002) A simulated annealing approach to define the genetic structure of populations. Mol Ecol 11(12): 2571-2581.
- Martin AP (1995) Mitochondrial DNA sequence evolution in sharks: Rates, Patterns, and phylogenetic inferences. Mol Biol Evol 29 (7): 1114-1123.
- Carey FG, JV Scharold , Ad J Kalmijn (1990) Movements of blue sharks (Prionace glauca) in depth and course. Marine Biology 106(3): 329342.
- Damalas D, Megalofonou P (2010) Enviromental effects on blue shark (Prionace glauca) and oilfish (Ruvettus pretiosus) distribution based on fishery-dependent data from the eastern Mediterranean Sea. Journal of the Marine Biological Association of the UK 90(3): 467-480.
- Escobar-SO, Galvan-MF, Rosfles-MR (2011) Biomagnification of mercury and selenium in blue shark Prionace glauca from the Pacific Ocean off Mexico. Biol Trace Elem Res 144(1-3): 550-559.
- Ballouc F, Lugon-MN (2002) The estimation of population differentiation with microsatellite markers. Mol Ecol 11(2): 155-165.
- Vogler R, Beier E, Ortega-GS, Santana-HH, Valdez-FJJ (2012) Ecological patterns, distribution and population structure of Prionace glauca (Chondrichthyes: Carcharhinidae) in the tropical- subtropical transition zone of the north-eastern Pacific. Mar Environ Res 73: 3752.
- Polo-SC, Galvan-MF, Kim SL, O'Hara TM, Newsome SD (2012) Variabilidad trofica y uso del habitat del tiburon azul Prionace glauca en el Paci'fico mexicano determinada a partir de analisis de isotopos estables. III Encuentro colombiano sobre condrictios.
- Frankham R (2005) Stress and adaptation in conservation genetics. J Evol Biol 18(4): 750-755.
- Chapman DD, Abercrombie DL, Douady CJ, Pikitch EK, Stanhope MJ, et al. (2003) A streamlined, bi-organelle, multiplex PCR approach to species identification: Application to global conservation and trade monitoring of the great white shark, Carchorodon carcharias. Conservation Genetics 4: 415-425.
- Dudgeon CL, Blower DC, Broderick D, Giles JL, Holmes BJ, et al. (2012) A review of the application of molecular genetics for fisheries management and conservation of sharks and rays. J Fish Biol 80(5): 1789-1843.
- Allen G (2008) Conservation hotspots of biodiversity and endemism for Indo-Pacific coral reef fishes. Aquatic Conservation: Marine Freshwater Ecosystems 18: 541-556.


