Indo-Pacific Bottlenose Dolphins (Tursiops aduncus) Whistle Sound by Denoising Spectra with Discrete Wavelet Transform (DWT)
Muhammad Zainuddin Lubis*
Department of Informatics Engineering, Geomatics Engineering Batam Polytechnic, Indonesia
Submission: November 21, 2016; Published: February 06,2017
*Corresponding author: Muhammad Zainuddin Lubis, Department of Informatics Engineering, Geomatics Engineering Batam Polytechnic, Batam Kepulauan Riau 29461. Indonesia, Email: zainuddinlubis@polibatam.ac.id
How to cite this article: Muhammad Z L. Indo-Pacific Bottlenose Dolphins (Tursiops aduncus) Whistle Sound by Denoising Spectra with Discrete Wavelet Transform (DWT). Ocean & fish Open Access J. 2017; 1(3): 555561. DOI: 10.19080/OFOAJ.2017.01.555561
Abstract
Bottlenose dolphins (Tursiops aduncus) use whistles to communicate with their conspecifics and maintain group cohesion. We recorded 8 whistles of Indo-Pacific bottlenose dolphins (Tursiops aduncus) in the Safari Park, Cisarua Bogor, Indonesia between 10th - 15th May 2015. Dicrete Wavelet Transform (DWT) using Haar wavelet method for analysis whistle sound of Indo-Pasific Bottle Nose Dolphins.Discrete Wavelet Transform (DWT) Showed difference between the treatment before and after meal at whistle sound. DWT in Wavelet have Haar wavelet method produced highest value of Power Spectral Density Level (PSDL) is 61 dB re 1μPa2 / Hz, and lowest value is -80 dB re 1μPa2 / Hz. Interval whistle have a equation y= -8.6x+ 97 , R2= 0.3658 (36%) in show pool, before meal treatment. While in show pool, after meal treatment have y= x+55.5, R2= 0.0758 (8%).Before meal treatment in ANOVA have Y = 22.5045 + 0.000097 X, and have percentage of R2 value is 1 %, percentage of Significance F value is 63%. ANOVA in Equation of whistle sound after meal have Y = 24.2824 + -0.0000434 X have percentage of significance F value is 81%.
Keywords: Bottlenose dolphins; whistle sounds; Dicrete Wavelet Transform; Power Spectral Density Level
Abbreviations: DWT: Discrete Wavelet Transform; PSDL: Power Spectral Density Level; FFT: Fast Fourier Transforms; WT: Wavelet Transform; STFT: short time Fourier Transform
Introduction
In numerical functional and analysis, a method of Discrete Wavelet Transform (DWT) is any wavelet transform in wavelet method for which the wavelets are discretely sampled. As with other wavelet transforms, key advantage has over of Fast Fourier Transforms (FFT) is temporal resolution: it captures both frequency [1].
Bottle nose dolphins including mammals that have good hearing sensitivity. It is caused by a network system senses of hearing has been well. Dolphins can hearing of sounds with frequencies range 1-150 kHz [2]. High sensitivity is indispensable for echolocation. Echolocation is the ability to sense through sound and hearing. This activity occurs in two steps, the first dolphin issued Clicks high frequency (120 kHz), and then projected through the front of the head area (melon) into the surrounding aqueous medium. When Clicks of an object, will form an echo or sound waves to be received by dolphins and processed into information about the location or type of object [3](Figure 1).

DWT in Wavelet have Haar wavelet method and has an essential shortcoming: it is not continuous. In the points of discontinuity the derivatives do not exist, therefore it is not possible to apply haar wavelet directly for solving differential of equations. Haar wavelet family for t ϵ [0, 1] is defined [4]:

Haar wavelet family t ϵ [0, 1] have m Integer is = 2j(j = 0, 1, . . . , J) indicates level of the wavelet method is k = 0, 1, . . . , m - 1 is translation of parameter. Maximum level of resolution is J. The index i in (1) is calculated according with formula i = m + k + 1; in the case of minimal values is m = 1, k = 0 we have i = 2, max value i is i = 2M = 2 j+1. It is assumed that value to i = 1 corresponds to the scaling function for which h1≡ 1 in [0, 1] and vanishes elsewhere. Let us define the collocation points tl = (l - 0.5)/ (2M), (l = 1, 2, . . . , 2M) and discretise the Haar function hi(t); in this way we get the coefficient matrix H(i, l) = (hi(tl)), which has the dimension 2M x 2M. Operational next matrix of integration P, which is a 2M square matrix, is definition in equation [4]:

Elements of the matrix H and P can be evaluated according to (1) and (2).For instance, if M = 2 we find the result is [4]:

Whistle sound of dolphins is generally used for echolocation, and whistle also serves as a major role in communication between individuals and between groups [2,3]. Continuous whistle sound, signaling frequency [2], with a wide beam width of 800 Hz and 28.5 kHz [5] often has a harmonic component [5]. A dolphin starts the interaction with signal, with information, in the length of a particular frequency. Then signal sources depend on the source of the hearing and will cause a reaction to sound. Hearing in dolphins ranges from about 50 Hz-150 kHz, with additional variations among species [6].
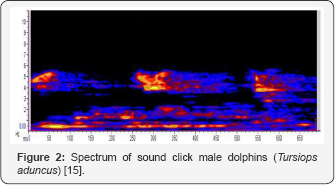
Examples of spectrograms of whistle that there are noise or noise in it [7] can be seen in Figure 1, and click sound of dolphins can be seen in (Figure 2). Previous research by looking at whistling sound vocalizations of dolphins and a clicking sound is [8-10] bioacoustic research about stidulatory ever done with object Guppy fish [11-14]. The vocalisation characteristics described above have been found to vary among populations, possibly due to habitat differences, ambient noise, sympatry with other dolphin species, etc. In this article, the whistle characteristics of Indo-Pacific bottlenose dolphins were measured in captive of safari park, Cisarua, Indonesia. Data analysis in this research was done with MATLAB, Raven Pro 1.5, and Wavelab 6 software with haar wavelab method in signal processing using MATLAB software.
Methods
Data Collection
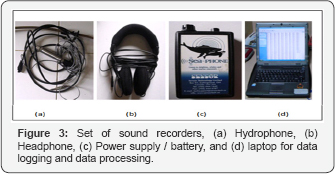
Data were collected in safari park, Cisarua Bogor, Indonesia from 10th to 15th May 2015. Acoustic instrument for collecting data was a hydrophone of type SQ3 with a built-in preamplifier, sensivity of- 163.9dB re V/μPa, and frequency response of 0 Hz - 35 kHz (±3 dB). SQ 3 recorders were used with Wave lab 6 Software, and the data stored as 16-bit WAV files. During recordings, the hydrophone was placed in show pool at safari park at a depth 0.5 m below the surface of the water. In the show pool there were two male dolphins which were used as the object of research. The dolphins had two tails of the same size, without a given name or tagging. The dolphins had a length of 2.1 meters, weighing 212 kg, and age of 11 years (dolphin is classified as an adult). The treatments given in this study were before and after meals. Figure of hyrophone and Set of sound recorders is shown in (Figure 3), and Sketch of experimental research showed in (Figure 4).

Data Analysis
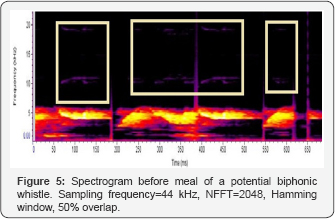
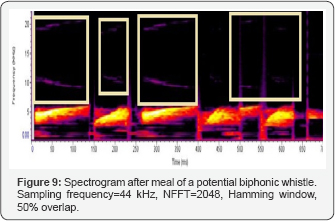
Acoustic analysis focussed on the identification and of whistles sound by bottlenose dolphins (Tursiops aduncus) in Safari Park, Cisarua, Indonesia. Denoised signal, Relationship Power Spectral Density Level (PSDL) and Time Duration, Haar wavelet 1 D (DWT Wavelet Tree) and approximation at level 5 presented in the results were generated in Matlab R2010a (The MathWorks Inc.), by Fast Fourier Transform(FFT) of the calibrated pressure time series, using Hamming windows of 2048 samples and 50% overlap. Spectrogram of a potential biphonic whistle was done. Sampling frequency=44 kHz, NFFT=2048, Hamming window, 50% overlap processing with Raven Pro 1.5 software of bioacoustics. Statistical analysis ANOVA method was used and has an interval of whistle from dolphin use SPSS Statistics 17.0.
Result and Discussion
Discrete Wavelet Transform (DWT)
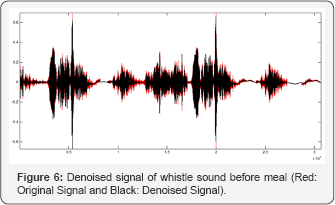
While this paper aims to describe whistle sound recorded in captive, the dolphins have trained for behaviour in show pool. The pattern seen in the sound before meal has three patterns of sound that is at 50-190 ms, 250-500 ms and 550-620 ms respectively. This suggests the different sound patterns within a specific time range produced by dolphins with maximum time is 650 ms (Figure 5). Sound pattern of the whistle after meal has 4 times the range 0-140 ms, 160-240 ms, 250-400 ms and 470-640 ms. This shows the difference in the number of patterns of sound produced by the dolphin with their treatment before and after eating (Figure 6), and the result is almost the same as the previous study [1,8,15].
Wavelet Transform (WT) is a technique for analyzing a signal. It was developed as an alternative to the short time Fourier Transform (STFT), an Fourier Transform (FT) to overcome problems related to its frequency and time resolution properties. More specifically, unlike the STFT that provides uniform time resolution for all frequencies, the DWT provides high time resolution and low frequency resolution for high frequencies and high frequency resolution and low time resolution for low frequencies. In that respect it is similar to the human ear which exhibits similar time-frequency resolution characteristics.
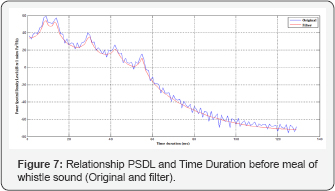
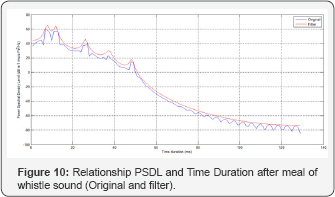
Relationship Power Spectral Density Level (PSDL) and Time Duration before, after meal of whistle sound have differences. Power Spectral Density Level (PSDL) initial value is 39 dB re 1μPa2 / Hz, and the final value is at 130 ms, with the blue line shown is the result of original and red was modified with an algorithm which is owned by the Haar wavelet. Highest value of Power Spectral Density Level (PSDL) is 60 dB re 1μPa2 / Hz, and lower value is -83 dB re 1μPa2 / Hz (Figure 7). Power Spectral Density Level (PSDL) initial value is 40 dB re 1μPa2 / Hz, and the final value is at 130 ms (same with treatment before meal), with the blue line shown is the result of original and red was modified with an algorithm which is owned by the Haar wavlet.
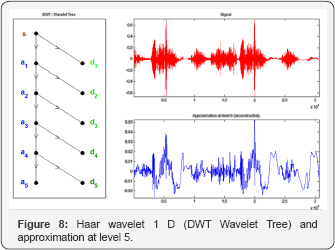
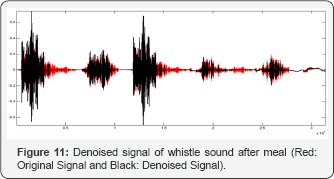
Highest value of Power Spectral Density Level (PSDL) is 61 dB re 1μPa2 / Hz, and lower value is -80 dB re 1μPa2 / Hz (Figure 8). This clearly shows whistle sound before and after meals has a value of Power Spectral Density Level (PSDL) different at highest and lowest. Values obtained more noise in treatment after a meal that is in the image 11 shown in black. Complex of Discrete Wavelets Transform (DWT) [16,17] may provide similar benefits, but we have not yet explored them thoroughly in the context of mass spectrometry data. An orthogonal (decimated) discrete wavelet transform (DWT) was used to study SELDI data derived from the serum of prostate cancer patients according to Qu Y, et al. [18-21].
Results of statistical processing
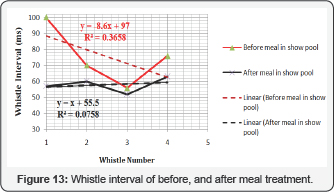
In the results of statistical processing, the highest whistle interval value is 100 ms (red line) before meals treatment, and lowest whistle interval value is 52 ms (Black line) after meal treatment. Equation y= -8.6x + 97, R2= 0.3658 (36%) in show pool, before meal treatment. While in show pool, after meal treatment have y= x+55.5, R2= 0.0758 (8%). From linear regression results obtained, it shows that the value of R2 in treatment before meal has a greater percentage than in the time after meal (Figure 9). Interval whistle affect the value of noised generated [21], because the smaller the value noise obtained, the greater the value of the interval whistle (Figure 10).


Result of statistical with ANOVA will be showed in (Tables 1 & 2). In Table 1, Y = 22.5045 + 0.000097 X, and percentage of R2 value is 1 %, percentage of Significance F value is 63% with before meal treatment. The Equation of whistle sound after meal Y = 24.2824 + -0.0000434 X (Figure 11) and have percentage of significance F value as 81 %. This shows that the value of the regression ANOVA before the meal is smaller than after meals.
Conclusion
The results in this study show Discrete Wavelet Transform (DWT) use haar wavelet (Figure 12) method has the value difference between before and after meals treatment. Patterns and values on whistle sound using the Discrete Wavelet Transform (DWT) also have differences. In the treatment DWT after meals has a value greater than the treatment before meal (Figure 13). Results of statistical analysis shows before the interval whistle meal more have greater correlation than before the meal, and the ANOVA results show the percentage of significance F indicates a greater value in treatment after meals.

References
- Selesnick IW, Baraniuk RG, Kingsbury NG (2005) The dual-tree complex wavelet transform. IEEE Signal processing magazine 22(6): 123-151.
- Azzolin M Papale E, Lammers, MO Gannier A, Giacoma C (2013) Geographic variation of whistles of the striped dolphin (Stenella coeruleoalba) within the Mediterranean Sea. The Journal of the Acoustical Society of America 134, 694.
- Wulandari PD, Pujiyati S, Hestirianoto T, Lubis MZ (2016) Bioacoustic characteristic click sound and behaviour of male dolphins bottle nose (Tursiops aduncus). J Fisheries Livest Prod 4: 160.
- Stankovic RS, Falkowski BJ (2003) The Haar wavelet transform: its status and achievements. Comput Elec Eng 29(1): 25-44.
- Gridley T, Berggren P, Cockcroft VG, Janik VM (2012) Whistle vocalizations of Indo-Pacific bottlenose dolphins (Tursiops aduncus) inhabiting the south-west Indian Ocean. J Acoust Soc Am 132(6): 4032.
- Janik VM (2009) Acoustic communication in delphinids. Advances in the Study of Behavior 40: 123-157.
- Branstetter BK, DeLong CM, Dziedzic B, Black A, Bakhtiari K (2016) Recognition of Frequency Modulated Whistle-Like Sounds by a Bottlenose Dolphin (Tursiops truncatus) and humans with transformations in amplitude, duration and frequency. PloS one 11(2): e0147512.
- Bebus SE, Denise HL (2015) Mother-Offspring signature whistle similarity and patterns of association in Atlantic spotted dolphins (Stenellafrontalis) Animal Behavior and Cognition 2(1): 71-87.
- Dudzinski KM, Sakai M, Masaki K, Kogi K, Hishii T (2003) Behavioural observations of bottlenose dolphins towards two dead conspecifics. Aquatic Mammals 29(1): 108- 116.
- Jensen FH, Bejder L, Wahlberg M, Madsen PT (2009) Biosonar adjustments to target range of echolocating bottlenose dolphins (Tursiopssp) in the wild. J Exp Biol 212(8): 1078-1086.
- Lubis MZ (2014) Bioakustik Stridulatory Gerak Ikan Guppy (Poecilia reticulata) Saat Proses Aklimatisasi Kadar Garam.
- Mutiara MT, Pamungkas IR, Lubis MZ, Putri DA, Wulandari PD, et al. (2014) Studi bioakustik pergerakan ikan guppy (Poecilia reticulata) sebagai diversifikasi pakan ikan cakalang (Katsuwonus pelamis).
- Lubis MZ, Pujiyati Sri (2015) Influence of Addition of Salt Levels Against Study of Bio-Acoustic Sound Stridulatory Movement Fish Guppy (Poecilia reticulata). The 1st International Conference on Maritime Development Proceeding pp. 01-07.
- Lubis MZ, Pujiyati S (2014) The impact of acclimatization of various salinity to againts mortalitas rate and behaviour fish guppy (poecilia reticulata) as a subtitute for fish bait skipjack (katsuwonus pelamis). Jurnal teknologi perikanan dan kelautan 4(2): 109-115.
- Lubis MZ, Pujiyati S, Hestirianoto Totok, Wulandari PD (2016) Bioacoustic Characteristics of Whistle Sounds and behaviour of male Indo-Pacific bottlenose dolphins (Tursiops aduncus) in Indonesia. International Journal of Scientific and Research Publications 6(2).
- Kingsbury N (1998) The dual-tree complex wavelet transform: a new technique for shift invariance and directional filters. In: Proc. 8th IEEE DSP Workshop, Bryce Canyon UT, USA, paper no. 86.
- Moron JR, Andriolo A (2015) Preliminary evidence for signature and copied whistles among spinner dolphins in the Southwest Atlantic Ocean: Beacon purpose? The Journal of the Acoustical Society of America 138(3): 1904.
- Qu Y, Adam BL, Thornquist M, Potter JD, Thompson ML, et. al (2003) Data reduction using a discrete wavelet transform in discriminant analysis of very high dimensionality data. Biometrics 59(1): 143-51.
- Kamath C, Fodor IK, Gyaourova A (2002) Undecimated wavelet transforms for image denoising, Lawrence Livermore National Laboratory technical report UCRL-ID-150931.
- Liu BF, Sera Y, Matsubara N, Otsuka K, Terabe S (2003) Signal denoising and baseline correction by discrete wavelet transform for microchip capillary electrophoresis. Electrophoresis 24(18): 3260-3265.
- Lubis M Z, Anurogo W (2016) Fish stock estimation in Sikka Regency Waters, Indonesia using Single Beam Echosounder (CruzPro fish finder PcFF-80) with hydroacoustic survey method. Aceh Journal of Animal Science 1(2): 70-78


