


Estimation of Demographic Change in Fishing Population for Fisheries Management in Chilika Lagoon, India: A Micro-Demographic Approach
Shimpei Iwasaki*
Department of Environmental Science, International College of Arts and Sciences, Fukuoka Women’s University, Japan
Submission: March 24, 2016; Published: May 03, 2016
*Corresponding author: Shimpei Iwasaki, International College of Arts and Sciences, 1-1-1, Kasumigaoka, Higashi-ku, Fukuoka, Japan, Tel: +81926612411; Email: iwasaki@fwu.ac.jp
How to cite this article: Iwasaki S. Estimation of Demographic Change in Fishing Population for Fisheries Management in Chilika Lagoon, India: A Micro-Demographic Approach. Fish & Ocean Opj. 2016; 1(1): 555554. DOI: 10.19080/OFOAJ.2016.01.555554
Abstract
Demographic change is considered an important factor for managing the fisheries, but little is actually known about demographic characteristics of fishing communities and their causes. On this account, this article aims to examine the changes which have taken place in the number of fishers and their families in the context of demographic trends through a case study of a specific fisher village of Chilika Lagoon, India. The micro-demographic survey revealed that there has been an increasing trend in the proportion of the village population. The population growth was largely determined by fertility and mortality in comparison to migration. Fishing population growth in combination with changes in their fishing practices will boost the likelihood and intensity of excessive competition among resource users. The survey results may not necessarily correspond to other fisher villages, but the approach will serve as a basis for paying more attention to demographic factors for resource management among policy makers and practitioners.
Keywords: Fishing population; Overfishing; Micro-demographic approach; Chilika Lagoon
Abbreviations: CDA: Chilika Development Authority; CPUE: Catch per Unit Effort; IMR: Infant Mortality Rate; TFR: Total Fertility Rate; MSY: Maximum Sustainable Yeild, U5MR: Under-five Mortality Rate
Introduction
From the viewpoint of global capture production, existing fisheries management poses challenges for ensuring wise use of fishery resources. Although there has been a consistent stable trend of the catches since the late 1990s, assessed stocks fished within biologically sustainable levels has exhibited a decreasing trend, declining from 90% in 1974 to 71% in 2011 [1]. In other words, fishery resources are becoming fully exploited or over-exploited in the world.
Along with the anthropogenic alteration in fishing habitats (ex. global warming, eutrophication, toxic chemical pollution and land reclamation), the major challenges of fisheries management are largely linked to overfishing. Of particular note are two issues of (i) illegal and destructive fishing practices and (ii) internal fishing population growth in limited fishing grounds. In the former, destructive fishing techniques using dynamite, cyanides or inadequate fishing practices such as trawling threaten the availability of fish stocks. Such problems have been reported in many parts of the world. As the technology develops, there is a constant challenge of preventing others from illegally entering the fisheries. Fisheries management necessitates a given form of social control among the resource users to implement a set of rules and monitoring that help to control fishing methods and govern access to fishing grounds in a sustainable manner. On the other hand, rapid increase of fishing population boosts the likelihood and intensity of excessive competition, described as “Derby” or “Olympic” fisheries in limited fishing grounds. The element of fishing population growth inflicts great pressures on each resource user while failing to develop institutional arrangements to make the fisheries more sustainable.
It is important to be noted that there has been an increasing trend in the proportion of fishing population [1,2]. Compared to an estimated 12.5 million people in 1990 [2], 58.3 million was making their entire or partial living from capture fisheries and aquaculture in 2012, the great majority of these in Asian countries, accounting for 84% of all people employed in the sector [1]. Indeed, the number of fishers, including aquaculturists have grown faster than the world’s population. Given that global population is expected to grow to 9 billion by 2050, the fisheries may become more vulnerable due to exogenous pressures by others who opt to engage in illegal encroachment as well as internal population growth as Hardin [3] espouses. Therefore, demographic change is considered an important factor for managing the fisheries in a sustainable way. In this regard, however, little is actually known about demographic characteristics of fishing communities and their causes [4]. Although government authorities and research institutions had given much attention to data collection on fish stocks, catch, vessels, fishing gears etc. while the acquisition of socio-economic and demographic data on fishers has been neglected (ibid).
With these recognitions, this article aims to examine the changes which have taken place in the number of fishers and their families in the context of demographic trends through a case study of a specific fisher village of Chilika Lagoon, India. Growth in the numbers of fishers and their families is determined by demographic components (fertility, mortality and migration) and by changes in their livelihoods [5]. Hence, the research attempts to develop better understanding of the demographic dynamics using the three principal determinants while highlighting its underlying causes with due consideration of their livelihood conditions. In the following section, the article firstly describes the profile and status of the fisheries in Chilika Lagoon. Secondly, it explains the methodology applied. Thirdly, the research examines longitudinal demographic changes in a fisher village. Fourthly, it attempts to highlight the status of fishing population and fishing activities which are largely related to the level of exploitation of fishery resources. Lastly, this article provides better understanding of the socio-demographic characteristics of fishers in Chilika Lagoon and addresses the need for greater awareness among relevant stakeholders to fishing population growth issues for the development of fisheries management toward sustainability.
Profile and status of the fisheries in Chilika Lagoon
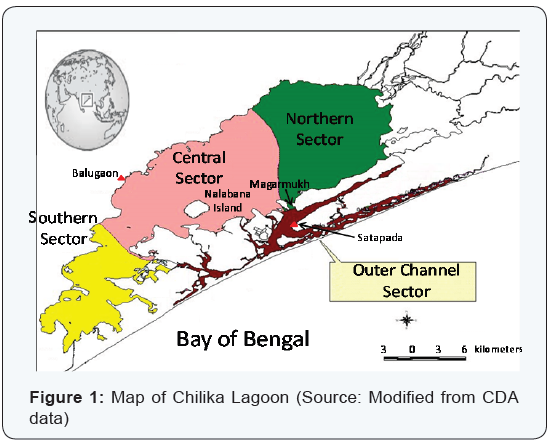
Chilika Lagoon is one of the largest brackish water lagoons in Indian sub-continent, situated at latitude 19°28’ and 19°54’ north and longitude 85°5 and 85°38’ east in Odisha state along the Bay of Bengal (Figure 1). The pear-shaped lagoon is connected to the sea through irregular water channels with several small sandy and usually ephemeral islands [6]. The average lagoon area is 1,055 sq km which increases to 1,165 sq km during the rainy season and shrinks to 906 sq km during the summer season. The lagoon having four distinctive ecological sectors (Northern, Central, Southern and Outer channel sectors of Chilika Lagoon) is a unique assemblage of marine, brackish and freshwater ecosystems. This mixed combination has endowed it with valuable biodiversity and highly productive ecosystem in which fishery resources present attractive benefits.
From a resource point of view, it can be said that there are three historical phases of fish landings (Figure 2) that is, until the late 1980s (Phase I), from the late 1980s to 2000 before hydrological intervention (Phase II) and after the intervention in September 2000 (Phase III).
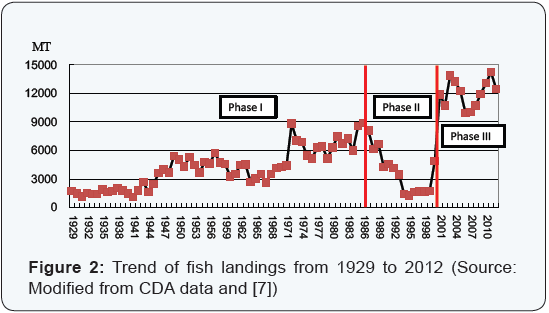
In the first phase, traditional fishers consisting of seven subcaste groups (i.e. Keuta, Niari, Kartia, Kandara, Gokha, Tiara and Nolia) mainly engaged in the fisheries in a way that was based on labor-intensive approach by using a relatively small amount of capital. Importantly, each sub-caste group used to catch specific fish and prawn species with different types of traditional fishing gears and fishing grounds, enabling the fishers to prevent occupational competition [7,8]. During the period, there has been a relatively increasing trend in the proportion of fish landings. There were a variety of factors for the higher catch, but one of the major reasons might be the increased number of those who engaged in the fisheries in Chilika Lagoon, resulting from the new entrants as well as the internal fishing population growth. The former included refugee fishers especially those from the adjacent West Bengal state and Bangladesh and other caste people (non-fisher caste) originally living in the lagoon. As for non-fisher caste, they used to consider fishing as a low profession based on the ideology of Casteism [9,10], but this view drastically changed because of improved fishing gears and high demand in international markets for prawn. Growth in the numbers of fishers including the new entrants might contribute to the increased amount of fish landings in the first phase.
In the second phase, the fishers faced with difficulties in catching fishery resources adequately. Apart from the increased number of fishers, significant changes in fishing gears, nets and methods had taken place especially since the mid 1980s. Synthetic filament nets have been widely introduced across Chilika Lagoon while the old traditional fishing activities have been replaced by “Khanda nets” (trap nets) having net boxes. Khanda nets are semipermanently installed inside Chilika Lagoon throughout the year so that such a practice obstructs other fishing methods in the areas and gives less access to the limited fishing grounds. Since 1970s, what is more, some of fishers including non-fishers and fishers have started to adapt “prawn gherry” [11], which is made either of earthen embankment or bamboo and a net enclosure [12,13]. Many of the agricultural lands in the fringe areas of Chilika Lagoon were converted for prawn culture [13,14]. Gherry culture reduced the tidal flushing which caused sedimentation of large denser particles in the immediate vicinity of the gherries. In addition, massive inflow of silts from upstream to the lagoon mainly due to anthropogenic pressures such as deforestation, overgrazing and industrialization caused sedimentation. It reduced the water spread area and hindered the exchange of water between the sea and river, thereby resulting in decreased salinity level and lower availability of migratory aquatic species in the lagoon. Siltation into the lagoon also encouraged the prolific growth of freshwater invasive species. The area of Chilika Lagoon dominated by invasive plants increased 20 sq km in 1972 to 685 sq km in May 2000[15]. The spread of the invasive species restricted the feeding and breeding grounds of many marketable aquatic species as well as reduced the area of fishing grounds, causing the decrease in catch drastically as shown in Figure 2.
In recognition of the deplorable condition, Chilika Development Authority (CDA), which was established in 1991, implemented hydrological interventions (opening of a new mouth and dredging water channels) in September 2000 (Phase III). The implementation exhibited positive impacts on fisheries enhancement with spectacular increase in fish landings as presented in Figure 2. The average annual fish landings during the post intervention period were 12070.54 metric tons which more or less corresponded to the Maximum Sustainable Yield (MSY) level as estimated by Central Inland Fisheries Research Institute [16]. Because of the ecological restoration measures implemented by CDA, the catch per unit effort (CPUE) was estimated to be 8.27 kg per boat a day in 2003-2004 while the estimate was only 1.91 kg per boat a day in 1999-2000 [17].
On this account, it seems that major challenges for resource management in Chilika Lagoon fisheries are not strongly linked to the demographic factor. Rather, these include various types of environmental variables such as the degree of silt accumulation, growth of freshwater invasive species, salinity, etc. However, changes in the numbers of fishers using improved fishing gears (Khanda nets) have no small effects on the availability of fishery resources. Since those involved in the fisheries depend on fishery resources in the limited water spread area, the anthropogenic pressures from fishing population growth in combination with improved fishing practices are at great concern. Nevertheless, little is actually known about socio-economic statistical information including fishing population in Chilika Lagoon. From the viewpoint of fishing population, it was reported that there were approximately 48,000 fishers in the 1970s, out of whom 8,000 were described as “full-time fishers” [18]. Then, population has been increasing and totaled to 122,339 in 2005, of which 30,936 were estimated to be full-time fishers [19]. In 2007, JICA-CDA Technical Cooperation Project [20], which commissioned a baseline survey of 127 fisher villages or hamlets in and around the lagoon1, reported 103,454 fishers in total. It seems that there is a gap in the number of fishers between the reports of ARCSCCB in 2005 [19] and JICA-CDA in 2007 [20]. In order to link demographic factor to exploitation of fishery resources, there is a great need to build better understanding of longitudinal demographic changes in the fisheries.
Methodologies
In order to understand the demographic dynamics in Chilika Lagoon fisheries, the research applied a microdemographic approach by using a family reconstitution method which is a rigorous procedure for constructing and analyzing demographically valid family genealogies of ordinary people [21]. In general, the method is used for a micro-history survey of specific region, area and community by transcribing a variety of archival records including people registers, tax, land, testamentary and biographical documents and then restructuring them into family order in the field of historical demography.
In Chilika Lagoon, however, it is difficult to collect such records which range over generations, have regular data, and/ or support identifying specific information including names, births, deaths, marriages and moves. Instead of the records, therefore, the research used an interview method with representatives from all households in a specific fisher village of Chilika Lagoon. The fieldworks were carried out in January 2011 and in February to March 2012. In doing the fieldworks, it is important to be noted that the targeted fisher village was newly established in 1981. The local people were all traditional fishing immigrants from the adjacent district in the lagoon, resulting from political flak in the ex-fisher community2. By the end of 2011, the total population of the village was 695 having 119 families. During the period from 1981 to 2011, representatives from all households in the targeted fisher village were asked to recall their memory from the present to the past in the following way.
- The survey did not cover non-fishers villages.
- The governor of Odisha provided the immigrants with open lands along the shoreline of Chilika Lagoon, thereby leading to the establishment of new fishing community.
First, sex, educational level and age of family members were asked in the 2011 base year. Based on the age of each family member in the base year, the research attempted to identify their age in respective year during the period. In case of those who were born in the village after 1982, the record was made from their birth year. Second, the research drew a family tree in each household, in order to identify the eldest son of the householder and cross-check the difference of age among siblings because illiteracy has been widespread in the village so that it is hard to know exactly how old he or she is. In case of the eldest son of the householder, sex and age of parents and their siblings were further asked whether those used to live in the village during the period or not. In the same way, sex and age of grandparents and their siblings were further asked to clarify it, in case of the eldest son of the parents. Thirdly, sex and age of deceased persons were asked if applicable. Fourthly, the year of marriage for males and females was recorded, respectively. To understand the demographic changes in the village, it is important to identify their marriage year, especially for a female, because the wife is obliged to live with her husband’s family in other community, a culture that is common in fishing community of Chilika Lagoon. Hence, marriage year means the wife moves into husband’s village and outside her village. Fifthly, the year and period of migration in search of work engagement were asked to identify whether some of them predominantly reside in the community throughout the appropriate year(s) or not. Sixthly, the research attempted to ask resource persons, who knew the village history well, about families which had already migrated to other areas, in terms of age, sex and duration of residence in the past.
In so doing, the research explores estimating the demographic dynamics in Chilika Lagoon fisheries with three principal determinants (fertility, mortality and migration). In addition, it used structural questionnaires to all households (N=119) and secondary data. The questionnaire survey addressed the status of fishing activities including fishing gears and fishing grounds in three seasons (winter, summer and rainy seasons). In the following, the article sets out to estimate the demographic changes in the village during the period from 1981 to 2011.
Demographic changes in a fisher village of Chilika Lagoon
Estimated population numbers from 1981 to 2011
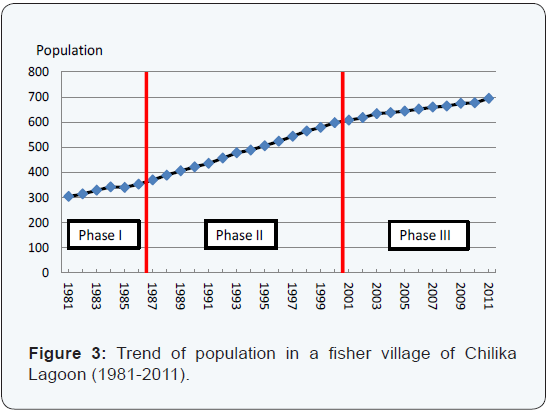
The micro-demographic survey revealed that there has been an increasing trend in the proportion of the village population during the period from 1981 to 2011 (Figure 3). The growth rate of estimated village population during the period was 128.6 %. It was higher than the average one in India (77.1%) [22]. It is important to be noted that the decadal growth (11.3%) during 2001-2010 (Phase III) has shown the sharpest decline, which is similar to the national trend in India3 (ibid). It declined from 38.8% in 1981-1990 (Phase I and II) and 37.1 per cent in 1991- 2000 (Phase II), respectively.
- The sharpest decline in the decadal population growth of India during 2001-2011 has been recorded [22]. The decadal growth rates of population, India has consistently declined since 1960s.
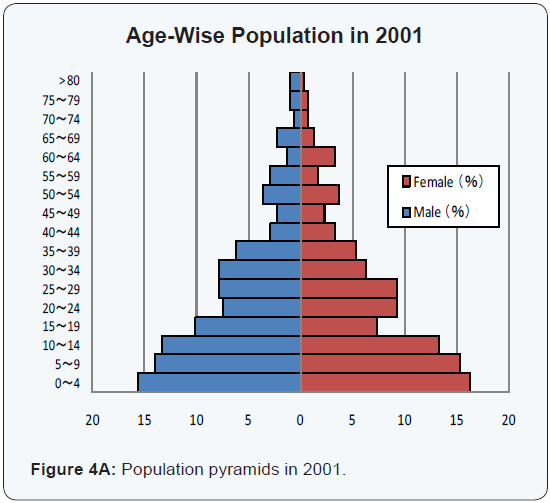
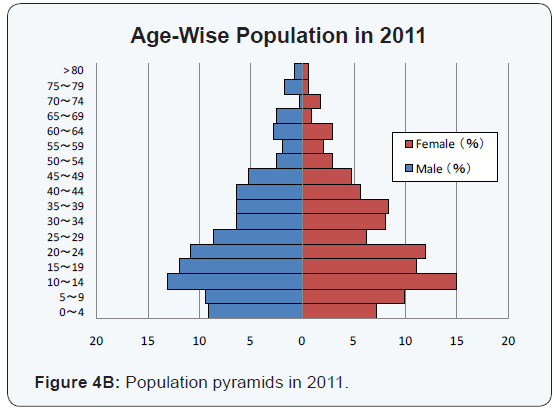
The demographic changes in the targeted village can be shown in its age structure. Figure 4A and 4B indicated population pyramids in 2001 and 2011, respectively. In comparison with the different years among 1981, 1991, 2001 and 2011, the former three periods commonly indicated that the village had the largest number of the youngest age group (0 to 5 years), with many young people and few elderly, shaping the category of population pyramid as shown in Figure 4A. It is estimated that the proportion of the village population under age 19 accounted for more than half the population. On the other hand, the highest proportion of the age group in 2011 was ages 10-14 (27.9%), followed by ages 15-19 (23.0%), ages 20-24 (22.9%), ages 5-9 (18.9%), ages 0-4 (16.2%), etc. As the years pass, the population shape is changing from triangular to barrel-like. Given that the majority of age group was ages 10-14 in 2011, the increased growth rate of village population will be steadily continued to a great extent for the time being.
Fertility and mortality
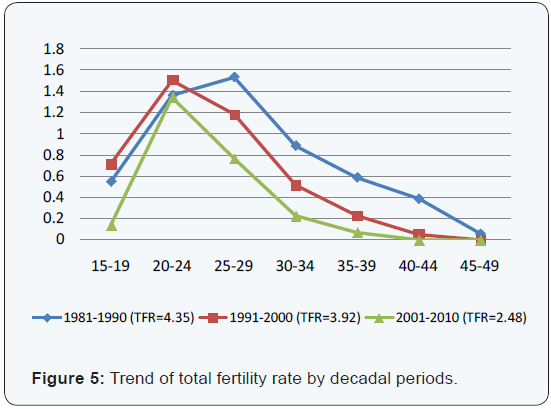
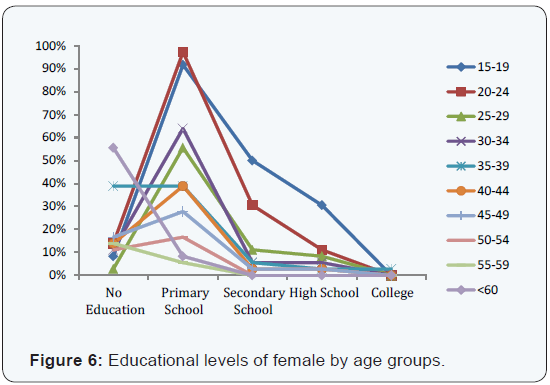
The estimated population numbers from 1981 to 2011 were largely determined by two demographic factors (fertility and mortality) in the targeted village. In the former, Figure 5 indicated the trend of total fertility rate (TFR) by three decadal periods (1981-1990, 1991-2000, 2001-2010). TFR is a measure of the anticipated level of completed fertility per woman if she were to pass through the reproductive years bearing children. Looking at the changes in Figure 5, it is clear that the trend of TFR has been toward a steady decline. The TFR during the period from 1981 to 1990 was 4.35, which was the highest one, followed by 1991- 2000 (3.92) and 2001 to 2010 (2.48). The TFR in the rural area of Odisha state, India was 2.4 [22], largely corresponding to the survey result. By age group (5-year-cohort), ages 25-29 was the highest proportion of fertility rate (1.54) in 1981-1990, followed by ages 20-24 (1.37), ages 30-34 (0.89) etc. On the other hand, ages 20-24 was the highest proportion of fertility rate in 1991- 2000 (1.51) and 2001-2010 (1.35), respectively. The average age of first marriage was 18.1 for female and 22.5 for male while 19.4 in 1981-1990, 19.2 in 1991-2000 and 19.9 in 2001-2010. A oneway analysis of variance yielded a main effect for gender [F (1, 393) = 259.40, p < .01]. Furthermore, it indicated a main effect for periods in the case of female [F (2, 263) = 7.76, p < .01], so that post hoc analyses using the Tukey HSD test indicated that the average age of first marriage for female was significantly higher in 2001-2010 (p < .05) than in the other periods (1981-1990 and 1991-2000), though there were no statistically significant differences among them for male [F (2,126) = 0.89, p > .05]. It is likely that the increase in age of marriage for female might be linked to improvement of educational status as well as their economic condition. Although 30% female who were more than 15 years old had no educational background in 2011, younger females (particularly ages 15-19) got more opportunities for entering primary (1st t o 5th grade), secondary (6th to 7th grade) and high schools (8th to 10th grade) than older ones did as shown in Figure 6. Their educational attainment affecting childbearing through various factors including age at marriage, breast feeding, post-partum abstinence, child mortality etc. [23] might have an effect on fertility in 2001-2010.
In the latter, the survey confirmed 79 persons died during the period from 1981-2011. By decadal periods, each median age at death was 0 in 1981-1990, 52 in 1991-2000 and 64 in 2001-2010. Although small samples in each period affect changes in median age at death to a great extent, a one-way analysis of variance yielded a main effect for periods (F (2, 72) = 3.73, p < .05) and then post hoc analyses using the Tukey HSD test indicated that the median age at death was significantly higher in 2001-2010 (p < .05) than in 1981-1990. In particular, Under-five Mortality Rate (U5MR) and Infant Mortality Rate (IMR) have declined from 58.4 and 58.4 per 1000 live births in 1981-1990, 32.3 and 21.5 per 1000 live births in 1991-2000 and 38.5 and 30.8 per 1000 live births in 2001-2010. Apart from the similar numbers of deaths between 1991-2000 and 2001-2010, the period from 2001 to 2010 witnessed considerable decrease in the number of births compared to 1991-2000 so that the two indicators were the highest in 1991-2000. Given that the U5MR and IMR in rural area of Odisha State, India were 76 and 58 per 1000 live births in 2011 [22], the survey results seem to be at a very low level of mortality.
Although there are neither health workers nor associate nurse midwives available in the targeted village, the survey found that pregnant women, and children below the age of 5 had access to proper health care programs, thereby resulting in decreased level of U5MR and IMR.
Migration
There have not been significant changes in the population number by migration except the initial collective relocation in 1981. During the period from 1981 to 2011, two families who were same caste group (Kaibarta) from other fisher village migrated to the village in 1999 while three families retuned back to their native village for agriculture engagement in 1985. Irrespective of the sharp decline in fish landings of Chilika Lagoon in Phase II, most of the villagers continued to live in the village and engage in traditional livelihood activities (mostly fishing). In 2000, a young man went away to work outside the state (Chennai city) for 7 to 8 months. Since then, there has been an increasing trend of migrant workers in search of temporal job opportunity outside the state for several months per year. In 2011, 12 migrant workers were counted, though all migrants have continued to live in the village.
Apart from migrant workers, marriage migration is a major form of migration. In general, women are married outside of their natal village, joining their husband’s family in his village [24]. In other words, women tend to leave their place of birth on marriage. The micro-demographic survey showed that 135 women moved to other fisher villages to live with their husband’s family in search of marital life, though the distances are not large on the whole. Out of them, 3 wives divorced and returned back to their natal village due to distress conditions among their husband’s family. On the other hand, there were 131 women who married into their husband’s family in the targeted village. Putting them all together, it can be said that there are no significant differences of changes in the numbers of marriage migrants in and outside the village.
Fishing population and fisheries
Fishing population
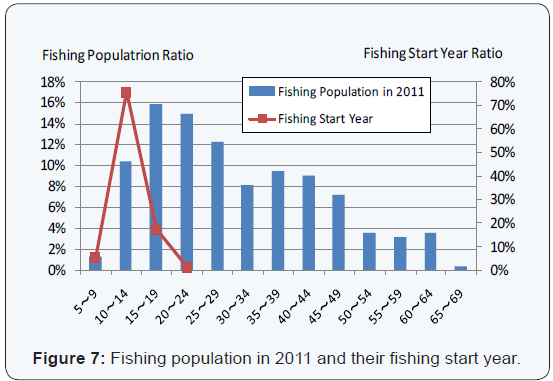
Out of 358 men in 2011, 244 people ranging in age from 9 to 69 years old engaged in nine types of livelihood activities. In particular, 221 working people (91%) lived primarily by fishing. By age group, ages 15-19 (16%) was the highest proportion of fishing population, followed by ages 20-24 (15%), ages 25- 29 (12%), ages 10-14 and 35-39 (10%), etc (Figure 7). Besides fishing, 11 working people (5%) took a second job such as wage labor works and retail business. On this account, it is worth noting that fishing is a sole income source for the majority.
According to the interviews with the fishers, it found that most of the fishers started to join the fisheries at the ages 10-14 (76%). Instead of fishing engagement, they forced to drop out their primary or secondary schools. The lower level of educational attainment may limit alternative jobs except fishing, resulting in increased number of fishing population.
Fishing gears and fishing grounds
In Chilika Lagoon, it is said that fishers limited themselves to catch certain fishery resources in the past. They evolved in a particular original custom among seven sub-caste groups. Each sub-caste group used to catch specific fish, prawn and crabs with different types of fishing gears and fishing grounds. For instance, Keuta who are known as “Kaibarta” used only nets in the middle area of Chilika Lagoon while Tiara used only bamboo traps with “Thatta” at the periphery of the lagoon [25]. As the years passed, however, their fishing practices have been changed to a great extent. In the targeted village, the questionnaire survey identified that the fishers belonging to Kaibarta used five types of fishing nets: Dubi nets (70%), Bekta nets (55%), Khanda nets (44%), Disco nets (10%) and Zero nets (5%). Dubi, Bekta and Disco nets are used mainly for gillnet fishing while Khanda nets are used for trap net fishing to catch prawn. Irrespective of their caste identity (Kaibarta), many fishers tend to use Khanda nets to catch prawn in specific fishing grounds. The traps with a box of fine mesh size nets are set up inside the shallower water for several days. After the nets are cleaned, fishers again quickly fix them. The practice obstructs other fishing methods in the ground fixed by Khandas and gives less access to the limited fishing grounds. According to JICA-CDA Technical Cooperation Project [20], 3,539 fishers (71%) used Khanda nets out of 4,963 samples in 127 fisher villages.
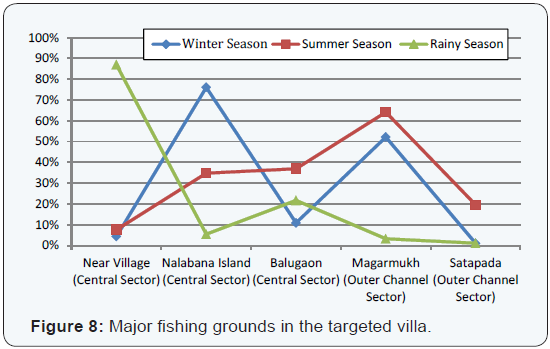
Related to their preference of Khanda nets, the questionnaire survey also revealed that the fishers chose to go fishing in specific fishing grounds seasonally (Figure 8). In rainy season starting from July to October, most of the respondents (87%) caught fishery resources near their village which is located in the central sector of Chilika Lagoon. When it comes to winter season starting from November to February, 76% fishers went to the far central water area of Chilika Lagoon around Nalabana Island while 52% fishers went fishing to the outer channel sector of Chilika Lagoon near Magarmukh. In summer season which is considered to be good for catching prawn, the fishers engaged in the fisheries near Magarmukh (64%) and Satapada (20%) in the outer channel sector of Chilika Lagoon. In addition, they also moved to Balugaon (37%) and Nalabana Island in the central sector. Related to the finding, Iwasaki [26], who collected 195 samples in eieght fisher villages covering all four ecological sectors of Chilika Lagoon, also illustrated seasonal changes in fishing grounds. Suppose the fishers prefer to use Khanda nets in specific grounds particularly in summer and winter seasons, fishing population growth will boost the likelihood and intensity of excessive competition among resource users in the future./p>
Conclusions
Demographic change is considered an important factor for managing the fisheries, but little is actually known about demographic characteristics of fishing communities and their causes [4]. On this account, this article examined the changes which have taken place in the number of fishers and their families in the context of demographic trends. The micro-demographic survey revealed that there has been an increasing trend in the proportion of the village population during the period from 1981 to 2011. In the short term, the trend will be gradually continued in terms of age structure. The population growth was largely determined by fertility and mortality in comparison to migration. There was a significant difference in the age of first marriage between 2001-2010 and other periods. It is probable that the level of educational attainment might affect fertility, reducing the TFR to some extent. Likewise, the lower levels of U5MR and IMR were found in the targeted village than in rural area of Odisha state of India. These findings in the targeted village may not necessarily be common fisher villages of Chilika Lagoon. But assuming that all things are equal, it seems that changes in total fish landings of Chilika Lagoon were not strongly linked to the demographic factor. Irrespective of the sharp decline in the fish landings (Phase II), the levels of mortality were improved to some extent. Besides, most of villagers still continued to rely on the fisheries at that time. Before the entry of high school, young men tend to drop out their schools and then engage in the fisheries. The situation is similar to other research papers [8,26]. In the future, the lower level of educational attainment may limit alternative jobs except fishing, resulting in increased number of fishing population in Chilika Lagoon.
From the viewpoint of fisheries resource management, it is worth noting that fishing population growth in Chilika Lagoon will boost the likelihood and intensity of excessive competition among resource users in the future. The attractiveness of improved fishing gears and high price of prawn triggered many fishers to change fishing operation from their conventional methods to intensified trap nets called “Khanda”, which now covers a large portion of Chilika Lagoon. In particular, the fishers go fishing to specific lucrative fishing grounds in winter and summer seasons where many fishing grounds are encircled by Khanda nets, making it difficult to adopt multi-strata use of fishing activities in one spot as the traditional fishermen in each sub-caste group practiced previously. As the fishing population increases, the situation will accelerate “Derby” or “Olympic” fisheries in limited fishing grounds, resulting in overfishing. Although it is estimated that the recent fish landings of Chilika Lagoon are considered to correspond to the MSY level [16], the linkage of demographic factor and socio-economic factor will pose one of major challenges to be solved for resource management.
Lastly, it needs to be mentioned that this article applied a microdemographic approach with the family reconstitution method by using interviews with representatives from all households in a specific fisher village of Chilika Lagoon. The estimated population number in the past might be undervalued due to limited memory traced back to the past and understanding of true age especially for the old. Hence, there is a bit of a discrepancy between actual age and estimated age, though deliberate efforts were made on correcting the data collected from each household by making each genealogical tree per household and cross-checking their families and relatives. Besides, the findings from the micro-demographic survey are just one example out of 127 fisher villages in Chilika Lagoon. However, the micro-demographic survey combining a macro level data such as statistics of human population and fish landings is useful to validate and compliment the overall picture of demographic dynamics. It is true that the results may not necessarily correspond to other fisher villages, but the survey will serve as a basis for paying more attention to demographic factors for resource management among policy makers and practitioners. This approach will be a good entry point to develop better understanding of resource management in the local context.
Acknowledgements
The author acknowledges supports of a MEXT/JSPS KAKENHI Grant (Number 26850148) and extremely thankful to Dr. Ajit Kumar Pattnaik and Mr. Durga Prasad Dash for their wholehearted supports.
References
- FAO (2014) The state of World Fisheries and Aquaculture, Food & Agriculture Organization of the United Nations, Rome.
- Tietze U (2000) Trends in the number of coastal fishers vis-à-vis the status of fisheries resources and the coastal environment. In: Tietze U, Groenewold G, Marcoux A (Eds.) Demographic change in coastal fishing communities and its implications for the coastal environment (No. 403). Food & Agriculture Organization of the United Nations, Rome, pp 11-35.
- Hardin G (1968) The tragedy of the commons. Science 162: 1243– 1248.
- Tietze U, Groenewold G, Marcoux A (2000) Demographic change in coastal fishing communities and its implications for the coastal environment (No. 403). Food & Agriculture Organization of the United Nations, Rome.
- Groenewold G (2000) Socio-demographic characteristics and change in coastal fishing communities. In: Tietze U, Groenewold G, Marcoux A (Eds.), Demographic change in coastal fishing communities and its implications for the coastal environment (No. 403). Food & Agriculture Organization of the United Nations, Rome, pp 60-77.
- CDA (2008) The atlas of Chilika. Chilika Development Authority, Bhubaneswar.
- Iwasaki S, Shaw R (2010) Integrated lagoon fisheries management: resource dynamics and adaptation. Emerald Group Publishing, Bradford, UK.
- Iwasaki S, Razafindrabe BHN, Shaw R (2009) Fishery livelihoods and adaptation to climate change: a case study of Chilika lagoon, India. Mitig Adapt Strateg Glob Change 14 (4): 339-355.
- Das SG (1993) The report of the fact-finding committee on Chilka fisheries. The Fact-finding Committee, Orissa.
- DFGO (1971) Chilka lake: fisheries development project. Department of Fisheries, Government of Orissa, Cuttack.
- Flaherty M, Samal CK (2005) Development of a knowledge-base for coastal aquaculture policy-making, planning and management (summary of major findings). Nabakrushna Choudhury Centre for Development Studies, Bhubaneswar.
- Samal CK (2002) Aquaculture (shrimp) industry in and around Chilika lake: its impact on environment. In: Mishra B, Kar CG, Misra NS (eds) Agro-industries and economic development: a vision for the 21st Century, Deep and Deep Publications, New Delhi, pp 75-84.
- Samal CK, Meher S (1999) Socio-economic survey of villages in and around Chilika. Nabakrushna Choundhury Centre For Development Studies, Bhubaneswar.
- Supreme Court of India (1997) S. Jagannath v. Union of India. AIR S.C.: 811-851.
- CDA (2005) Achievement report 2005. Chilika Development Authority, Bhubaneswar.
- CDA (2013) Annual report 2011-12 2012-13. Chilika Development Authority, Bhubaneswar.
- DFGO, CDA. (2005) Collection and estimation of fish, prawn and crab landings statistics in the Chilika lagoon, Annual Report – 2003-04. A collaborative programme of Department of Fisheries, Government of Orissa and Chilika Development Authority, Bhubaneswar.
- Senapati N, Kuanr DC (1977) Orissa District Gazetteers Puri. Gazetteers Unit Department of Revenue Government of Orissa, Cuttack.
- ARCSCCB (2005) Note on the activities of the office of the Assistant Register of Co-opeartive Societies (Fy) Chilika Circle Balugaon. Assistant Register of Co-operative Societies (Fy) Chilika Circle Balugaon, Bhubaneswar.
- JICA-CDA Technical Cooperation Project (2009) Data book of socioeconomic survey of fishers in Chilika Lagoon. Chilika Development Authority, Bhubaneswar.
- McCaa R (2000) The peopling of Mexico: from origins to revolution. In: Haines MR, Steckel RH (Eds) A population history of north America, Cambridge University Press, USA, pp 241-304.
- Chandramouli C (2011) Census of India 2011–a story of innovations. Press Information Bureau, Government of India, New Delhi.
- Akmam W (2002) Women’s education and fertility rates in developing countries, with special reference to Bangladesh. Eubios Journal of Asian and International Bioethics 12: 138-143.
- Fulford SL (2015) Marriage migration in India: vast, varied, and misunderstood. Boston College Working Paper 820.
- Iwasaki S, Shaw R (2008) Fishery resource management in Chilika lagoon: a study on coastal conservation in the Eastern Coast of India. J Coast Conserv 12 (1): 43-52.
- Iwasaki S (2007) Fishery resource allocation system in Chilika lagoon, India and its social impacts to fisherman villages, Master Dissertation. Kyoto University


