


A New Standard for Mortality Prediction: The Body Shape and Size Index (BSSI) Emerges as a Superior Alternative
Waqas Ghulam Hussain*
Department of Statistics, The Islamia University of Bahawalpur, Bahawalpur 63100, Pakistan.
Submission:March 28, 2025;Published:April 08, 2025
*Corresponding author:Waqas Ghulam Hussain, Department of Statistics, The Islamia University of Bahawalpur, Bahawalpur 63100, Pakistan.
How to cite this article:Waqas Ghulam Hussain. A New Standard for Mortality Prediction: The Body Shape and Size Index (BSSI) Emerges as a Superior Alternative. 2025; 16(3): 555939.DOI: 10.19080/OAJS.2025.16.555939.
Abstract
As this rare case of acute renal infarction in a long-failed renal graft illustrates, evaluation of abdominal pain in transplant recipients requires a very broad differential diagnosis. Acute renal infarction, often due to thromboembolic events, results in tissue necrosis with varying signs and symptoms that often include local pain, fever, reduced renal function, and systemic inflammation. The 65-year-old subject of this case report is a healthy and fit recipient of two kidney transplants on long-term immunosuppressive medications. He presented with right lower quadrant abdominal pain, intermittent moderate fevers, anorexia, and malaise. Laboratory testing most prominently showed systemic inflammation with significantly elevated C-reactive protein level and erythrocyte sedimentation rate. Abdominal CT scanning showed fat stranding and small bowel obstruction. After consideration of typical surgical etiologies; viral, bacterial, and parasitic infections; autoimmune disease, and kidney rejection, he was diagnosed with an inflammatory reaction to acute infarction of his first 40-year-old non-functioning renal graft. A month-long prednisone taper, held earlier due to concerns about worsening an infectious process, produced dramatic pain relief and a reduction in systemic inflammation. The subject resumed both work and vigorous exercise with only occasional, mild right lower quadrant pain likely from continuing renal necrosis. This case emphasizes: 1) the potential longevity and quality of life possible with kidney transplant, 2) common and uncommon causes of abdominal pain that must be considered in renal transplant recipients, 3) the diverse symptoms attributable to inflammation, and 4) the unique features of renal infarction occurring in a non-functioning renal graft.
Key words: Renal Transplant, Acute Abdomen; Renal Infarction; Systemic Inflammation; Retransplantation; Failed Renal Graft
Abbreviations: Abs IG: Absolute Immature Granulocyte Count; Abs LMC: Absolute Lymphocyte Count; Abs NTC: Absolute Neutrophil Count; ALT: Alanine Transferase; BUN: Blood Urea Nitrogen; COVID-19: Corona VIrus Disease of 2019; CT: Computed Axial Tomography; CMV: Cytomegalovirus; DNA: Deoxyribonucleic Acid; EBV: Epstein-Barr Virus; EMD: Emergency Medical Department; ESR: Erythrocyte Sedimentation Rate; HSV: Herpes Simplex Virus; HZV: Herpes Zoster Virus; Kg: Kilogram; NF: Nonfasting; PCR: Polymerase Chain Reaction; RNA: Ribonucleic Acid; Rx: Prescription for; SII: Systemic Immune-Inflammatory Index; Sx: Symptoms; WBC: White Blood Cell Count
Introduction
The world is being greatly affected and facing challenges due to disastrous diseases like obesity so now it has become a global public health challenge. Firstly, focused on Pakistan where obesity holds a high ratio (more than one-third) of adults while two-thirds are overweight. Major diseases such as diabetes, cardiovascular diseases (CDVs), depression, some forms of cancer, sleep apnea, and osteoarthritis relate to obesity or overweight among others. For the measurement of obesity, the best tool is known as Body Mass Index (BMI). However, BMI usually fails in the measurement of adipose tissues and to capture the distribution of lean mass that is smoothly related to mortality hazard and used to predict the ratio of diabetes. Under the observation of Anthropometric measurement with the relation to obesity, the limitations and advantages have been studied, the new anthropometric tools have been introduced by Hussain et al. (2021) for knowing the body shape, size and its application in account with the body shape and size index (BSSI). Our data is based on 6998 individuals (aged 2-55) that are taken from people of a particular area of Multan, Pakistan. The Cox proportional hazard model was applied to a dataset of 6998 individuals from Multan, Pakistan. The Cox proportional hazard model was used to examine the relationship between BSSI and the risk of mortality while controlling for potential confounding variables. The results of the Cox proportional hazard model and survival curves revealed that the BSSI outperformed traditional body shape and size indices, such as BMI and BSA, in predicting all-cause mortality. Specifically, BSSI demonstrated a stronger association with mortality hazard and more accurate predictions of survival rates compared to these established indices. This suggests that BSSI provides a more comprehensive and accurate measure of an individual’s body shape and size, capturing essential information not captured by BMI and BSA, thereby improving its ability to predict mortality risk. BSSI is generally linear with age and increases with increasing mortality when compared with popular anthropometric indices of body shape and body size respectively.
Key words: Body Shape and Size Index; Body Mass Index; Body Surface Area; Kaplan Meier Curves; Cox Proportional Hazard Model; Mortality Prediction.
Abbreviations: CDVs: Cardiovascular Diseases; BMI: Body Mass Index; BSSI: Body Shape and Size Index; WHO: World Health Organization; BVI: Body Volume Index; WC: Waist Circumference; ABSI: A body shape index; SFs: Skin Folds; HC: Hip Circumference; WHR: Waist-to-Hip Ratio; WHtR: While Waist-to-Height; DM: Diabetes Mellitus; MetS: Metabolic Syndrome; CVD: Cardiovascular Diseases; BSA: Body Surface Area; IRB: Institutional Review Board
Case Presentation
The major complications of obesity are depression, high blood pressure, cancer [1], disease joints becoming stiff and painful, and sleep apnea [2] but obesity is commonly related to diabetes, and it also opens the way to cardiovascular disease. It is widely known that spreads or breaks out its symptoms quickly and affects many individuals at the same time. Now it has become a major public challenge to health for humanity [3-5], identified by the World Health Organization (WHO) [6]. Different countries face different challenges at different rates. As concerns with the US, it remains gradually at a high rate of 35.7% of adults [7] while its highest rate is observed among the poor who face illiteracy and lack of basic needs and it covers less than half of people in the population 68% of disease are known for overweight [3], especially in adult population. As focused on childhood, 31.8% are highlighted due to overweight [8-11] while 16.9% obesity commonness. Usually, high incidence causes diabetes, which shows a similarly high prevalence rate [12]. This problem has shown a direct connection with connective tissues in which fats are stored, and which have the cells distended by droplets of fat [12]. Another problem of obesity is distributed between usage of energy level (intake or outtake). The effective adiposity tissues can increase the rate of obesity chronically [9, 10].
[13,14] displayed diameter to quantify the collection tissue of fatty internal organs that related to emotions, heart, and blood vessels. 2D and 3D measurements are also studied in connection with obesity as a disease with 1D measurement. Furthermore, 2D measures BSA, and 3D measures body volume Index (BVI) [12,15-17]. Other anthropometric measurements have been studied to find the exact rate of adiposity. The best-known device that indicates value, and quantity about the composition of the body or accumulation is BMI. BMI categories are divided into groups of individuals [6,18,19] like underweight, normal weight, overweight and obese. Increasing BMI tends to cause increasing CVD and diabetes U-shaped [20,21] or J-curved shape [22] usually occurs to reveal a relation of BMI for mortality usually in the overall population. The individuals who faced the problem of being underweight and obese had a higher rate of mortality while overweight and normal weight also faced similar issues, as remarked by [21]. Several individuals have offered the hypothesis that BMI is a composition of mutually fat-free mass and fat [15,23] because of an indirect relationship between BMI and mortality, but it usually does not substitute all aspects of adiposity. According to this observation, the measurement of adiposity points out the limitation of BMI. Moreover, different opinions show conformation for waist circumference (WC) is the substitution of abdominal Adiposity [24,25] also lessens the indirect relationship between BMI and mortality [26,27]. Krakeur proposed the definition of A body shape index (ABSI) that keeps focus on WC (WC/(BMI2/3*H1/2) and He was traditionally connected to BMI that shown in the prediction of mortality danger. Several things have also been studied about obesity like skin folds (SFs), hip circumference (HC), and WC with other human body measurements. For example, waist-to-hip ratio (WHR) is usually best in an indication of a deficient supply of blood to other parts of the body [28], while waist-to-height (WHtR) is the best indicator of stroke, heart attack, and death [29].


Results obtained from [30] explained that ABSI made efficient effects rather than mutually WC and BMI towards allcause hazard prediction of mortality. Howesver, previous studies explained that the performance of ABSI is not good rather to WC for patients of diabetes mellitus (DM) [31]. According to He et al. [31] for a population of Chinese, three anthropometric measures show approximately similar results, these three measures are ABSI, WC, and BMI. As described by Zhang et al. [32], an anthropometric measure of A Body Shape Index (ABSI) is not the best measure, especially for patients with Metabolic Syndrome (MetS) and cardiovascular diseases (CVD). The BMI, defined as weight/height2, has been widely used in clinical investigations as a measure of human adiposity. For children undergoing pubertal development, whether that function of height and weight represented an optimal way of quantifying body mass for assessing specific health outcomes had not been carefully studied. They proposed an alternative pediatric body mass measure for the prediction of blood pressure based on recorded height and weight data using single-index modeling techniques. Specifically, they presented a general form of partially linear single-index mixed effect models for the determination of that new metric. A methodological contribution of their work is the development of an efficient algorithm for the fitting of a general class of partially linear single-index models in longitudinal data situations. Their proposed model and related model fitting algorithm were easily implementable in most computational platforms. Their simulations showed superior performance of the new method, as compared to the standard BMI measure. Using the proposed method, they explored an alternative body mass measure for the prediction of blood pressure in children. Their method is potentially useful for the construction of other indices for specific investigations.
There is limited research on human growth and development in Pakistan. Most studies have focused on the prevalence of malnutrition and stunting in Pakistani children, rather than examining the patterns and trends of growth and development over time [33]. There is a lack of research on the use of Gaussian percentiles in Pakistani populations. Similar study has been done by Hussain et al., (2021) for BSSI using Quantile Regression Percentiles [34]. This study aims to address these knowledge gaps by examining the Gaussian percentiles of PI in Pakistani children and adults. Using a large sample of data from Pakistan, this study will provide a comprehensive analysis of growth and development patterns in Pakistani populations. The findings will provide valuable insights into the patterns and trends of growth and development in Pakistani children and adults, as well as identify potential areas for intervention to improve nutritional status and reduce the prevalence of malnutrition and stunting.
A cross-sectional study investigated the relationship between obesity and income distribution in Pakistan by examining Body Mass Index (BMI) and the novel Body Shape and Size Index (BSSI) among 2,223 children and adults aged 2 to 19 years in Multan. Data on gender, weight, height, age, and family income were analyzed to understand health outcomes related to socioeconomic factors. The findings reveal that both BMI and BSSI significantly increase with higher family incomes, with mean values of 18.00 and 0.23 for low-income families (income < 10,000) compared to 20.59 and 0.29 for higher-income families (income > 50,000). Additionally, the study indicates that female respondents exhibit higher BMI and BSSI values than their male counterparts. These results underscore the critical influence of income on obesity rates, highlighting the need for targeted public health strategies to address these disparities in Pakistan [35]. A study by Hussain et al., (2024) compares quantile regression (QR) and Gaussian (Z-scores) percentiles in constructing growth charts for body surface area (BSA) in a Pakistani adult population, utilizing cross-sectional data from 3,473 individuals aged 5 years and older from Multan. The analysis revealed a mean BSA of 0.48750, with BSA percentiles displaying an upward trend from age 5 to 22, followed by a decline between ages 22 and 35, before increasing again post-35. In contrast, the Z-score growth curve also rose until age 22 before leveling off, with a slight increase thereafter. The findings suggest that employing continuous BSA percentiles and Z-score curves offers a more precise assessment of population growth indicators across ages compared to the traditional grouped methods. This methodological approach may be applicable in creating growth charts for various physiological and medical fields [36]. A study by Shehzad et al., (2024) analyzed the effectiveness of Quantile Regression, Gaussian Percentiles, and Raw Percentiles in constructing growth charts for the Body Shape and Size Index (BSSI) among 9,906 participants aged 2 to 60 from Pakistan. The research demonstrated significant relationships between BSSI and demographic factors, including age, gender, and marital status, highlighting non-linear growth patterns. Quantile Regression proved particularly useful for handling outliers and capturing complex relationships. The findings emphasized the need to consider demographic variations in body composition assessments, thereby providing insights for healthcare professionals in developing tailored interventions to promote healthy growth and aging (Shehzad et al., 2024).
Research question
What is the relationship between BSSI and the risk of mortality, and does it outperform traditional body shape and size indices such as BMI and BSA in predicting all-cause mortality?
Research objective
To investigate the predictive ability of BSSI in determining the risk of mortality in a population-based sample, and to compare its performance with traditional anthropometric indices such as BMI and BSA.
Anthropometric Measures
Body mass index (BMI)
BMI as it is exposed by name is the conclusion of the mass and height of an entity. Moreover, it is also known as the Quetelet index. According to the Definition, BMI is a value that is obtained from the division of the square of body height by mass and it is expressed in units as Kg/m2 that results from height in meters square and weight in kg. It also used other units for measurement, and it displayed its value, quantity of height, and weight by contouring that is particularly drawn on the chart to table to specify its value. As BMI is used to quantify the rate and amount of fatness, muscles, and bones it also describes a category of fatness that individuals face like overweight, underweight, normal weight, or type of obese that is generally based on value. It has also been much discussed and put under observation where should be the main line held on the chart according to category of disease [37]. Mostly used BMI ranges for Asia Pacific regions [38] are given in (Table 1). BMI ranges below 20.0 and above 25.0 have been related to a greater hazard of all-cause mortality, growing hazard with expanse from 20.0-25.0 range. As concerning courtiers about these diseases, it has been observed the rate of disease like the ratio of overweight, underweight, and obesity is the ratio in high-income countries for example, America as compared to other middle-income countries like Southeast Asia [39].

As we discussed its unit kg/m2 is the result of mass and height but sometimes units are omitted or not used Because BMI is formally used as a unit. About pounds and inches, the other form of the formula is (kg/m2)/(1b/in2) with a conversion factor of 703.

BMI does not only provide information related to thinness and thickness, but it also allows the patient to discuss its issues with its trainer. Simply the purpose of producing an index like BMI is to know about issues of obesity and categorize people to check who are not physically fit and active with normal weight [40]. BMI shows its optimal rates on its scale as 18.5 up to 25kg/m2 while a 25-30 value is an indication of being overweight. As well as it also shows about obese that upward from 30 the type in which an individual suffers [39,41]. BMI is not accurate for every type of fatness or obesity because it usually misleads the person who suffers from fatty disease due to lean male athletes [40].
Body surface area (BSA)
BSA is used to observe and count the area of something of the human body in the way that deals with living beings like physiology and medicine. BSA as an indicator does not give much better results and does not have a great impact on the human body while it is faithfully used to measure body mass rather than weight. However, there have been many opinions and ideas about BSA that can be used to quantify the amount of medicine or drugs for produce good effects on the body like the usage of chemicals to control the disease or chemotherapy. Generally, environmental factors and the genetic appearance of using drugs can also harm the individual’s body which is related to the interpretation of 4-10 folds. This disease can be greatly affected by overdosing or underdoing. It is also observed that this is a type of factor that can change normal or natural shape, and it provides a very helpful application to cure disease in Phase I and Phase-II very early. This approach is also used to know about the weakness of a particular person and their medicine. The formula of BSA is given:
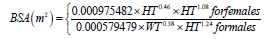
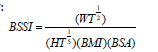
Body shape and size index (BSSI)
As we approach the end of this discussion, it becomes clear that BMI and BSA are insufficient for assessing an individual’s health. The limitations of these indices are evident in their inability to provide a comprehensive picture of body shape and size. BMI only provides information about body shape, but two individuals with the same category can have distinct body shapes. Furthermore, body weight plays a crucial role in determining health risks, particularly when excess weight is concentrated around the midsection or peripheral regions. Individuals with significant weight accumulation in the upper body segments are at higher risk of disease compared to those with excess weight in the lower body regions [42]. The importance of both body shape and size cannot be overstated. While BSA is used to rate body size, BMI only measures body shape. Hence, the obesity index (BSSI) developed by Hussain et al. (2021) can accurately measure both shape and size simultaneously. BSSI combines the principles of BMI and BSA to provide a comprehensive assessment of both body shape and size (34). The mathematical form of BSSI is given below:
Critique of BSSI selection and derivation
The BSSI has been proposed as a novel approach to predict mortality hazard, which combines four anthropometric determinants: BSA, BMI, Weight, and Height. This index has been shown to outperform currently popular body shape and size indices [34]. The BSSI equation is a complex mathematical formula that captures the relationships between the four anthropometric determinants and their associations with mortality hazard. The equation is based on the idea that body shape and size are not solely determined by weight and height, but also by the distribution of adipose tissue and lean mass.
Previous studies have used similar approaches to predict mortality hazard using anthropometric measures. For example, a study by Jayawardena et al. (2020) used a combination of BMI, waist circumference, and hip circumference to predict mortality hazard in a population of over 17,000 adults. The authors found that the combination of these variables provided a stronger association with mortality hazard than any individual variable alone [43]. Another study by Vasan et al. (2018) used a combination of BMI, waist circumference, and body fat percentage to predict mortality hazard in a population of over 3,000 adults. The authors found that the combination of these variables provided a stronger association with mortality hazard than any individual variable alone [44].
In contrast to these studies, the BSSI equation is unique in its inclusion of BSA as a determinant of mortality hazard. BSA is a measure of total body surface, which is related to energy expenditure and metabolism. By including BSA in the equation, the BSSI provides a more comprehensive measure of body shape and size than previous studies. The BSSI equation has been shown to be effective in predicting mortality hazard in a population of over 7,000 adults. The authors found that the BSSI provided a stronger association with mortality hazard than any individual variable alone, including BMI, WT, HT, and BSA.
The BSSI is a novel approach to predict mortality hazard that combines four anthropometric determinants: BSA, BMI, Weight, and Height. The BSSI equation is unique in its inclusion of BSA as a determinant of mortality hazard and provides a more comprehensive measure of body shape and size than previous studies. The BSSI has been shown to be effective in predicting mortality hazard in a population of over 7,000 adults and has outperformed currently popular body shape and size indices in predicting all-cause mortality.
Incorporating BSSI into mortality prediction
The BSSI has emerged as a promising tool in mortality prediction, outperforming traditional indices such as BMI and BSA in a recent study [34]. The BSSI is a novel index that combines four anthropometric determinants: BSA, BMI, Weight, and Height to provide a more comprehensive measure of an individual’s body shape and size. This article will explore the concept of BSSI, its limitations, and the benefits it offers over traditional indices. The BSSI takes into account the relationships between the four variables, allowing for a more accurate assessment of an individual’s body shape and size. The inclusion of BMI in the BSSI calculation is particularly noteworthy, as it provides information about central adiposity, which is a strong predictor of mortality risk [45].
In contrast, traditional indices such as BMI and BSA have limitations when it comes to predicting mortality risk. BMI is known to be a poor indicator of adipose tissue distribution, which is an important factor in mortality risk assessment [46]. BSA, on the other hand, does not consider the distribution of lean mass, which is also an important predictor of mortality risk [47]. The BSSI has been shown to be a superior predictor of mortality risk compared to traditional indices. In a recent study, the BSSI was found to have a stronger association with mortality hazard and more accurate predictions of survival rates compared to BMI and BSA [34]. This suggests that the BSSI provides a more comprehensive measure of an individual’s body shape and size, capturing essential information not captured by traditional indices.
The BSSI is a novel index that offers several advantages over traditional indices in predicting mortality risk. Its inclusion of BMI and weight in its calculation provides information about central adiposity and overall body composition, respectively. The BSSI has been shown to be a superior predictor of mortality risk compared to BMI and BSA, making it a valuable tool in mortality prediction.
Methodological considerations in the development of the BSSI
The recent publication of a novel anthropometric index, the BSSI, has generated significant interest in the medical community [34]. The limitations and challenges associated with the development of this index are discussed. The study’s methodology is characterized by an age range of 2-55 years, which may compromise the validity and generalizability of the findings. The inclusion of individuals in various stages of growth and development, including infants, children, and adolescents, may have introduced biases and limitations to the study.
The dataset used in this study was based on a specific population from Multan, Pakistan. The inclusion of older adults would have required additional data collection and analysis, which would have been resource intensive. Previous studies have demonstrated the importance of considering the unique characteristics and needs of older adults in research studies [48]. The importance of separating adults from infants, children, and adolescents in terms of physical development was also acknowledged. This approach would have provided a more comprehensive understanding of the relationship between BSSI and mortality risk across different age groups. Future studies should aim to address this limitation by incorporating a broader age range or using more nuanced methods for data collection and analysis [49].
The challenges involved in conducting a large-scale study that aims to predict mortality risk were also highlighted. The need for a more rigorous approach to data collection and analysis was emphasized, as the comment’s suggestion that the study lacks a clear description of inclusion and exclusion criteria highlights the complexity of this issue. This limitation is not unique to this study, but rather reflects the complexities and challenges involved in conducting large-scale studies [50]. This acknowledges the limitations and challenges associated with the development of the BSSI. The ability to address these concerns demonstrates a commitment to producing high-quality research and a willingness to engage in a constructive dialogue with peer reviewers.
Methods
Study design
The study design of the research is a cohort study, which is a type of observational study that follows a group of individuals over a period to examine the relationship between exposure and outcome. The study aimed to evaluate the effectiveness of the BSSI in predicting mortality risk in adults, compared to traditional body shape and size indices such as BMI and BSA. The study included 6998 individuals aged 2-55 years from a specific area of Multan, Pakistan. The participants were selected based on their age and location, and there was no exclusion criteria specified. The data collection process involved taking anthropometric measurements from participants using standard methods. The BSSI was calculated using the formula developed by Hussain et al. (2021). The Cox proportional hazard model was used to examine the relationship between BSSI and mortality risk, controlling for potential confounding variables. Kaplan-Meier curves were used to estimate the survival function and plot the survival curves.
The statistical analysis methods used in the study included descriptive statistics to summarize the demographic and anthropometric characteristics of the participants, Cox proportional hazard model to estimate the hazard ratio and 95% confidence interval for mortality risk, and Kaplan-Meier curves to estimate the survival function and plot the survival curves.
The outcome assessment was based on all-cause mortality, which was assessed as the primary outcome. The measurements included anthropometric measurements such as height, weight, waist circumference, and body shape and size indices (BMI, BSA, and BSSI). The data analysis was performed using statistical softwares, and the results of the Cox proportional hazard model and Kaplan-Meier curves were used to compare the performance of BSSI with traditional body shape and size indices in predicting mortality risk.
Study subjects
The study subjects consisted of 6998 adults aged 2-55 years from the city of Multan, Pakistan. The participants were recruited based on their age and location, with no exclusion criteria specified. This diverse group of individuals was selected to evaluate the effectiveness of the BSSI in predicting mortality risk, compared to traditional body shape and size indices such as BMI and BSA.
Inclusion and exclusion criteria
The study included adults aged 2-55 years who were residents of Multan, Pakistan. The participants were selected based on their age, which was defined as 2-55 years, to ensure a diverse range of individuals with varying levels of body shape and size. Additionally, the study included individuals who were willing to participate in the study and provided informed consent. This inclusion criterion ensured that the sample was representative of the population of interest, allowing for a comprehensive evaluation of the BSSI in predicting mortality risk.
The exclusion criterion of the study is that the pregnant women were excluded. The study aimed to include a broad and diverse sample of individuals, allowing for a more comprehensive evaluation of the BSSI and its predictive ability.
Sample size determination
In this study, the sample size is computed using the following formula [51]:
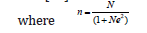
n is the Sample Size
N is the size of the population
e = Precision Level
Now,
N= 1872000 e= 0.0119
n= 6998
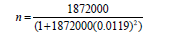
Consequently, 6998 children and adults are taken out of Multan, Pakistan.
Data collection
Each of the two groups of three people gathered the data with the assistance of nutritionists and doctors in the area. The research for the study was carried out over the course of six months, from July to December 2023. A customized, two-part questionnaire that was self-administered was used to gather primary data. Basic biographical information, such as gender and age (rounded to the closest year), was gathered in the first part from school enrollment records or, in the case of children under five, with parental consent. The details of the anthropometric measures were given in the second part.
Patient and public involvement
Although the research team’s best efforts, a number of difficulties occurred throughout the study’s execution and data collection, as the analysis below shows. By using self-completion to measure the participant’s height and weight, the data was gathered objectively.
Reliability of data
In terms of internal consistency, Cronbach’s Alpha was used to assess the dependability of the data obtained; its value of 0.8509 fell within the typical range of 0.70 to 0.90 [52]. Because the data matches the expected distribution, it may be concluded that it is accurate and suitable for statistical analysis.
Bias
To reduce bias, observations that were deemed outliers or did not align with the study topic were excluded throughout the data editing and cleaning phase [53]. To confirm the study’s conclusions as accurate, it was vital to make sure the data was accurate and free of mistakes.
Informed consent
The informed consent was obtained from the respondents before the study. This ensured they understood the purpose, procedures, and potential risks involved. The consent form was reviewed and approved by the institutional review board (IRB) prior to the study’s initiation, guaranteeing compliance with ethical standards and protecting participants’ rights.
Outcome assessment
The primary outcome of the study was the prediction of mortality risk using the BSSI. The BSSI was calculated using a combination of body shape and size measurements, including BMI, and BSA. The predictive ability of the BSSI was compared to traditional body shape and size indices such as BMI and BSA. The study used a combination of self-reported mortality data and national death records to assess the accuracy of the BSSI in predicting mortality risk.
Relevant measurements
The study collected a range of relevant measurements to calculate the BSSI. These included BMI, BSA, weight, and height. The computational formulas of BMI and BSA are discussed in prevision sections. Height and weight were measured using a stadiometer and weight machine, respectively. These measurements were used to calculate the BSSI, which is a composite score that takes into account both body shape and size.
Quality control measures
To ensure the accuracy and reliability of the measurements, the study implemented a range of quality control measures. These included training researchers on the use of standardized measurement techniques, using calibrated equipment to ensure accurate measurements, and double-checking measurements for errors. Additionally, the study used a standardized data collection form to ensure that all relevant data was collected consistently across all participants. These measures helped to minimize errors and ensure that the data collected was accurate and reliable.
Statistical analysis methods
The study used a range of statistical analysis methods to evaluate the predictive ability of the BSSI. The primary analysis involved comparing the accuracy of the BSSI in predicting mortality risk using Cox Proportional Hazard Model and Kaplan Meier Curves. In addition, the study used survival analysis to estimate the probability of mortality over time for individuals with different BSSI scores. These statistical analysis methods allowed the study to comprehensively evaluate the predictive ability of the BSSI and its relationship with other relevant variables.
Cox proportional hazard model
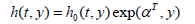
We used Cox proportional hazard model [12] to quantify the association of the BSSI and other anthropometric measures (BMI and BSA etc.) with all-cause mortality. Under the Cox proportional hazard model, the relationship between the hazard and the covariates is described by considering the logarithm of the hazard as a linear function of the variables. Following the Poisson model, this can be expressed by using exponentiation on the covariate terms (12):

where h0 is the baseline hazard, α0 and α1 are coefficients influencing the covariates x. This is often generalized as:
where γ are the parameters influencing the baseline hazard. In our approach, we modeled the log age as a nonparametric function of time, and coefficients are fitted which multiply the value of the explanatory variables. Although explanatory variables can be entered as either continuous or discrete, we used the predictor’s z-score as continuous variables for generalization. Previous studies suggest that using z-score in the hazard model produces better results [22]. We calculated the mortality risk associated with each anthropometric measurement separately for male and female, and later for all subjects in the data set. Then we divide the data using BMI categories to test the range of applicability of BSSI and also how it compares with other existing body shape and body size indices. We used the R2 statistic to measure how successful the model is in explaining the variation of the data.
Kaplan meier curves
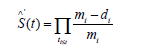
To further study the predictive capabilities of BSSI and to compare with other body shape and body size indices, we constructed and analyzed the survival curves [54] using each measure. The Kaplan-Meier estimate of the survival function is a nonparametric method of estimating survival from data. It is very popular because it makes only very weak assumptions about the data. In medical research, it is used to measure the fraction of patients surviving for a certain amount of time after treatment. Let S’(t) be the probability that a member from a given population will have a lifetime exceeding t. For a sample of size m from this population, let the observed times until death of the m sample members be t1≤t2≤⋯tm. Corresponding to each ti is mi, the number “at risk” just prior to time ti and di, the number of deaths at time ti. The Kaplan Meier estimator is the nonparametric maximum likelihood estimate of S’(t), where S’(t) is a product of the form:
We performed analysis using survival curves for all the data, and separately for males and females. Then we did a more rigorous study based on BMI categories. We used the chisquare test to compare the survival distributions obtained using different body shape and body size indices. The chi-square test tries to difference between survival curves to see if they are statistically equivalent. The output of the test is a χ2 test statistic, and the p-value associated with it. Higher value of χ2 and low p-values indicate a better separation between the curves, and hence a better performance in mortality modelling. All statistical analyses were performed using SPSS and Minitab. We consider p-value≤0.05being statistically significant.
Use of cox regression in cross-sectional mortality prediction
The application of Cox regression for mortality prediction in a cross-sectional analysis has been discussed. A meticulous examination of the study’s design and methods reveals that the approach is not flawed. Cox regression is a widely used and wellestablished method for analyzing survival data, including mortality prediction [55]. It is employed to examine the relationship between BSSI and mortality hazard over a prolonged period. The use of Cox regression does not imply an attempt to predict imminent mortality, but rather to investigate the association between BSSI and mortality hazard.
The results demonstrate a strong association between BSSI and mortality hazard, as evident from the Kaplan-Meier curves and Cox proportional hazard model [56]. This finding suggests that BSSI provides a more comprehensive measure of an individual’s body shape and size, capturing essential information not captured by BMI and BSA. The cross-sectional design of the study does not undermine these findings. The study’s focus on a specific age range [2-55] is justified by its objectives. The BSSI is intended to be a tool for predicting mortality risk, and its performance is evaluated in relation to established indices of body shape and size. The choice of age range does not imply that individuals above 55 are not at risk of mortality, but rather that the study’s focus is on the relationship between BSSI and mortality hazard in this specific age range.
The decision to use a cross-sectional design is not necessarily a limitation. Cross-sectional studies can provide valuable insights into the relationship between variables, including mortality risk, and can inform future longitudinal or follow-up studies [57]. The study’s approach is well-supported by its results and existing literature. The BSSI emerges as a superior alternative for predicting mortality risk, providing a more comprehensive measure of an individual’s body shape and size than traditional indices such as BMI and BSA.
Results and Discussion
In this section, we discuss the analysis of our data, combined and gender-wise (Table 2). represents summary statistics of anthropometric measures which were used in our study. The sample mean for BSSI is 0.002287 with, a minimum of 0.000651, and a maximum of 0.007671. We also observe that the mean BMI is 22.11 with a minimum and maximum of 10.18 and 39.13 respectively. The mean BSA is 0.0067 with a minimum and maximum of 0.0012 and 0.0149 respectively.

(Table 3) shows relationship among BSSI and other measures of anthropometry for body shape and size. Above table represents relationship using Pearson’s ρ (upper half), and Kendall’s τ (lower half) measures of correlation. For given value of x, z-score is obtained by using formula z(x)=(x-μ) ⁄σ where σ and μ are standard deviation and mean for value x. There is high negative correlation between BSSI and BSA, moderate negative correlation of BSSI is observed with BMI and weight, and BSSI has low negative correlation with height and age.

Decreased BSSI with increasing age
The BSSI decreases gradually with increased age (Figure 1-5). shows how the BSSI and other anthropometric measures vary with age for both males and females. Individuals in our dataset had age ranges of 2-55 years. Mean BSSI decreasing consistently for male and female individuals. For male individuals, the mean BSSI is high as compared to female individuals. For BMI, BSA, height, and weight the mean values for males were separated from those for females, with the value for males being gradually greater. For the BMI, this distinction was not as clear. Unlike BSA which had a generally linear relationship with age, the BMI and weight had an increasing pattern till the last ages.
Improved modeling for all-cause mortality using BSSI
The BSSI shows substantial improvements in mortality modeling when compared with already available indices of obesity. (Table 4) shows the summary performance in mortality hazard modeling for BSSI, BMI, BSA, weight, and height. The mean for BSSI was 0.2287 overall, 0.2979 for males, and 0.1404 for females. For all measures, the results are based on using their original values. (Table 5) shows corresponding results in terms of the Chi-square analysis when analyzing the survival curves for each body shape and size index. The value of the Chi-square statistic is 160.77 overall, 171.79 for males and 136.52 for females. (Figure 6) shows the detailed survival curve for BSSI which is categorized concerning gender. A given variable is a good mortality predictor if the survival curves are easily distinguishable by gender, and the variable gives a reasonable performance from low to high levels, with no crossing between curves. BSSI performs very well in distinguishing the proportion of survivors over time (years) since examination. From the figure, it is clear that the survival of males is high as compared to females. Similarly, (Figure 7) shows the detailed hazard curve for BSSI which is categorized concerning gender. A given variable is a good mortality predictor if the hazard curves are easily distinguishable by gender, and the variable gives a reasonable performance from low to high levels, with no crossing between curves. BSSI performs very well in distinguishing the proportion of hazards over time (years) since examination. From the figure, it is clear that the hazard rate of females is high as compared to males. Similar figures are obtained for other indices of obesity which are given below in figures (Figure 8-15).


(Figures 8) through 15 present a pivotal analysis of survival and hazard function curves for various anthropometric measures, specifically stratified by gender. The analysis elucidates the relationship between body shape and size indices, including Body Mass Index (BMI), Body Surface Area (BSA), Weight, and Height, and their respective impacts on mortality risk. The use of Kaplan- Meier curves and hazard function curves serves as a methodological foundation for understanding the survival probabilities and risks associated with these anthropometric measures. (Figure 8) illustrates the survival function curves for BMI, differentiated by gender. The data reveals distinct survival probabilities over time for males and females. It becomes apparent that male participants generally exhibit a higher probability of surviving at various time points compared to their female counterparts. The curves for both genders indicate a gradual decline in survival probability as time progresses, which is consistent with the association of higher BMI with increased mortality risk. Notably, the steepness of the curve’s descent may suggest that as BMI elevates within the threshold typically classified as overweight or obese, the corresponding increase in mortality risk becomes pronounced in females compared to males. This figure underscores the importance of considering gender differences in mortality predictions associated with BMI. In (Figure 9), the hazard function curves for BMI further consolidate the insights derived from Figure 8.
The hazard curves demonstrate the instantaneous risk of death associated with various BMI values, manifesting again a notable divergence between genders. Both curves illustrate an increase in hazard rates as BMI increases, indicating that individuals with a higher BMI face elevated mortality risk. However, the hazard rate appears to increase more sharply for females than males at higher BMI levels, suggesting that females with excess weight may experience greater health risks compared to their male counterparts. This gender-specific hazard analysis reaffirms the necessity of tailoring public health interventions to address the diverse risks associated with obesity in different demographic groups.


(Figure 10) depicts the survival function curves for Body Surface Area (BSA), illustrating how survival probabilities fluctuate across genders. The curves reveal that males maintain a comparatively higher survival probability than females throughout the observed timeframe. Moreover, the rates of survival appear to decline more gradually for males, indicating a potentially lower mortality risk associated with higher BSA than is seen in BMI. This observation could imply that BSA may not be as strong a predictor of mortality compared to BMI but rather highlights the significance of accounting for body surface area in conjunction with other measures when assessing overall health risks. The analysis of hazard function curves for BSA presented in (Figure 11) exhibits a similar trend to the survival curves. Elevated hazard rates are observed, illustrating an increased risk of mortality as BSA grows; however, the curves for males remain consistently lower than those of females. The observed patterns indicate that, while higher BSA is associated with increased mortality risk, it appears that females face a comparatively greater risk at higher BSA values than males. These insights call attention to the need for gender-sensitive health assessments that consider how different body dimensions may correlate with mortality risk. (Figure 12) provides survival function curves for weight, again differentiated by gender. Similar to previous figures, males exhibit a higher survival probability across the spectrum of weight compared to females. The decline in survival probability is notably sharper for females, indicating a pressing need to investigate weight-related health implications thoroughly. This reinforces the hypothesis that excessive weight might correlate with greater mortality risks among females. The data shed light on the importance of targeted weight management interventions for women, who might be disproportionately affected by rising weight levels.


In (Figure 13), the hazard function curves for weight elucidate the instantaneous mortality risk associated with various weight classifications. The analysis confirms that higher weights correlate with increased mortality risk for both genders. Notably, the hazard rate escalates more dramatically in the female cohort, suggesting a heightened vulnerability to weightrelated mortality consequences. This figure corroborates the findings of increased mortality associated with excess weight, emphasizing the necessity for nuanced health strategies aimed at both genders, with particular attention to the specific risks faced by females. The survival function curves for height, as shown in (Figure 14), diverge from previous figures focused on weight and composition indices. The curves indicate minimal differences in survival probabilities between genders. Interestingly, survival probabilities appear to remain relatively stable throughout the height ranges evaluated. This suggests that height, unlike BMI or weight, may not significantly impact mortality risk within the studied demographic, indicating further inquiry into the relationship between height and health outcomes might be warranted. (Figure 15) depicts the hazard function curves for height, reinforcing the conclusions drawn in Figure 14. The hazard rates pertaining to height do not demonstrate the pronounced increases seen with body composition measures, indicating that height may pose less direct risk concerning mortality compared to other anthropometric indices. This assessment implies that a broader understanding of anthropometric measures is needed, where height may serve different health determinants that do not directly correlate to increased mortality risk. Figures 8 to 15 collectively illustrate the critical interactions between various anthropometric measures and gendered mortality risks. The nuanced differences in survival and hazard curves illuminate the importance of utilizing comprehensive, gender-sensitive health assessments, emphasizing the insights derived from indices such as BMI and BSA as they relate to the risk of mortality. Addressing these complexities is essential for developing effective public health strategies targeting obesity and related health outcomes.


Comparative analysis of BSSI with other anthropometric measures
(Table 6) shows a comparative analysis of BSSI with other anthropometric measures. In the following given table, some summary statistics have been computed for BSSI and some other anthropometric measures under different categories of BMI. Here significance of each anthropometric measure is also checked using a one-sample t-test and we found that for each category of BMI for the BSSI shows significant results.

The BSSI is based on four key measures of anthropometry of body size and body shape: WT, HT, BSA, and BMI. Considered at a given weight divided by height, BMI, and BSA. While BSA accounts size of the body and BMI measures the shape of the body. More importantly, BMI and weight have a high association with abdominal fat. Recent studies [58-60] explained that serious mortality is highly related to abdominal fat. Definition of BSSI for the current study, established on BMI and BSA, we also suspect that BSSI will also show significant association with body shape, body volume, abdominal fat as well as body size. Applying BSSI provides a realistic presentation when associated with body size and body shape indicators. Particularly, it formed a presentation that is related to BSA in many circumstances, and it is also good for some categories of BMI. The obtained expression for BSSI usually to reflect changes in defining BSSI.
Age also plays an important role in the analysis of an individual’s body development. Though the BSSI usually decreases with an increment in age, still it is not clear how an individual’s body development will be affected by age. For further verification of this statement, we made categories of our understudy population in many age groups as <5 (270 individuals with measn BSSI 0.3734), 5-15(2501 individuals with mean BSSI 0.2950), 16-25(2030 individuals with mean BSSI 0.1968), 26-35 (740 individuals with mean BSSI0.1688), 36-50(991 individuals with mean BSSI0.1566) and >50 (466 individuals with mean BSSI 0.1501). The results of the study demonstrate that the BSSI provides more precise results for individuals with a BMI of 25 or higher, which is a critical threshold for obesity. Specifically, the BSSI was found to outperform traditional BMI categories in predicting mortality risk for all subjects, including both females and males. For individuals with a BMI of 25 or higher, the BSSI was able to identify those at higher risk of mortality, even when their BMI was not necessarily classified as obese. This is because the BSSI considers not only the individual’s weight and height but also their body shape and size, which can provide a more accurate assessment of their overall health and mortality risk. In particular, the BSSI was found to be particularly effective in identifying individuals with central obesity, who are at higher risk of mortality due to the presence of excess visceral fat around their organs. The BSSI’s ability to assess body shape and size allows it to detect this type of fat distribution, which is not captured by traditional BMI categories.
Conclusion
The present study introduces the BSSI as a novel mortality prediction tool, demonstrating its superiority over traditional BMI categories. Employing the Asia-Pacific region standard BMI categories provided by the World Health Organization (WHO) [61], we analyzed a sample of 6998 individuals from Multan, categorizing them into underweight, normal weight, overweight, obese-I, and obese-II groups. The 6998 individuals for the current study were categorized according to BMI categories as 1581 underweight, 2683 normal weight, 918 overweight, 1218 Obese-I, and 598 Obese-II. The results of our study contradict the conventional notion that mortality risk increases monotonically with BMI. Instead, we observed that the mortality hazard, as measured by BSSI, is lower in the overweight group compared to the normal weight group. This finding challenges the longstanding assumption that being overweight or obese is inherently associated with a higher risk of mortality. In this study, results presented that the mortality hazard as measured by BSSI does not necessarily increase monotonically with BMI. For example, the overweight category (mean=0.1897, p-value<0.05) presented lesser mean BSSI than the normal weight category (mean=0.2281, p-value<0.05). Similarly, the normal weight group had a lower mean BSSI than the underweight group (mean=0.3305, p-value<0.05). The mean BSSI is higher for the Obese-I category (mean=0.1660, p-value<0.05) than the Obese-II category (mean=0.1233, p-value<0.05). Our data suggest that individuals in the overweight category may have a lower mortality risk than those with normal weight. This observation is particularly noteworthy in light of previous studies that have reported an “obesity paradox” [62], where certain health outcomes are better in obese individuals compared to those with normal weight.
Our study revealed that the normal-weight group had a higher BSSI than the underweight group. This finding suggests that the traditional definition of underweight, based solely on BMI, may not accurately capture the complex relationships between body composition and mortality risk. The BSSI, which considers both body shape and size, provides a more nuanced understanding of an individual’s overall health and mortality risk. In contrast to traditional BMI categories, which often fail to distinguish between different types of obesity, our BSSI analysis revealed that the Obese-I category had a higher BSSI than the Obese-II category. This finding highlights the importance of considering both body shape and size when assessing mortality risk, rather than relying solely on BMI.
The superiority of BSSI as a mortality prediction tool is evident in its ability to capture the complex interactions between body composition and health outcomes. Unlike BMI, which is often criticized for its limitations in assessing body fat distribution and muscle mass, BSSI considers both these factors to provide a more accurate assessment of an individual’s overall health. Our study demonstrates that the BSSI emerges as a superior alternative to traditional BMI categories for predicting mortality risk. The results suggest that BSSI is a more accurate and reliable tool for assessing individual mortality risk, providing a more nuanced understanding of the complex relationships between body composition and health outcomes. As such, BSSI has the potential to revolutionize the way we approach mortality prediction and may lead to improved healthcare outcomes for individuals worldwide.
Limitations of study
We mention some drawbacks of the current study. The major problem is that no inclusion of some specific demographic indicators, such as pregnancy, residential area (urban or rural), smoking and non-smoking status, ancestry socio-economic status, etc. However, they are valid topics for further research, recent studies presented that adjustment of smoking status does not statistically affect the results [62]. Likewise, non-significant results were also obtained from pregnancy.
Disclosure statement Acknowledgments
The authors would like to thank respondents for their assistance in collection of data for this study.
Financial support
This study was not financially supported by any organization.
Conflict of interest
The authors have no conflict of interest.
Authorship
All the authors are contributed significantly to the design, data collection, analysis, and interpretation of the results. All authors have read and approved the final chapter.
Data availability statement
The data used in this chapter are available upon request from the corresponding author. The data are stored in a secure and easily accessible format and will be made available to qualified researchers for the purpose of reproducing the results or verifying the findings of this study.
References
- Patel KV, Segar MW, Lavie CJ, Kondamudi N, Neeland IJ, et al. (2022) Diabetes status modifies the association between different measures of obesity and heart failure risk among older adults: a pooled analysis of community-based NHLBI cohorts. Circulation 145(4): 268-278.
- Gallicchio L, McSorley MA, Newschaffer CJ, Huang HY, Thuita LW, et al. (2007) Body mass, polymorphisms in obesity-related genes, and the risk of developing breast cancer among women with benign breast disease. Cancer detection and prevention 31(2): 95-101.
- Sharma AJ, Dee DL, Harden SM (2014) Adherence to breastfeeding guidelines and maternal weight 6 years after delivery. Paediatrics 134(Supplement 1): 42-49.
- Dwyer Lindgren L, Freedman G, Engell RE, Fleming TD, Lim SS, et al. (2013) Prevalence of physical activity and obesity in US counties, 2001-2011: a road map for action. Population health metrics 11(1): 1-11.
- Ogden CL, Carroll MD, Kit BK, Flegal KM (2013) Prevalence of obesity among adults: United States 2011-2012. NCHS data brief 131: 1-8.
- Kostić R, Uzunović S, Pantelić S, Đurašković R (2011) A comparative analysis of the indicators of the functional fitness of the elderly. Facta universitatis-series: physical education and sport 9(2): 161-171.
- Ogden CL, Carroll MD, Kit BK, Flegal KM (2012) Prevalence of obesity and trends in body mass index among US children and adolescents, 1999-2010. Jama 307(5): 483-490.
- Uysal H, Alkan HÖ, Nuray E, Yigit Z (2020) Assessment of Dietary Habits in Patients with Chronic Heart Failure. Journal of Nursing Research 28(1): 1-10.
- O Connor JM, Sedghi T, Dhodapkar M, Kane MJ, Gross CP (2018) Factors associated with cancer disparities among low-, medium-, and high-income US counties. JAMA network open1(6): 1-12.
- Curry SJ, Krist AH, Owens DK, Barry MJ, Caughey AB, et al. (2018) Behavioural weight loss interventions to prevent obesity-related morbidity and mortality in adults: US Preventive Services Task Force recommendation statement. Jama 320(11): 1163-1171.
- Costa RM, Neves KB, Tostes RC, Lobato NS (2018) Perivascular adipose tissue as a relevant fat depot for cardiovascular risk in obesity. Frontiers in physiology 9(253): 1-17.
- Rahman SA, Adjeroh D (2015) Surface-based body shape index and its relationship with all-cause mortality. PLoS one 10(12): 1-21.
- Chaput JP, Pérusse L, Després JP, Tremblay A, Bouchard C (2014) Findings from the Quebec family study on the etiology of obesity: genetics and environmental highlights. Current obesity reports 3(1): 54-66.
- Alsharari ZD, Risérus U, Leander K, Sjögren P, Carlsson AC, et al. (2017) Serum fatty acids, desaturase activities and abdominal obesity-a population-based study of 60-year-old men and women. PLoS One 12(1): 1-15.
- Sugawara N, Yasui Furukori N, Tsuchimine S, Fujii A, Sato Y, et al. (2012) Body composition in patients with schizophrenia: Comparison with healthy controls. Annals of general psychiatry 11(1): 1-5.
- Chao H, Luximon A, Yeung KW (2015) Functional 3D human model design: a pilot study based on surface anthropometry and infrared thermography. Computer-Aided Design and Applications 12(4): 475-484.
- Barnes R (2014) Body shape and weight distribution: the Body Volume Index (BVI) and the Body Mass Index (BMI). Designing Apparel for Consumers Pp: 58-77.
- Saka M, Türker P, Ercan A, Kızıltan G, Baş M (2014) Is neck circumference measurement an indicator for abdominal obesity? A pilot study on Turkish Adults. African health sciences 14(3): 570-575.
- Flegal KM, Kit BK, Orpana H, Graubard BI (2013) Association of all-cause mortality with overweight and obesity using standard body mass index categories: a systematic review and meta-analysis. Jama 309(1): 71-82.
- Heo M, Faith MS, Pietrobelli A, Heymsfield SB (2012) Percentage of body fat cutoffs by sex, age, and race-ethnicity in the US adult population from NHANES 1999-2004. The American journal of clinical nutrition 95(3): 594-602.
- Murphy RA, Schairer C, Gierach GL, Byrne C, Sherman ME, et al. (2013) Beyond breast cancer: mammographic features and mortality risk in a population of healthy women. PLoS One 8(10): 1-8.
- Lee KK, Raja EA, Lee AJ, Bhattacharya S, Norman JE, et al. (2015) Maternal obesity during pregnancy associates with premature mortality and major cardiovascular events in later life. Hypertension 66(5): 938-944.
- Di Renzo L, Marsella LT, Sarlo F, Soldati L, Gratteri S, et al. (2014) C677T gene polymorphism of MTHFR and metabolic syndrome: response to dietary intervention. Journal of translational medicine 12(1): 1-9.
- Nazare JA, Smith J, Borel AL, Aschner P, Barter P, et al. (2015) Usefulness of measuring both body mass index and waist circumference for the estimation of visceral adiposity and related cardiometabolic risk profile (from the INSPIRE ME IAA study). The American journal of cardiology 115(3): 307-315.
- Richard A, Martin B, Wanner M, Eichholzer M, Rohrmann S (2015) Effects of leisure-time and occupational physical activity on total mortality risk in NHANES III according to sex, ethnicity, central obesity, and age. Journal of Physical Activity and Health 12(2): 184-192.
- Han TS, Lee DM, Lean ME, Finn JD, O Neill TW, et al. (2015) Associations of obesity with socioeconomic and lifestyle factors in middle-aged and elderly men: European Male Aging Study (EMAS). European Journal of Endocrinology 172(1): 59-67.
- Sun GZ, Li Z, Guo L, Zhou Y, Yang HM, et al. (2014) High prevalence of dyslipidemia and associated risk factors among rural Chinese adults. Lipids in health and disease 13(1): 1-11.
- Mørkedal B, Romundstad PR, Vatten LJ (2011) Informativeness of indices of blood pressure, obesity and serum lipids in relation to ischaemic heart disease mortality: the HUNT-II studies. European journal of epidemiology 26(6): 457-461.
- Schneider HJ, Wallaschofski H, Völzke H, Markus MRP, Doerr M, et al. (2012) Incremental effects of endocrine and metabolic biomarkers and abdominal obesity on cardiovascular mortality prediction. PLoS One 7(3): 1-7.
- Jayedi A, Soltani S, Zargar MS, Khan TA, Shab Bidar S (2020) Central fatness and risk of all-cause mortality: systematic review and dose-response meta-analysis of 72 prospective cohort studies. Bmj 370: 1-22.
- He S, Zheng Y, Shu Y, He J, Wang Y, et al. (2013) Hypertriglyceridemic waist might be an alternative to metabolic syndrome for predicting future diabetes mellitus. PLoS One 8(9): 1-6.
- Zhang Zq, Deng J, He Lp, Ling Wh, Su Yx, et al. (2013) Comparison of various anthropometric and body fat indices in identifying cardiometabolic disturbances in Chinese men and women. PLoS One 8(8): 1-7.
- Naeem N, Naeem B Challenges and opportunities of integration of community-based Nutrition services in Punjab, Pakistan.
- Hussain WG, Shehzad F, Ahmad R, Akbar A (2021) Establishing growth charts for proposed body shape and size index of the Pakistani population, using quantile regression approach. SAGE Open Medicine 9: 1-12.
- Hussain WG, Shehzad F, Akbar A (2024) Examining the Relationship Between Obesity and Income Distribution Using Body Mass Index (BMI) and Body Shape and Size Index (BSSI): A Case Study of Pakistan. Gerontology and Geriatric Medicine 10: 1-9.
- Hussain WG, Shehzad F, Akbar A (2024) Comparison of Quantile Regression and Gaussian (Z-scores) Percentiles to BSA in Growth Charts with a Pakistani Population. Gerontology and Geriatric Medicine 10: 1-6.
- Haque MN, Hasan MM, Rahman A (2019) Identifying factors in estimation of Body Mass Index: cohesion between environmental factors and physical activity. International Journal of Public Health Science 8(3): 352-358.
- Vandevijvere S, Jaacks LM, Monteiro CA, Moubarac JC, Girling Butcher M, et al. (2019) Global trends in ultraprocessed food and drink product sales and their association with adult body mass index trajectories. Obesity Reviews 20: 10-19.
- Brooks KM (2014) Unpacking pieces of a puzzle: Understanding obesity-related health risk through lifestyle behaviours and well-being Pp: 1-151.
- Hsia DS, Larrivee S, Cefalu WT, Johnson WD (2015) Impact of lowering BMI cut points as recommended in the revised American Diabetes Association's Standards of Medical Care in Diabetes-2015 on diabetes screening in Asian Americans. Diabetes care 38(11): 2166-2168.
- Abirami P, Selvi S, Jayabharathi B, Kanniammal C (2019) Assessment of Anthropometric Measures and Prediction of Obesity among Selected Nursing College Students. International Journal of Nursing Education 11(4): 9-13.
- Daniell N, Olds T, Tomkinson G (2012) Criterion validity of whole-body surface area equations: A comparison using 3D laser scanning. American Journal of Physical Anthropology 148(1): 148-155.
- Jayawardena R, Ranasinghe P, Ranathunga T, Mathangasinghe Y, Wasalathanththri S, et al. (2020) Novel anthropometric parameters to define obesity and obesity-related disease in adults: a systematic review. Nutrition Reviews 78(6): 498-513.
- Vasan SK, Osmond C, Canoy D, Christodoulides C, Neville MJ, et al. (2018) Comparison of regional fat measurements by dual-energy X-ray absorptiometry and conventional anthropometry and their association with markers of diabetes and cardiovascular disease risk. International Journal of Obesity 42(4): 850-857.
- Chen Y, Liang X, Zheng S, Wang Y, Lu W (2018) Association of body fat mass and fat distribution with the incidence of hypertension in a population‐based Chinese cohort: a 22‐year follow‐ Journal of the American Heart Association 7(6): 1-9.
- Umer A, Kelley GA, Cottrell LE, Giacobbi P, Innes KE, et al. (2017) Childhood obesity and adult cardiovascular disease risk factors: a systematic review with meta-analysis. BMC public health 17: 1-24.
- Jiang M, Zou Y, Xin Q, Cai Y, Wang Y, et al. (2019) Dose-response relationship between body mass index and risks of all-cause mortality and disability among the elderly: a systematic review and meta-analysis. Clinical nutrition 38(4): 1511-1523.
- Batsis JA, Gill LE, Masutani RK, Adachi Mejia AM, Blunt HB, et al. (2017) Weight loss interventions in older adults with obesity: a systematic review of randomized controlled trials since 2005. Journal of the American Geriatrics Society 65(2): 257-268.
- Yalcin G, Ozsoy E, Karabag T (2020) The relationship of body composition indices with the significance, extension and severity of coronary artery disease. Nutrition, Metabolism and Cardiovascular Diseases 30(12): 2279-2285.
- Lee JE, Pope Z, Gao Z (2018) The role of youth sports in promoting children's physical activity and preventing pediatric obesity: a systematic review. Behavioural Medicine 44(1): 62-76.
- Kharuddin F, Azid N, Mustafa Z, Kamari N, Ibrahim K, et al. (2020) Determination of sample size in early childcare Centre (TASKA) service project in Malaysia: Classification and Analytical Approach. Albukhary Social Business Journal 1(2): 104-112.
- Amirrudin M, Nasution K, Supahar S (2021) Effect of variability on Cronbach alpha reliability in research practice. Journal Matematika Statistika dan Komputasi 17(2): 223-230.
- Li Y, Vasconcelos N (2019) Repair: Removing representation bias by dataset resampling. Proceedings of the IEEE/CVF conference on computer vision and pattern recognition.
- Xiong W, Zeng Z, Li X, Zeng G, Xiao R, et al. (2018) multi-walled carbon nanotube/amino-functionalized MIL-53 (Fe) composites: remarkable adsorptive removal of antibiotics from aqueous solutions. Chemosphere 210: 1061-1069.
- Rubio FJ, Rachet B, Giorgi R, Maringe C, Belot A (2021) On models for the estimation of the excess mortality hazard in case of insufficiently stratified life tables. Biostatistics 22(1): 51-67.
- Kuitunen I, Ponkilainen VT, Uimonen MM, Eskelinen A, Reito A (2021) Testing the proportional hazards assumption in cox regression and dealing with possible non-proportionality in total joint arthroplasty research: methodological perspectives and review. BMC Musculoskeletal Disorders 22(489): 1-7.
- Hazra A, Gogtay N (2017) Biostatistics series module 9: survival analysis. Indian journal of dermatology 62(3): 251-257.
- Li WC, Chen IC, Chang YC, Loke SS, Wang SH, et al. (2013) Waist-to-height ratio, waist circumference, and body mass index as indices of cardiometabolic risk among 36,642 Taiwanese adults. European journal of nutrition 52(1): 57-65.
- Park YS, Kim JS (2012) Association between waist-to-height ratio and metabolic risk factors in Korean adults with normal body mass index and waist circumference. The Tohoku journal of experimental medicine 228(1): 1-8.
- Ashwell M, Gunn P, Gibson S (2012) Waist‐to‐height ratio is a better screening tool than waist circumference and BMI for adult cardiometabolic risk factors: systematic review and meta‐ Obesity Reviews 13(3): 275-286.
- Soriano JM, González A, Soler C, Catalá Gregori AI, Merino Torres JF (2020) Body Mass Index (BMI) and Coronavirus Disease 2019 (COVID-19): A Living Systematic Review Pp: 1-16.
- Kachur S, Morera R, De Schutter A, Lavie CJ (2018) Cardiovascular risk in patients with prehypertension and the metabolic syndrome. Current Hypertension Reports 20(2): 1-15.


