A Comparative Evaluation of Quantile Regression Percentiles, Gaussian Percentiles, and Raw Percentiles to Body Shape and Size Index (BSSI) in Growth Charts: A Case Study of Pakistan
Farrukh Shehzad1, Waqas Ghulam Hussain2* and Atif Akbar3
1Department of Statistics, The Islamia University of Bahawalpur, Pakistan
2Department of Statistics, The Islamia University of Bahawalpur, Pakistan
3Department of Statistics, Bahauddin Zakariya University, Multan, Pakistan
Submission:October 24, 2024;Published:November 11, 2024
*Corresponding author:Waqas Ghulam Hussain, Department of Statistics, The Islamia University of Bahawalpur, Bahawalpur, Pakistan. Email: profwaqas7@gmail.com
How to cite this article: Farrukh S, Waqas Ghulam H, Atif A. A Comparative Evaluation of Quantile Regression Percentiles, Gaussian Percentiles, and Raw Percentiles to Body Shape and Size Index (BSSI) in Growth Charts: A Case Study of Pakistan. Open Access J Surg. 2024; 16(2): 555932.DOI: 10.19080/OAJS.2024.16.555932.
Abstract
Constructing growth charts is essential in defining normal growth standards and detecting possible trends in human growth. In the present study, using the data from 9906 adults from Multan and Bahawalpur, Pakistan, we have provided growth charts for BSSI using QR and compared them with Gaussian percentiles (Z-scores) and raw percentiles against age. The purpose of the study is to determine the performance of these methods for constructing growth charts of BSSI in a Pakistani population. The study’s outcome also showed that the mean BSSI was equal to 0.2146±0.1106 (standard deviation). The QR percentiles showed a declining pattern in the age range of 5 to 25 for the 85th to 95th percentiles, sharp rises in the ages of 25 to 40, and then declining up to the age of 55. This phenomenon implies that BSSI rises in the first phase of the life cycle, namely early adulthood, and then stabilizes in middle age before declining in old age.
The Gaussian percentiles presented a moderate rise from the age level of 5 years and attained a stable position at the level of 15 years. This means that Gaussian percentiles may not well describe the oscillation of BSSI with time especially in early adulthood. The raw percentiles revealed some different trends, which were a progressive increase between 2-29 years, a steep rise between 29-54 years, and then a decline until 60 years. This implies that raw percentiles are more likely to reflect the changes in BSSI during young adulthood and early middle age. The finding of the present study has important consequences for constructing growth percentile curves for different physiological and pathological states. Therefore, empirical BSSI QR percentiles, raw percentiles, and Z-scores can be used as discrete estimates of population QR percentiles, raw percentiles, and Z-scores respectively. By using the QR, raw percentiles, and Z-score approach, it is possible to obtain more accurate and smoother continuous BSSI QR percentile, raw percentiles, and Z-score curves against given ages. This methodology can be used to build growth reference curves for most of the physiological and medical conditions that affect children and adolescents. This will help practitioners to have an understanding of normal growth and to define the variations from the normal growth pattern.
Keywords:Obesity; Body shape and size index; Quantile Regression Percentiles; Gaussian Percentiles; Raw percentiles; Growth Charts
Abbreviations:BSSI: Body Shape and Size Index; BMI: Body Mass Index; BSA: Body Surface Area; QR: Quantile Regression; ABSI: A Body Shape Index; HT: Height; WT: Weight; SBSA: Surface-Based Body Shape Index; WHO: World Health Organization; CDC: Centers for Disease Control; MSE: Mean Squared Error; SPSS: Statistical Package for Social Sciences
Introduction
Background
In the context of medical sciences, the Body Mass Index (BMI) is a standard measurement of body composition and health risks. But when it comes to BMI, a person may fall within a particular range, but his or her body will look different from the others in the same range. This shows that it is not enough to only look at BMI, other indices should be considered as well. Regarding this, body weight is a significant factor where one’s health risk is threatened most when one gains the upper body weight rather than the lower part of the body. Such distribution of fats is considered to cause increased risks of chronic diseases. A Body Shape Index (ABSI) is also another useful index for measuring body shape and it is usually used alongside the BMI to produce a broader picture of body growth. Further, the Body Surface Area (BSA) uses weight plus height parameters and is capable of outlining the body size and overall health status. On top of that, we used a novel approach that integrates BSA and BMI into one measure for assessing body size and shape, called the Body Shape and Size Index (BSSI) [1]. The following (Figure 1) shows the combined index’s theoretical model:
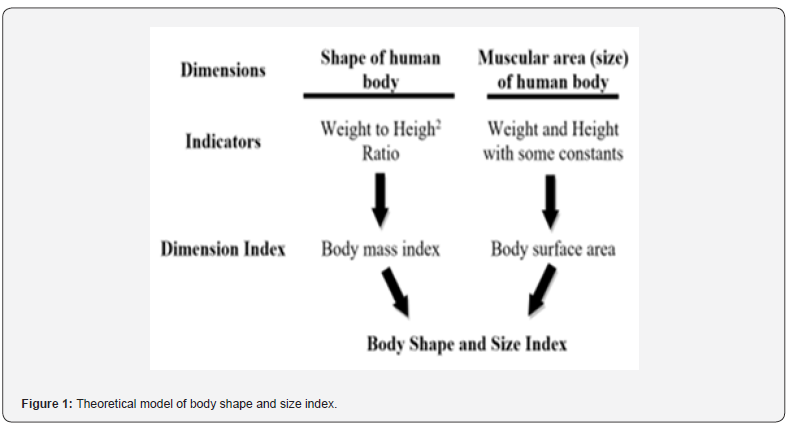
The newly developed Body Shape and Size Index (BSSI) has the role of quantifying the size and shape of the human body [1]. This anthropometric index is a combination of four dimensions namely height (HT), weight (WT), body surface area (BSA), and the body mass index (BMI). Therefore, BSSI provides a comparatively better assessment of body shape and size regarding weight than BMI which is calculated with weight and height only.
The procedure to develop BSSI employs a particular style that was followed to develop the Obesity-Related Surface-Based Body Shape Index (SBSI) as mentioned by [2]. The same procedure is done here while obtaining the BSSI using four particular anthropometric dimensions. To infer the relationship between these variables a linear regression model is used utilized to compare BMI with BSA, as well as WT with HT. In this aspect, BSSI plays a role in assisting healthcare practitioners and researchers on how the several variables connected to anthropometrics are most likely to impact the health of man. By integrating several indicators, BSSI could be used in identifying those people with metabolic disorders and obesity-related illnesses that may serve to inform the strategies of preventive and curative measures. Consider the following linear connection between weight (WT) and height (HT), and BMI and BSA using a linear regression model: When using all of the data, the predicted model is
This demonstrates a negative correlation between height and
weight and BSA and BMI, respectively. The following connection
may be deduced from the equation above:
We may define BSSI as follows by taking ratio:
A detailed discussion is provided to assess the consequences of the most recently developed Body Shape and Size Index (BSSI), which is a mathematical formula used to express the shapes and sizes of human bodies. In medicine, physicians like paediatricians use growth charts to follow patients’ progress as they compare their growth rates with the ideal growth rates [3]. To develop these growth charts, BSSI percentiles are needed. Specifically, grouping age allows for obtaining the empirical percentiles of BSSI, which in turn, can be used for estimating the population percentiles with a given precision. This way, it is more reasonable to use regression analysis to study the impact of various factors on human body shape [4]. Regarding specific methodologies, quantile regression [5] is used for the construction of growth charts, including BSSI [1], to examine body shape and size at various age points and BMI levels.
Being overweight is no longer an exception for many people, as it refers to the state when the body weight is much higher than the recommended one [6]. The substance is regarded as a ‘global epidemic’ by the World Health Organization since it is linked to physical and psychological health consequences [7]. Using the latest statistics, it is possible to state that more than 1 billion people worldwide are overweight, and 320 million are obese, and approximately 2 million people dying every year due to obesity. Five million annual mortalities are due to obesity, a figure that is likely to double by 2030 [8-10]. In pediatric care, the two most frequently used methods are percentile ranks and Z-scores for the evaluation of nutrition and growth. They include Z-score or percentile cut-points for sex-age-specific measures that are depicted in tables and as curves on growth charts [11]. Raw percentiles are the statistical techniques that are used to describe a value in terms of its relation to the total population or the total sample of data. In different studies like height, weight, and BMI, raw percentiles are employed in the assessment of the anthropometric data of people with that of the mentioned population [12, 13].
Growth charts show the raw percentiles of the anthropometric measurements over time [14]. These charts provide a method to track the growth line and compare it to the standard patterns of the given person’s development to reveal deviations. Age-based growth charts show the growth of an individual in terms of centile at a particular age, height-for-age growth charts on the other hand show the height of an individual at a particular age with centile against age [15]. WHO and CDC have offered growth charts for child growth and development to be used in the identification of underweight, overweight, and obese children [12]. Hese charts can be used in identifying instances of early growth, observing the development of a child, evaluating whether a child has any developmental problems that may be a result of growth, and offering proper attention to a child with certain health challenges. These growth charts can also be used by clinicians to diagnose early signs of growth and development anomalies, or poor nutrition and feed intake [16-18].
Other than practice in pediatrics, the BSSI growth charts can be applied in other sub-specialties including public health, research, and investigations. Thus, being the unified tool for the assessment of anthropometric development, these charts may be employed as the basis of the policy to reduce the rate of obesity and other related issues. The method applied in the construction of BSSI growth charts is quantile regression which is effective in monitoring changes in anthropometric development. These charts can also help clinicians to observe the progress of an individual regarding the age standards or height for age standards and help the practitioners to carry out evidence-based interventions that may enhance the development of humans.
Objective of study
The objective of this research work is to provide the comparison of both estimated quantiles of BSSI through quantile regression with the result of raw percentiles’ quantiles and BSSI of z-scores to examine the BSSI gap for the adult population in Pakistan. Such work has been done in previous studies, but we have done it for BSSI instead of BMI.
Methodology
Study design and sampling technique
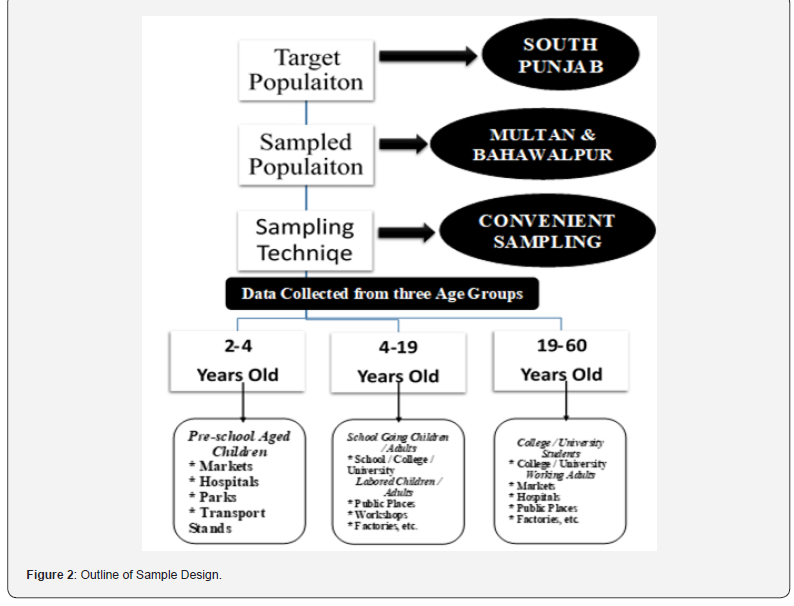
This research utilized a cross-sectional research design to sample 9906 participants from the age range 2-60 years old from different public places in Pakistan. The sampling procedure that was adopted for the study was convenience sampling where participants were recruited from the markets, hospitals, parks, and transport hubs [19]. In the study, data collection among preschool children of age 0-3 years is done through easy sampling while among school-going children aged 4-19 years’ data collection was done using convenient and labor-based sampling. Both public and private schools were chosen, and consent was sought from the respective school authorities to carry out the data collection.
Convenience sampling was used in the study with adults
between the age of 20-60 years who were sampled from
public places. A team of two enumerators, one male and one
female, was employed to visit homes and collect data using
standardized questions [20]. Gender differentiation was a
significant contributing aspect of the study. As a result, different
questionnaires were created for respondents who identified as
male and female. The sample design plan is shown in the following
(Figure 2) from a broad perspective:
The collected data provides insightful details on the
population’s socioeconomic, health, and demographic factors.
Setting and participants
The study’s target population consisted of people who were at least two years old. Pregnant women weren’t included in the study [21]. The sample included both males and females and a major emphasis was made in an attempt to gather information from the Multan and Bahawalpur regions of Pakistan.
Study variables
The study sought to establish numerous variables with the view of fulfilling the stated objectives of the research. The main dependent variable was Body Shape and Size Index (BSSI) which is an anthropometric measure. Exploratory variables involved age with six powers as used by Chen and co-authors in their study [22], and categorical variables involved gender, marital status, monthly income, residential area, and diabetic status [23]. These variables included both the numerical and non-numerical data derived from a wide group of participants.
Data collection
There were two groups of three individuals and each group collected the data with the help of local pediatricians and dietitians. The study was done as a six-month project, with the research being conducted from March to August 2022. Primary data was collected through a self-administered questionnaire and the questionnaire was tailored in two parts. The first section collected basic biographic data like gender and age (rounded at the nearest year) from school enrolment records or parental permission for children below five years old. The second section provided information on the anthropometric measurements that were taken.
Patient and public involvement
Despite the best efforts of the research team, several challenges arose when conducting the study and collecting the data as analysed below. The data was collected objectively by measuring the participant’s weight and height through self-completion.
Reliability of data
Regarding internal consistency, the reliability of the collected data was determined by Cronbach’s Alpha, which had a value of 0.89 that was found within the normal range of 0.70-0.90 [24]. This means that the collected data is correct and valid for statistical analysis since it conforms with the hypothesized distribution.
Bias
During the data editing and data cleaning process, the observations that did not fit the nature of the research question or were considered outliers were not included to minimize the bias [25]. It was necessary to ensure that the collected data was correct and did not contain any errors to identify the findings of the study as true.
Ethical consideration
This study was conducted according to the guidelines laid down in the Declaration of Helsinki and all procedures involving human subjects were approved by the Ethics Committee of Department of Statistics, The Islamia University of Bahawalpur, Punjab, Pakistan.
Informed consent
Written informed consent was obtained from all respondents.
Study size
In our investigation, we calculate the sample size using the
following formula [26]:
Where:
n is the Sample Size
N is the size of the population
e = Precision Level
Now,
N= 1872000 e= 0.01
n= 9906
Consequently, 9906 children and adults are taken out of two Pakistani cities (Multan and Bahawalpur).
Statistical methods
The following is the BSSI formula:
Gaussian percentiles
This study applied several statistical procedures to analyze the Body Shape and Size Index (BSSI) data. In the case that assumed normal distribution, Gaussian percentiles also known as normal score (z-score) percentiles were estimated [27]. The above method provides a better estimate of the percentile values of normally distributed data because it considers the normal distribution of the data [28]. The z-score expression is provided as follows:
One important statistical method we used in our research was
the z-score. Finding the matching regression coefficients for BSSI
is the first step towards calculating an individual’s BSSI z-scores,
which areβ_0, β_1, β_2, β_3, β_4, β_5 and β_6, and MSE, and obtain
the mean as:
Mean
Next, normalize the observed BSSI’s natural log by applying
the given below formula [29]:
Raw percentiles
Raw percentiles are fundamental percentile indices that are calculated from the data collected for the given study without making any transformations in the data [30]. This is done to segment the dataset into different sections where each section contains a fixed number of data samples. The traditional way of doing this is to divide the data into a hundred parts where each part is a one percent representation of the data [31].
For the calculation of raw percentile, the data set was arranged in ascending order and the percentage of the data point of interest was established this would be the anti-observation number for instance 25, 50,75, and so on. We then summed up the numerical values of the aspects that were rated at that percentage (for example, a 25% rating means that there were 25 aspects in that category). The raw percentile was then computed from the value that is on the position of the percentile in the arranged data.
Quantile regression model and its percentiles
This research applied a complex statistical tool called quantile regression (QR) that is appropriate for use where the distribution is not normal. QR also provides an estimate of the density of the response variable if the covariate has been considered. It is most appropriate to use when working with non-normal distributions since it can handle extreme values and outliers with ease. QR gives more information about the spread of the response variable as well as its center [32-34]. It has several advantages over the conventional regression techniques that have been used in the past as follows: There is no need to estimate distributional shapes, and the existence of outliers will not affect the performance of the method. As discussed earlier in this study, the comparison between the models showed that QR is a better fit in describing the relationship between BSSI and covariates [1]. Age may be incorporated into the QR model, and its six powers allowed us to consider age-related variations in BSSI [1]. Let’s examine a realvalued random variable with the following distribution function, keeping in mind the ordinary quantile:
subsequently, the inverse function of the distribution function mentioned above is the 𝜏−𝑡ℏ quantile of the real valued random variable Y as given below:
where the 𝜏 is between 0 and 1. To be more precise, the median is 𝑄 (1/2). The estimated τ-th sample quantile is ξ(τ), which is an analogue of Q(τ), may be formulated as the solution of the optimization problem
Where:
is usually called the check function.
According to the linear quantile model, the response variable is expressed in terms of covariates through a linear equation [35]. This model was employed in our study to analyse the Body Shape and Size Index (BSSI). Especially, the median regression approach was used where an idea is to find the scenario ξ(τ) = 0.5 that results in the smallest sum of the absolute residuals [36]. To develop BSSI growth charts we fitted a quantile regression (QR) model with the natural logarithm of BSSI (log BSSI) as the outcome variable. It has been proved in the research that six powers of age are involved as covariates for this method [37]. The values of τ were chosen according to the following scheme: τ = 0.05 to 0.95, to obtain BSSI values at the 5th, 10th, 25th, 50th (mid-point), 75th, 85th, 90th, and 95th percentiles [38]. The analysis of the theoretical model was performed with the help of the E-VIEWS 7.0 software.
The BSSI growth charts could then be produced where the calculated percentiles were plotted against the age of the respondents. This approach assisted in displaying the distribution of BSSI values by age, and also in the analysis of growth patterns due to the graphical representation. Regarding the curvature of the growth curves, six powers of ‘age’ were added as covariates in the model [3]. Growth charts are used in the medical field where the growth of the patients is monitored and during this process, the doctors may observe some features of abnormal growth [14]. From the current study, the BSSI growth charts developed are applicable for documenting the changes in body size and shape in healthcare settings. From the percentiles of the BSSI values at the different ages, the clinician will be in a position to diagnose a problem that is causing a deviation from normal growth patterns at a very early age.
QR assisted in checking the non-normality of the data and provided a wider view of the growth of BSSI. As the dependent variable, we specified the natural logarithm of BSSI for which the six powers of age were used as covariates enabling us to explore the associations between the two variables adequately. The outcome of the study is consequent growth charts for various age groups and body sizes, which are helpful for physicians and other healthcare practitioners.
Results
Participants
In our study sample, we have 9906 individuals, comprising both men and women. The breakdown is as follows: 5524 of them are men, which constitutes 55.5% of the total and 4382 of them are women, which constitutes 44.5% of the total. This means that nearly 55 out of every 100 individuals in our dataset are men, while almost 45 out of every 100 individuals are women. This gender distribution is fairly even, with men being slightly more numerous than women in the study sample. However, it is crucial to acknowledge that gender distribution might affect the outcomes of the study and the conclusions that are made based on it. For example, there exist variations in body size and mass between male and female individuals, which may influence the reliability and generalizability of our study. We also need to acknowledge the fact that due to the small sample size; the percentage of female participants represents much less than the male ones, and therefore, the results cannot be generalized to females to a large extent. Hence, future studies may have to involve more participants especially women so that the samples are more representative. However, the current database can be useful as the basic material for the description of interactions between age, shape, and size among the people of this population.
Descriptive analysis
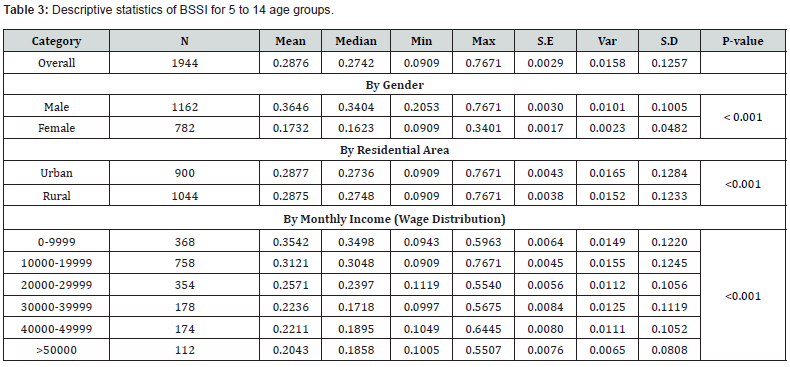
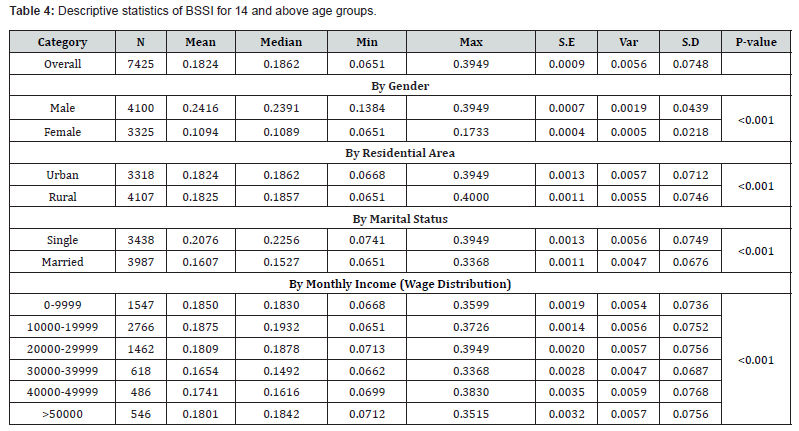
Descriptive analysis was used to explore the BSSI across the different subgroups. Analysis of the study found a difference in the BSSI about age, gender, marital status, area of residence, and monthly family income. The t-test result showed that there was a significant difference between boys and girls (p=0.0000), which means that gender is a very important factor influencing BSSI in this study. This indicates that boys and girls cannot develop body shape and size in the same way and at the same rate. Comparing BSSI between individuals from urban and rural areas, the study identified individuals from rural areas as having a lower BSSI (p-value=0.0000) than individuals from urban areas, thus underscoring the need to consider the residential area factor while evaluating BSSI. The difference in the two rates must be due to various factors that include but are not limited to lifestyle, diet, and environment between the urban and the rural areas. Another factor that was found to be a significant covariate of BSSI was Marital status with a p-value equal to 0.0000, indicating that single people have different BSSI trends compared to married people.
The absence of the above variables in the explained variation suggests that the effects of marital status on body shape and size should be considered. The findings revealed that BSSI was higher among the respondents with lower monthly household income which supports the hypothesis that BSSI is an important determinant of body shape and size. These findings may be considered valuable for practicing clinicians and investigators who would like to explore the relationships between demographic characteristics and body composition variables. What emerges from our analysis is the importance of adopting a disaggregated approach to the analysis of BSSI by gender, age, and other demographic characteristics. Thus, by considering these factors, there is a possibility of coming up with a better estimation of body shape and size which will be of great help in providing the right advice and treatment for the health of any individual (Table 1).
The descriptive analysis of the Body Shape and Size Index (BSSI) was shown only for the children that were 2-5 years old, and it included the comparison of gender and the residential area. The result showed there is a significant difference between boys and girls in BSSI (p-value=0.0000) which supported the view that gender should be taken into consideration when assessing body composition in early childhood and later years. Such differences may be attributed to hormonal imbalances, developmental profiles, and lifestyles that are embraced by the two sexes. Another important predictor factor that was also defined is the residential area (p-value= 0.0000). The mean BSSI of the urban people and the mean BSSI of the rural people were significantly different. Patients residing in urban settings display higher levels of urbanization, making them undergo several changes in the types of nutrients they take, and the surrounding environment compared to those in rural settings. On the other hand, people living in rural areas may be subjected to other conditions that define the given body size and shape. Based on the findings presented in this paper, there is support for considering demographic variables such as gender and the area of residence in the assessment of BSSI. Providers can refer to focused treatment programs and generate more reliable Body Composition evaluations by taking these variables into account (Table 2).
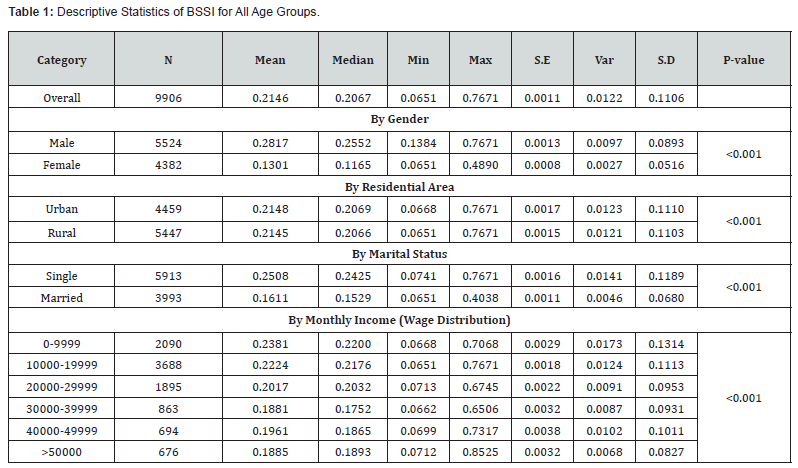

This study sought to investigate the Body Shape and Size Index (BSSI) on children and adolescents aged between 5 and 14 years depending on demographic factors of gender, residential area, and monthly family income level. The findings also highlighted that the mean BSSI scores were higher in males than females and that the difference was statistically significant at p-value =0.0000. Thus, the hypothesis that gender has a strong influence on body composition in children and adolescents was supported. Another factor that was established was residential area associated with BSSI (p-value = 0. 0000) whereby the body size and shape of the residents of urban and rural areas differ. This could be attributed to the disparities in lifestyles, diets, and probable contact with risky factors in the urban regions in contrast to the rural regions. This result was also supported by the differences in the distribution of participants across different levels of family monthly income; BSSI was also raised (p = 0.0000), which indicates the effects of SES on body composition. SES plays a role in the health, obesity status, food quality, and all the other related factors of those in the low-income levels. Based on the outcomes of the analysis, it is critical to consider several demographic factors of a person in terms of BSSI, age, gender, type of field, and area of residence as well as the monthly income level of their families. Hence, with the consideration of these variables, healthcare providers can devise more precise estimates of body composition and design relevant treatment plans (Table 3).
Self-reported BSSI was assessed in a population of 1834 subjects aged 14 years and above and the study also considered age, gender, marital status, residential status, and monthly income. The findings also demonstrated that there was a highly significant variation in BSSI with both males and females (p-value=0.0000) implying gender is a very important factor in determinants of body mass and composition during and after adolescence. Another demographic characteristic that was significantly related to BSSI included marital status with the results showing that married people had different body shape and size distribution from the unmarried ones (p-value=0.0000). Such a situation may be due to the differences in the daily living and dietary practices of married people as opposed to those who are single, and various socioeconomic factors. Another important factor that was identified, was the one related to the place of residence, which was also confirmed as a statistically significant predictor of BSSI (p-value=0.0000); the people of urban and rural areas had different characteristics of body shape and size.
People in urban areas can have higher degrees of urbanization in their everyday lives, which might make changes in their lifestyles, diets, and environment affecting their anthropometric measurements. The study also revealed that there is a relationship between BSSI and monthly income (p-value=0.0000), as well as between BSSI and other dimensions of Socio-economic status (SES). Some people especially those with low economic status may not get a proper diet, inadequate access to health care, or other aspects that affect their weight. As highlighted in the results, gender, marital status, residential area, and monthly income are the viable factors that must be taken into consideration about BSSI. When considering these factors, it is possible for healthcare providers to provide more accurate body composition evaluations and to create a more effective plan of action (Table 4).
Inferential analysis Quantile regression percentiles and growth charts of BSSI
A Quantile Regression (QR) analysis was conducted to examine the effect of BSSI on the selected demographic characteristics. To investigate the impact of age on BSSI, the QR approach was used to estimate the effects of age at various quantiles, including the 50th percentile (Median percentile). The empirical analysis was conducted using E-VIEWS 7 software. The results are as follows:
qr analysis of bssi for complete data
The results of the QR estimates suggested that there is a relationship between BSSI scores and age. The median BSSI score was 0.1668. The regression results revealed that age squared and the cube of age were the significant predictors of BSSI, in which the coefficient estimate had a positive value and the latter had a negative value. The analysis of the coefficients, standard errors, t-values, and p-values of the model is provided in (Table 5).

We found statistically significant values for all our variables with p<0. 05 level of significance.
Growth chart: Analysing the BSSI and using the QR technique with six powers of age in the charting process offers useful information about the change in BSSI for various ages. It is found in (Figure 3) below, the BSSI growth charts for eight percentiles, namely the fifth, tenth, twenty-fifth, fiftieth (Median), seventyfifth, eightieth, ninetieth, and ninety-fifth. The growth chart reveals that BSSI has a steep falling trend from the 5-25 years of age for the 85th-95th percentiles and has a steep rising trend in the 25-40 years and then it again falls steeply in the 40-55 years of age. Further, BSSI increases at a very fast pace between 2-4 years of age for all the quantiles and is followed by a decreasing trend up to 25 years of age.
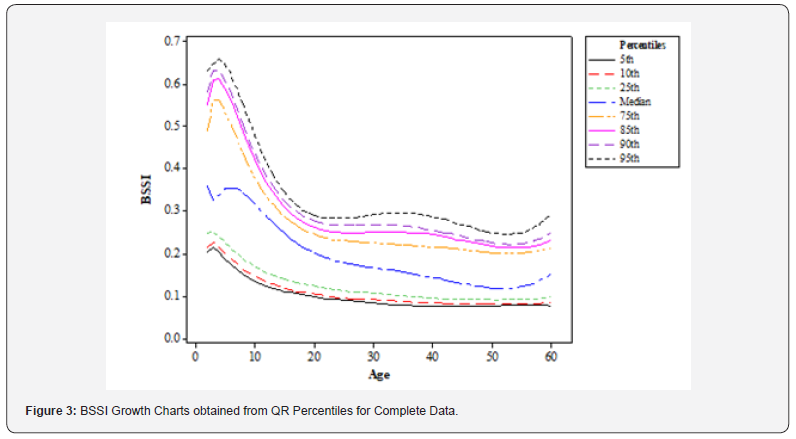
These growth curves show that BSSI is non-linear across different ages thus presenting the non-linear pattern. From the curves, it can be observed that there are specific periods of increase and decrease in BSSI over the human life span. For instance, early childhood particularly at age 2-4 years has a high BSSI and is followed by an increasing stage during adolescence with age 5-25 years. They also reveal a slight increase in BSSI in middle adulthood which is aged between 25 and 40 years then a decrease in the later adulthood which is above 55 years of age.
These implications are specifically for healthcare professionals and researchers alike as they work to provide better care for patients and advance knowledge in this field. The growth charts can thus be applied as a diagnostic aid for comparing the BSSI of a particular client with that of a specific age and sex. Further, the results obtained through the QR estimates can be utilized for creating individual-level models of BSSI forecast that account for the demographic characteristics of the person. The results of this study add a significant knowledge of the relationship between BSSI and age and underline the importance of further investigation and appreciation of the fact that people’s body composition does not increase and decrease steadily and linearly over their lifetime.
Qr analysis of BSSI for gender
This section describes and discusses the findings captured from the Body Shape and Size Index (BSSI) on age in males and females. To determine the significance of age on BSSI, the Quantile Regression (QR) method was used in determining the data at the Median Percentile. The outcomes are listed below:
Male data: The QR estimates for male data further reflected the presence of SES interaction with age, with the median BSSI at 0. 2757. It was also revealed that the first and third powers of age had a direct positive effect on BSSI, whereas the second, fourth, fifth, and sixth powers of age resulted in a negative effect. The p-values of all the variables analysed were found to be significant at 0.05 level of significance (Table 6).

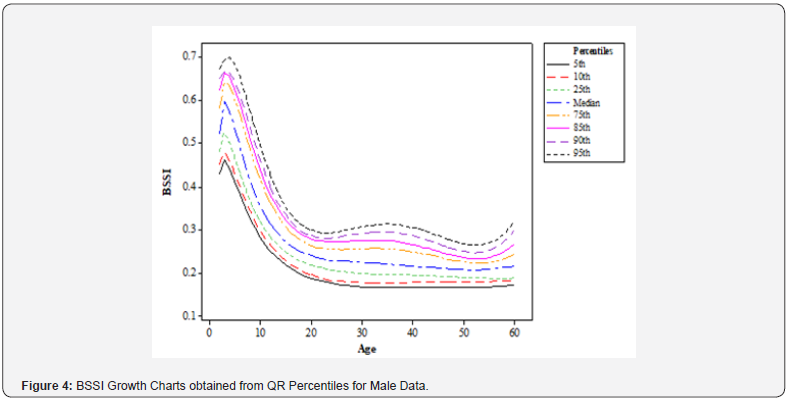
Growth chart: The growth chart developed from the QR technique with six powers of age analysed here is informative of the trends of BSSI among the male gender across various age brackets. (Figure 4) illustrates the BSSI growth chart by the eight percentiles: fifth, tenth, twenty-fifth, fiftieth (Median), seventyfifth, eightieth, ninetieth, and ninety-fifth. This indicates that BSSI is very low at ages 5-22 years for 85th-95th percentile and then significantly higher at ages 23-35 years and then drastically falls at ages 36-55 years and stabilizes in higher ages.
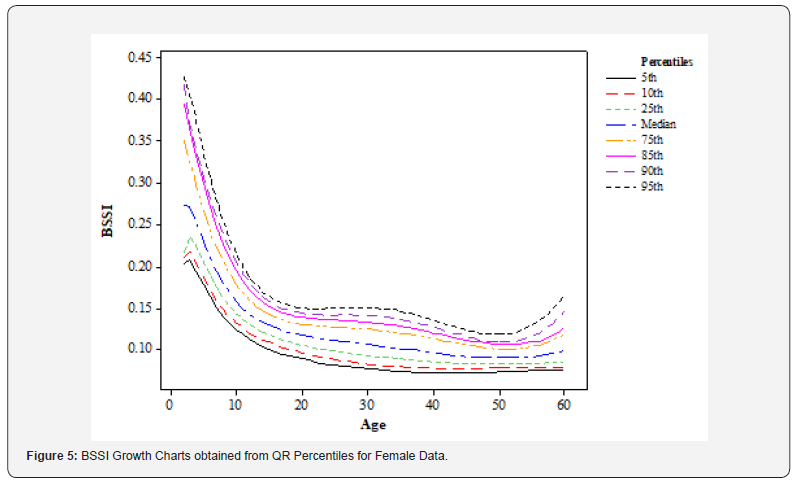
Female data: Gender-wise analysis of QR estimates for female data confirmed the association between BSSI and age with the median BSSI at 0.1165. As evident from the results of the QR analysis done in this study, the first three powers of age had a positive coefficient with BSSI while the last three had negative coefficients. In all the cases the p-values were less than 0.05 levels of significance (Table 7).

Growth chart: The growth chart constructed using the QR technique with six powers of age in the analysis give a useful insight into the BSSI distribution for females across the ages. (Figure 5) shows the BSSI growth chart for eight percentiles of BSSI including the fifth, tenth, twenty-fifth, fiftieth (Median), seventy-fifth, eighty-fifth, ninetieth, and ninety-fifth percentile. It is also evident from these charts that BSSI quickly declines from ages 5-28 years for the 85th to 95th percentiles and then ascends quickly between ages 28 to 35 years, declines steeply until the age of 52 years, and then rises again in the old ages.
The presented results can be useful for healthcare professionals and researchers as the proposed approach has shown its effectiveness in practice. This chart can come in handy in determining the BSSI of an individual based on the age and sex of the individual in question. The log-likelihood estimates from the QR may also be employed to calibrate the BSSI for each person in the function of his/her age, gender, and marital status. This study offers helpful information on the association between BSSI and age in both genders and offers groundwork for the further examination of the aspects of developmental cycles of body composition between childhood and adulthood. The results of this research reveal that there are several powers of age affecting BSSI in both male and female participants. Based on the results of the study it is clear that healthcare providers should consider these relationships when evaluating the body composition of an individual and possibly when designing plans for weight loss or gain and generally when designing interventional strategies for promoting healthy aging. Other future research should pursue these associations to a greater extent to elucidate the processes that link stages in the human life span to changes in body composition.
QR analysis of BSSI for residential area
The association between Body Shape and Size Index (BSSI) and residential area was investigated in this study especially comparing rural and urban areas. This study used Quantile Regression (QR) to investigate the impact of age on BSSI at different quantiles, including the median. The following is a presentation of the results.
Rural data: The QR estimates for rural data also showed that there is a significant correlation of BSSI with age, the median or 50th percentile of BSSI is 0.2066. The cross-section of age demonstrated that the square and the cube of age had a positive effect on BSSI while the other powers had a negative effect. All p-values were statistically significant at a 0.05 level of significance (Table 8).

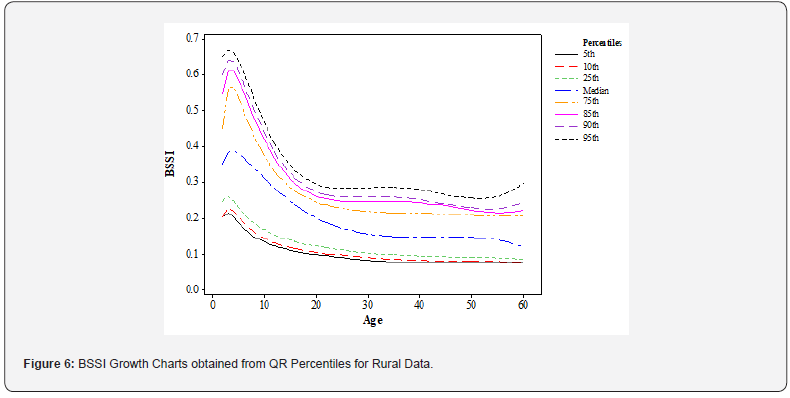
Growth chart: The use of the QR technique with six powers of age in the construction of the growth charts and subsequent analysis gives insights into the trends of BSSI concerning age in the rural setting. (Figure 6) shows the BSSI percentile growth charts for each of the eight percentiles (fifth, tenth, twenty-fifth, fiftieth (Median), seventy-fifth, eightieth, ninetieth, and ninety-fifth). The chart indicates that BSSI progressively declines with age from 5-26 years for the 85th-95th percentiles and thereafter increases with age from 27-37 years and then declines rapidly until 54 years and then increases in the subsequent years.
Urban data: As to the urban data, all the QR estimates represented evident connections between BSSI and age with the 50th percentile (median) BSSI being equal to 0.2069. The findings revealed that age to the power of one and age squared were significant and had negative coefficients while the remaining four powers had positive coefficients. The p-values for all the variables were recorded as being highly significant at the 0.05 level of significance (Table 9).

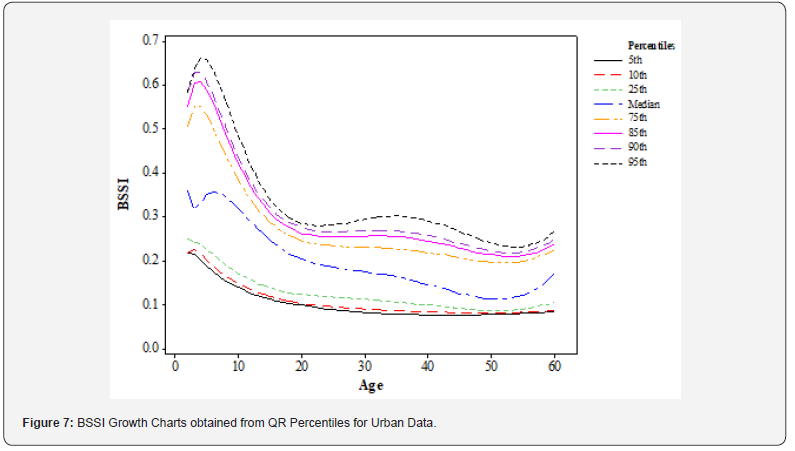
Growth chart: The current findings based on the growth charts developed from the QR technique with six powers of age in the analysis help understand the trend of BSSI over age in urban settings. (Figure 7) reveals the BSSI growth chart for 8 percentiles: fifth, tenth, twenty-fifth, fiftieth (Median), seventy-fifth, eightyfifth, ninetieth, and ninety-fifth. The chart shows that the BSSI increases from age 5-22 years at a decreasing rate for the 85th-95th percentiles and then increases in the 23-32 years before rapidly decreasing until age 54 before increasing in later ages.
The results of this study have several implications for healthcare clinicians and scholars. BSSI scores obtained can be used to compare with the growth charts to determine how a particular person’s score compares to his or her residential area and age bracket. Also, from Tables 2-5, the QR estimates can be used to generate BSSI prediction models according to the demographic attributes of the individual. As a result of the analysis of the current research, it has been established that there is a positive correlation between BSSI and different powers of age within rural and urban settings. Based on these relationships, healthcare providers should consider them while examining an individual’s body composition and in designing interventions for promoting healthy aging. Subsequent research should explore these associations more to determine the factors that affect change in body composition by the type of residential zone and developmental period.
This study offers evidence that the assessment of body composition should consider the residential area. The population that lives in urban areas is exposed to different factors in their environment and their lifestyle in comparison with rural populations which can influence their body composition. This is why more future research should aim at examining these differences and creating effective interventions that incorporate these factors. The current research contributes to the understanding of the correlation of BSSI and the residential area and such factors should be considered in body composition assessment. This knowledge of these relationships can be helpful to healthcare providers when designing interventions to enhance healthy aging and increase the probability of good health among the aging population.
Raw percentiles growth charts for BSSI
The raw percentiles growth chart for BSSI data was analyzed using statistical tools SPSS-19 and Minitab-16. But for this section, analysis of results has been done for complete data, and it has also been subdivided by gender and rural/urban areas.
BSSI raw percentiles growth chart for complete data
When it comes to the raw percentile’s growth chart for complete data which is illustrated in (Figure 8), it depicts the BSSI for children between the ages of 2 and 29 years, it shows that the BSSI has progressively risen for all the percentiles. All these changes are quite natural during childhood development and teenage years when children are growing fast. Specifically, for BSSI, there is a steep increase from the age of 29 years, and then a slow decrease until the age of 60 years. This pattern points to the notion that BSSI rises through early adulthood but then stabilizes or decreases in later years. The profile of BSSI against age has several characteristics, which may be useful to infer changes in body composition through the years. The continued increase in BSSI in childhood and adolescent age groups can be attributed to the dynamic cell tissue growth that occurs at this age. The sharp rise in BSSI among the age groups 29-34 years and 35-54 years may be associated with the attainment of the final adult height and weight during this period of life. The reduction of BSSI after the age of 54 could be attributed to biological aging that is manifested by a decrease in muscle mass, and bone density.
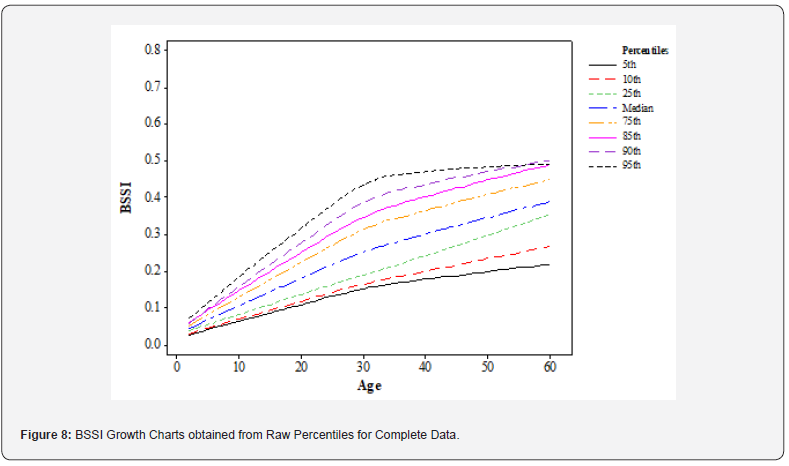
For a better visualization of these patterns, it is more useful to separate the raw percentiles growth chart into more distinct curves for each percentile point (5th, 10th, 25th, 50th (Median), 75th, 85th, 90th, 95th). This is more favourable for investigating how BSSI alters with age and, consequently, with percentiles. For instance, the 5th percentile may represent the minimum values of BSSI in each age range while the 95th percentile may represent the maximum values. The implications regarding these findings are relevant both for the healthcare providers and for the researchers. The raw percentile growth charts can be utilized as a frame of reference to compare the patient’s BSSI to that of the same age group and percentile rank. The changes in body fat mass that may be anticipated during life can be predicted with the help of these charts. The raw percentile growth charts for BSSI are also useful for deciphering trends in body composition across age groups. The BSSI increased steadily and progressively during infancy and adolescence. There is a continuous shift in body composition throughout life, as seen by the steep increase in the early adult years and the steady fall in the later years. Understanding these trends can help healthcare providers assess a patient’s body composition more precisely and offer targeted medications to promote healthy aging.
BSSI raw percentiles growth charts for gender
Different patterns in the data were found for men and women when the Body Shape and Size Index (BSSI) raw percentile growth charts were analysed according to gender. The results for the male and female data are shown individually in this section, emphasizing the variations in BSSI growth throughout various age groups.
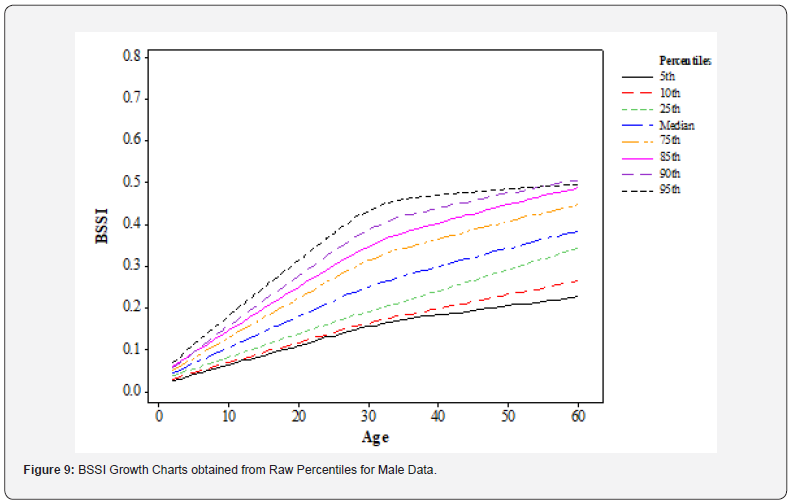
Male data: For male data, we see using the raw percentile growth chart (Figure 9) an increasing trend in BSSI percentiles from the age of 2 to 24 years. It is normal for children and adolescents to experience steady growth, and this period is the most stable. However, after the age of 24 years, BSSI increases steeply and reaches the highest point in people aged 36 years, after which BSSI gradually increases in individuals till the age of 60 years. The 95th percentile curve is still noticeable but differs from the rest of the percentiles, it shows a steeper slope of the BSSI at the top of the distribution. This pattern could be a result of the normal transition through puberty and early adulthood, where body composition alters such as the growth of muscles and bones. This is also in line with the increase in BSSI that is characterized by the pubertal growth spurt in males.
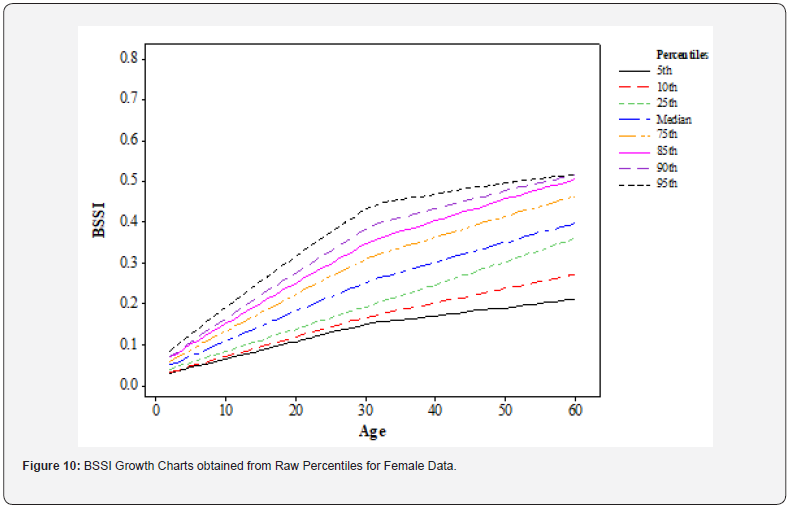
Female data: The female data presented in (Figure 10) shows an increase in BSSI for all percentiles at the age of 2 to 30 years. Such gradual progression of increase is also in line with normal human growth, especially during childhood and adolescence. But after the age of 30 years, BSSI sharply increases in the age group of 31-35 years and gradually increases in every successive age period up to 60. This pattern is also similar to what has been observed in the male data, but it seems that the onset of the phase of fast growth is a bit earlier in the female data.
These results have implications for the need to take account of sexual dimorphisms in the patterning of body composition changes as a function of age. Healthcare providers should bear these differences in mind when evaluating an individual body composition as well as when designing specific strategies for healthy aging for vulnerable groups. They also intended those important changes in body composition happen in puberty and early adulthood most especially in males. This period is characterized by rapid development and changes in muscles and bones, which can have positive effects on the individual’s health in the future. The raw percentile growth charts that display the variations in the data for men and women help figure out the patterns in body composition across different age groups. The disparities in the patterns in the statistics for men and women highlight how important it is to consider gender when assessing how body composition has changed over time. Understanding these trends can help healthcare providers assess a patient’s body composition more precisely and offer targeted medications to promote healthy aging.
BSSI raw percentiles growth charts for residential area
Plotting the BSSI’s raw percentile growth charts took residential areas into account, and differences in the Body Shape and Size Index between urban and rural regions were noted. This section offers a more thorough comparison by separating the BSSI growth results for urban and rural locations and comparing the BSSI for various age groups.
Urban data: Based only on urban data, (Figure 11) shows the raw percentile growth chart for BSSI, which indicates a rise in BSSI across all percentiles, from 2 to 35 years of age. It is the type of growth that is considered normal for children during their growth and development or even in adolescence. However, after reaching 35 years, BSSI sharply increases to the age of 47 years and gradually increases further to the age of 60 years. It is also worth noting that the curve for the 95th percentile decreases in the last ages, which may also mean that the BSSI decreases at the upper tail of the distribution. The effect of urbanization on the development of body composition may explain this pattern of findings. Habitat has been linked to various environmental effects including pollution, noise, and stress and these are known to impact on the body composition. Many people in urban areas do not engage in regular exercise, and the sudden growth of BSSI during this period can be associated with a higher level of energy consumption.
Rural data: The rural data (Figure 12) shows a generally increasing trend in BSSI for all percentiles across the ages of 2-31 years. This period of steady growth is also normal as children and adolescents change their bodies and growth structures. However, after turning 31 years, BSSI increases significantly up to the age of 41 and steadily increases after that up to the age of 60 years. However, the 5th, 75th, and 95th percentiles of BSSI have decreasing trends in the last ages which may suggest a decrease in BSSI for the population.
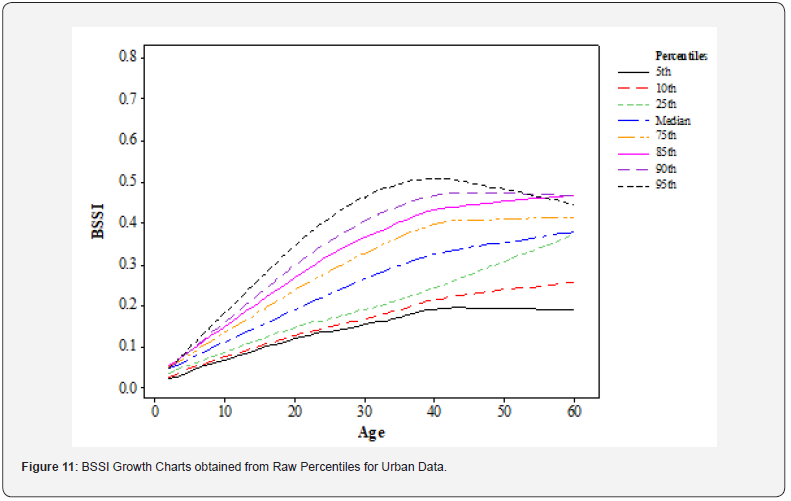
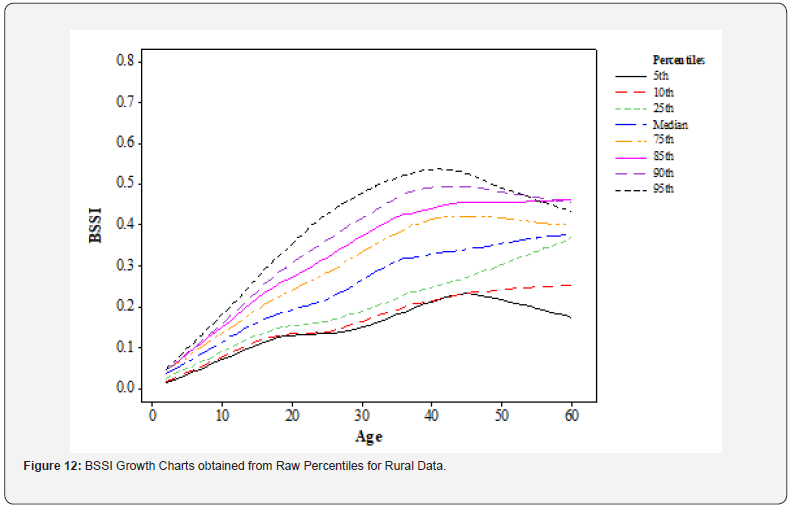
These findings emphasize the need to take into account the factors related to the living district to analyze the development of body composition. Healthcare providers need to be aware of these differences while designing programs and interventions that may help in promoting healthy aging. In light of these innovations, one could conclude that increasing urbanization may lead to adverse effects on body composition during later stages of life. Possible reasons for the reduction of BSSI at the higher end of the distribution might be attributed to decreased physical activity and higher caloric intake among urban dwellers. A good picture of the distribution of BSSI for age throughout the different age groups can be seen in the raw percentile growth charts for body composition data for both urban and rural areas. The disparities between the urban and rural statistics suggest that characteristics specific to different living locations must be considered to predict the evolution of body composition. With this information, healthcare professionals may more effectively assess an individual’s body composition and create plans that promote the aging process healthily.
Gaussian percentiles from BSSI
It is thought that the Body Shape and Size Index (BSSI) Gaussian percentile growth charts are useful for determining the trajectory of body composition [39]. According to Leonard, Hutcheon, Bodnar, Petito, and Abrams (2018), these charts help compare BSSI measures because they employ standardized Z-scores, which allow a kid to be measured against other children in different age ranges or population sets [40]. The resulting Z-score values are derived using regression models that forecast the BSSI measurements’ mean and standard deviation (SD).
BSSI gaussian percentiles growth chart for complete data
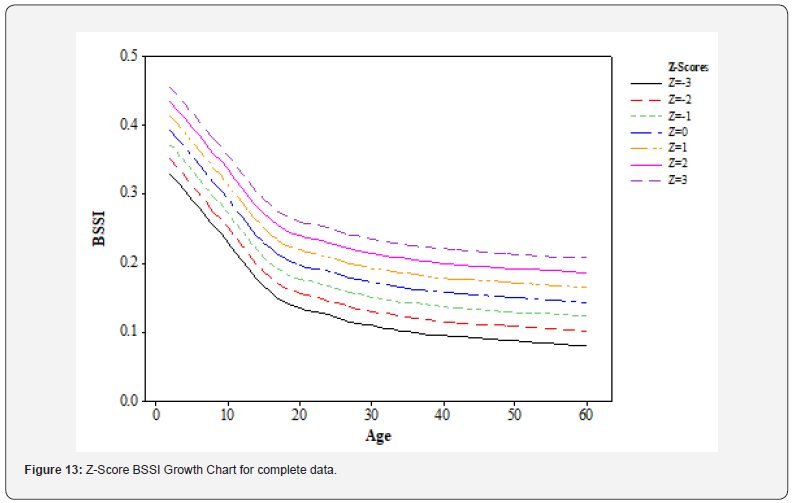
(Figure 13) below displays the growth curve of the BSSI data with Z scores; Z=0 denotes the average BSSI’s median value. The Z-score lines (growth curves) denoted by z = -1, -2, -3, 1, 2, & 3 on the other curving lines represent the departure from the mean. These growth curves, or Z-score lines, show how body composition distributes according to a typical normal distribution. They are obtained from the BSSI. We may also see the normal distribution of BSSI values visually thanks to the Z-score lines (growth curves) with the plus sign (+) 1, 2, and 3, and the negative sign (-) -1, -2, and 3 [28]. A growth issue can be distinguished by points that are located significantly below the median (z=0) line or significantly above the median line, which means that their BSSI value is above or below the average value [41]. This can be especially useful in the early detection of disordered and abnormal development of body composition.
Healthcare professionals may find it helpful to analyze body composition maturation and development issues with the use of the extremely helpful percentile growth charts that are produced from the Gaussian distribution. Knowing typical BSSI values enables medical personnel to precisely assess an aged patient’s body composition and develop appropriate preventative measures against the negative impacts of poor body composition. Because of this, the BSSI Gaussian percentile growth charts help evaluate the development of body composition and early indicators of growth problems. These charts provide a graphical representation of the normal distribution of body composition using standardized Z-scores and allow comparisons of BSSI data across age groups and populations.
BSSI gaussian percentiles growth charts for gender
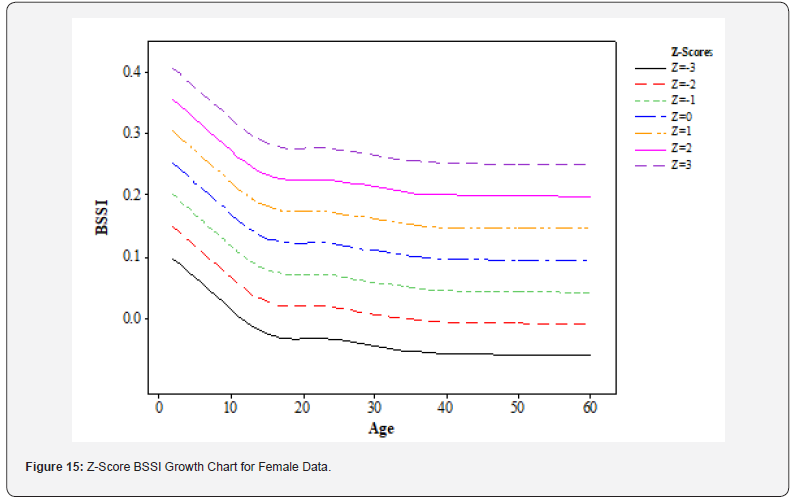
Based on the findings of the survey of respondents, both male and female, (Figures 15 & 16) show the Gaussian percentile growth charts for the Body Shape and Size Index (BSSI), allowing for the evaluation of body composition development in both sexes. These charts assist healthcare providers in examining the BSSI value distribution and provide a graphical representation of the scores’ normal distribution. This allows them to identify values that deviate from the expected aging process and identify values that should be promoted to support healthy aging.
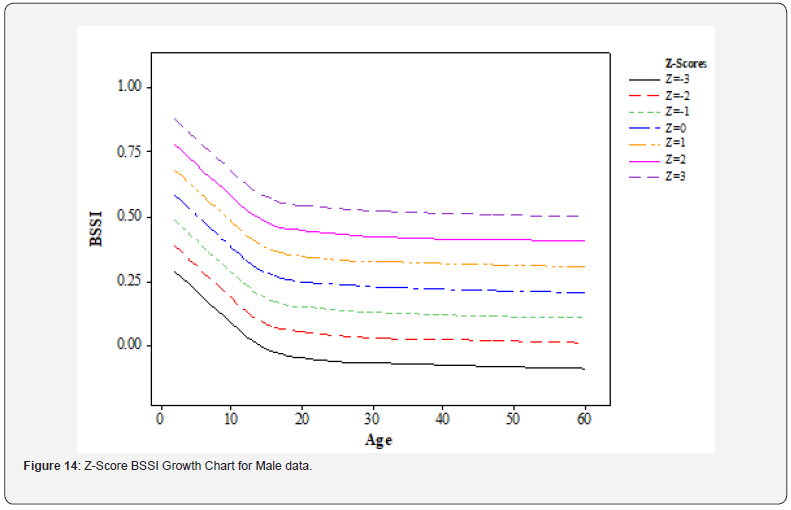
Male data: The BSSI growth chart of the males is illustrated in (Figure 14) with the median (z=0) line indicating the average BSSI value. The other curved lines represent Z-score lines that are z=-1, -2, -3, 1, 2, and 3 which represent a deviation from the average. These Z-score lines are the estimation based on BSSI and aim at helping to visualize the normative distribution of body composition in males. A growth issue can be defined when the points are located away from the central line with either a positive or negative z=0 line suggesting a departure from the mean of BSSI. This can be highly beneficial for the development of male body composition, particularly in identifying those who have not developed appropriately.
Female data: (Figure 15) below shows the female BSSI development chart; the pattern is a little different from Figure 14. The median BSSI value, or z=0, is indicated by the line that crosses the middle. Conversely, the remaining curved lines stand for Z-score lines, which include z=-3, -2, -1, 1, 2, and 3. The Z-score lines, with numbers 1, 2, and 3 for the positive side and -3, -2, and -1 for the negative side, show the normal distribution of BSSI values in females [42]. A growth problem may also be observed by means if they are dispersed much above or below the median (z=0) line.
Understanding the normal distribution of body composition in both male and female populations can be aided by using the Gaussian percentile growth charts of the male and female BSSI. Clinicians can better understand a patient’s body composition and develop strategies for promoting a healthy life span by recognizing these trends. There’s proof that these charts can help spot early indicators of growth issues as well, averting further health issues. When evaluating body composition and development issues in both sexes, the % growth chart for boys and females BSSI utilizing the Gaussian percentile might be helpful. These charts provide a visual representation of the body composition normal distribution using standardized Z-scores, which makes it easier to compare BSSI data between various age groups and demographics.
BSSI gaussian percentiles growth charts for residential area
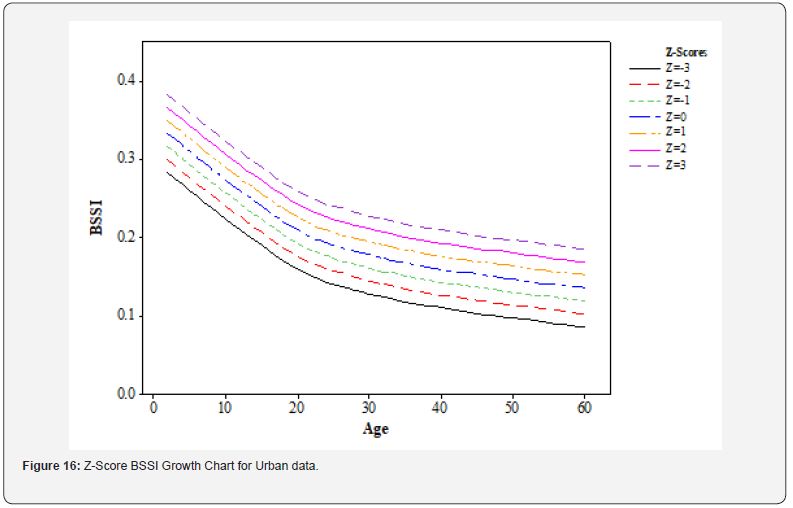
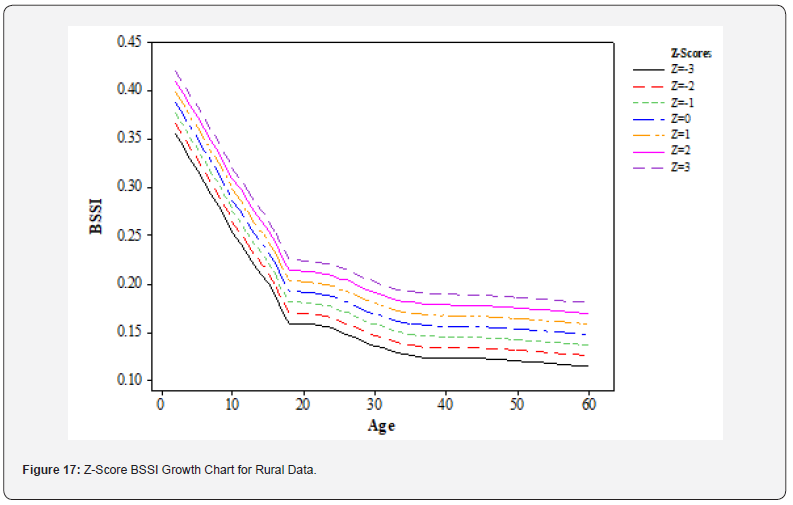
According to Zanqueli et al. (2019), the BSSI’s Gaussian percentile growth charts are categorized by the kind of resident region rural or urban making them a helpful tool for evaluating changes in body composition over time [43]. These charts may be used to determine whether any of the patients may be having growth issues and to develop unique treatment plans to support healthy aging. They provide a graphical representation of the typical distribution of BSSI values.
Urban data: (Figure 16) shows the average BSSI value, or the median (z=0) line, based on the urban BSSI data with Z-scores. The other curving lines are Z-score lines that deviate from the center line and are represented by the values of z=-1, -2, -3, 1, 2, and 3. The BSSI was used to estimate these Z-score lines, which are meant to show the distribution of body composition in healthy individuals residing in cities. This means that a growth issue can be defined based on points that are far away from the middle line or the z=0 line in a positive or negative direction, thereby showing a variation from the average BSSI. This can be of particular importance when it comes to early detection of the population with the problem of abnormal body mass composition in urban settings.
Rural data: (Figure 17) below presents the rural BSSI data with the Z-scores. The pattern is not the same as the one observed in Figure 15 above. The straight line in the middle of the curves is a median line set at z=0 The other curved lines are Z-score lines which are set at z=-1, -2, -3, 1, 2, 3 respectively. The enumeration of Z-score lines is positive (1, 2, and 3) and the other lines have negative numerations (-1, -2, and -3) to show the normal distribution of BSSI values in the rural dwellers. A growth issue can also be seen at points that are far away from the middle line or median line with a positive or negative value of z = 0.
The Gaussian percentile growth charts for BSSI living in either urban or rural areas also help in understanding the distribution of body composition for the normal dwelling population. Through such patterns, healthcare providers can evaluate individual body composition in one or various settings and create intervention goals for promoting health during aging. These charts can aid in the early identification of situations that can develop into development issues later on and, as a result, ensure that they receive the appropriate care on time to prevent further complications. These figures suggest that the development of a person’s body composition may differ based on whether they reside in an urban or rural region. Being in an urban region increases the exposure to environmental stressors including noise pollution and air pollution, which may cause changes in body composition to occur more quickly. In contrast, people who live in rural locations may have more gradual changes in their body composition due to their slower pace of life and decreased exposure to outside stressors. The Gaussian percentile growth charts, both urban and rural, provided by the BSSI are a great tool for evaluating how body composition is developing and identifying potential growth issues in different residential areas. These charts provide a graphical representation of the normal distribution of body composition using standardized Z-scores and allow comparisons of BSSI data across age groups and populations.
Comparison of qr, gaussian and raw percentiles
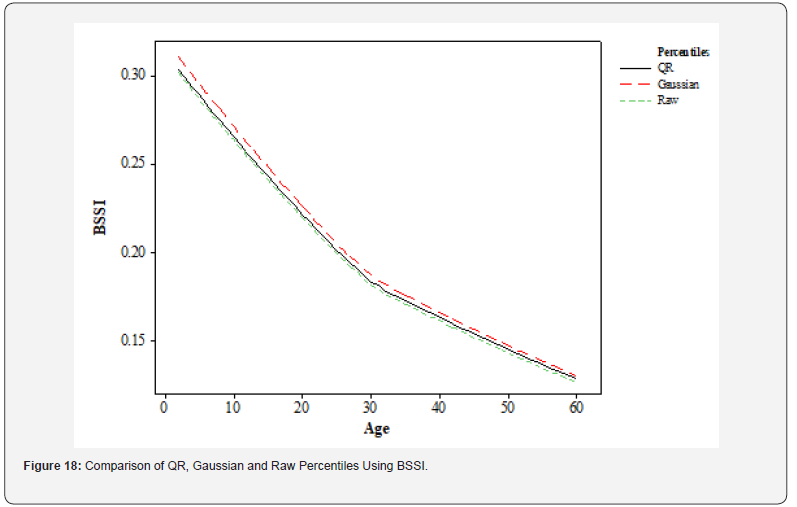
It is necessary to provide a quick explanation of QR, Gaussian, and Raw Percentiles before their comparison. In addition to the z=0 (median) curve for Gaussian percentiles suggested by [44], the 50th percentile (median) curve of QR and Raw percentiles are utilized as a point of comparison. The study therefore highlights the Body Shape and Size Index (BSSI), an emerging anthropometric indicator in this work.
As seen in (Figure 18), the visualization of QR, Gaussian, and Raw Percentiles from BSSI data brings out a certain trend. As expected, the curve of QR Percentiles is located between the curves of Gaussian and Raw Percentiles as QR Percentiles present a moderate behaviour of the extreme values which is not as skewed as Gaussian Percentiles or as extreme outliers like Raw Percentiles. Another main difference between the two is that the Gaussian Percentiles are less sensitive to outliers compared to QR. This means that Gaussian Percentiles can be skewed by outliers, which is an undesirable trait for a measure that is intended to accurately depict the distribution of the data. In contrast, QR Percentiles are least affected by the extreme values of the data and it can be said that they give a better description of the distribution of data. This difference is evident in the comparison made in Figure 18, where the Gaussian Percentile curve is scored lower than the QR Percentile curve. However, Raw Percentiles do not have transformations or smoothing of data, because of this, information can sometimes appear scattered. The Raw Percentile curve in Figure 18 looks less smooth and may not be a better representation of the distribution of the data as compared to the other two curves.
The other major difference between QR and Raw Percentiles is that they are more capable of detecting non-linear relationship. QR Percentiles incorporate polynomial terms to capture nonlinearity, while Raw Percentiles fail to capture non-linearity [45]. In Figure 18, it is clear that for BSSI, the QR Percentile curve bodes well with the non-linear pattern than the Raw Percentile curve, meaning that QR Percentiles are more appropriate for modelling complex patterns. However, Gauss Percentiles use a normal distribution of data which may not always be the best for all the data sets. From the analysis of BSSI data, it is established that QR Percentiles behave moderately, they are not overly influenced by outliers and can detect non-linear relationships. While Gaussian Percentiles are prone to outlying values, in case the data contains such a value, Raw Percentiles do not apply any sort of transformation or smoothing and may give a rather scattered impression of the characteristic of data. Quantile Regression (QR) is a statistical method used to obtain the characteristics of the response variable and at least one predictor variable in the QR model [46]. QR is an extension of the process of linear regression that allows determining the non-linear relationship between two variables [47]. In the present research, QR is used to analyse the BSSI concerning some demographic factors.
Some types of percentiles that are anticipated in the normal distribution of the data include the Gaussian percentiles [27]. They can be used in arithmetic computations to provide an overview of the distribution of data. In this study, Gaussian Percentiles are also applied for comparison with QR and Raw Percentiles. Raw percentiles are the basic type of percentile and no adjustments or smoothing have been made to the data. It provides a very simple and direct way of estimating the shape of the distribution of values without any assumption about the distribution of the population. QR and Gaussian Percentiles are compared with the Raw Percentiles, which are used in the given research.
This research also underlines the importance of applying the comparison of different statistical methods when dealing with data. Considering the types of the percentile such as the QR, Gaussian, and the Raw percentile, it can be seen that each of the mentioned techniques has its strengths and weaknesses when used on the BSSI data. However, it is important to note that Gaussian percentiles are more influenced by outlying values of data and may not be appropriate for use in all situations because of this reason while QR percentiles are comparatively less influenced by outlying values of data and can handle non-linear nature of the data. Raw percentiles do not convert the data in any other way or remove trends and might show a skewed distribution of the data.
Discussion
The objective of this study is to outline the correlation of BSSI with various demographic factors and to use the quantile regression percentiles, raw percentiles, and Gaussian Percentiles techniques. These findings of the present investigation provide useful information on the multiple interactions between BSSI and demographic factors and indicate the importance of considering the curvilinear trends in the change of body composition across the life span. The analysis of the descriptive statistics showed that there is a significant relationship between BSSI and age, gender, area of residence, marital status, and the level of monthly family income. These findings are in line with the past studies that have pointed out the relation between BSSI and several demographic variables [1]. The studies carried out in the Obesity journals showed that, the type of region an individual lives in and the income level affects body mass and body size [9, 48-50].
In analysing the test results of BSSI and demographic factors, Quantile Regression (QR) was used. QR is a statistical method applied in predicting and estimating the outcome continuous variable (BSSI) based on the predictor variable; the demographic factors at various percentiles or quantiles [51]. The above QR estimates indicated that BSSI had a direct association with age and the median value of BSSI was recorded as 0.1668. This is in concordance with prior research on BSSI pointing out that it increases with age and is highest in middle adulthood before decreasing [52, 53]. The comparison of the social innovation perspective was also represented through QR estimates and it was discovered that the first two powers of age were positive and significant at the 1% level while the other four powers were negative and significant at the 1% level. This means that BSSI has ups and downs in different age phases or stages in life. The first period was identified to be the early childhood period of age 2-4 years; this was identified to be the period that records the highest increase in BSSI while the second period was identified to be the adolescent phase of age 5-25 years which was in the plateau phase. The middle adulthood stage, which ranges from 25-40 years, was slightly higher than the later adulthood stage of 55 and above. Such outcomes are consistent with earlier research where it was found that, during human development, body shape and size change in various manners [54-56].
Besides QR percentiles, Gaussian percentiles were also applied for comparison of BSSI across the ages. Gaussian percentiles are used to indicate how many data values exist at a certain distance from the normal distribution curve. The results suggested that, in each age group, BSSI has an inverse U-shape, and boys and girls differ in body shape and size changes. This is in concordance with other studies that have established that body shape and size, are gendered during childhood and adolescence [57-59]. Raw percentiles were also used to examine the relationship between BSSI and demographic features. Raw percentiles are simply the measure of the distribution of data at a given point of the values scale without grouping the values into classes. For instance, the study established that single people had different bodies or sizes compared to people who were married. This was made by other authors who observed that marital status correlates with body shape and size [60,61].
The analysis of results received with the help of QR, Gaussian percentiles, and raw percentiles is useful to gain insights about the dependency of BSSI on demographic variables. QR provided the chance to estimate the trend of BSSI concerning demographic characteristics either at percentile or quantiles and, on the other hand, Gaussian percentiles provided ways of presenting the state of the data at a particular point on the normal distribution curve. Raw Percentiles proved to be useful in providing a narrative of the location of the data at any given point in the direction of all the values. The results highlight the possibility that some components of body composition exhibit development and decay at different times, and hence should not be seen as continuous processes. According to the study’s findings, there are differences between boys’ and girls’ changes in body form and size between early infancy and adolescence, as well as between single respondents and those who are married. Because of these ramifications, medical practitioners must do more study and comprehend how the body shape and size index (BSSI) relates to demographic traits, particularly in the areas of diet and exercise.
Conclusion
The present study investigated the relationship between Body Shape and Size Index (BSSI) and different Demographic variables. The findings can shed light on the relationship between BSSI and demographic characteristics and reveal the need for a deeper understanding of nonlinear trends in body composition changes during the human life stages. The cross-sectional analysis showed that there were statistically meaningful variations in BSSI based on age, gender, residential area, marital status, and monthly income. These results support the literature review findings that BSSI depends on several demographical factors. It is also found from the results that boys and girls have differences in body shape and size changes in the childhood and adolescent stage, unmarried people also have differences compared to married people.
The QR analysis for the current study delivered more refined results to determine the relationship between BSSI and demographic factors. The QR estimates indicated the existence of a positive relationship between BSSI and age and the median BSSI is equal to 0.1668. The findings also pointed to the fact that there are cyclic stages of BSSI based on age, with early childhood featuring high increases, adolescence featuring little changes, middle adulthood featuring an increase, and later adulthood featuring a decrease in BSSI. The conclusions of this study are important for healthcare professionals and scholars interested in the context and influence of BSSI and demographic characteristics. The findings of the study support the notion that BSSI is a valuable method for the evaluation of body composition at different stages of development and indicate that BSSI may be affected by various demographic characteristics. The study emphasizes the regularity of not only the linear but also the cyclic changes in body mass and fatness which should be taken into consideration when evaluating health consequences.
Apart from the theoretical contributions it makes, the study has real-world implications for practitioners in the health sector. The findings can thus be employed to estimate the BSSI of an individual given his or her demographic profile to create an individualized model. These data can be applied in designing programs that may help to prevent such conditions as obesity, diabetes, and cardiovascular diseases, based on changing body composition. This study gives a broad insight into the relationship of BSSI and several demographics. The findings drawn from the study underscore the need to acknowledge and address issues of non-linear and dynamic changes in body composition across the lifespan and provide valuable information to clinicians and researchers who wish to unravel the interconnection between the BSSI and demographic characteristics. This study has a critical value for understanding the nature of the association of Body Shape and Size Index (BSSI) and demographic factors and can be useful for future research to consider nonlinear growth and decline curves for body composition in different periods of the life span.
Recommendations for future research
The following recommendations should be considered for
future research:
To complete cross-sectional surveys to compare changes
in BSSI over the years. Examining the association between BSSI
and other health-related factors including metabolic syndrome,
cardiovascular disease, and cancer. Creating an individual’s
BSSI models based on such demographic profiles. Investigating
the success of interventionist efforts in increasing healthy body
composition employing BSSI as the best outcome measure.
Strength and limitations
The present study has some methodological advantages, first, the three different statistical measures, QR, Raw percentiles, and Z scores were compared taking obesity as the context. It also makes it easier to compare and contrast the findings related to BSSI with the demographic factors, as well as the merits and demerits of each statistical analysis used in the study. The study’s main strength is that it applies Quantile Regression that helps in detecting the relevant relationships between BSSI and demographic factors. This approach offers a greater level of insight into the relationship between BSSI and demographic factors, either in terms of different percentiles or quantiles, enhancing the accuracy of the BSSI model in capturing various interactions between these elements. Raw Percentiles and Z-Scores are also useful in comparing BSSI by age and demographic breakdown to get a broad view of the data. Raw Percentiles are the gross representation of the dispersion of BSSI at various points along the complete range of values and Z-scores offer a relative measure of the extent of variation from the average value. These approaches can be used to identify individuals who are significantly above or below average in terms of BSSI, which can be important for identifying individuals at high risk for obesity-related health problems.
Despite the strengths of this study, there are some limitations that should be acknowledged. One potential problem is the lack of control for certain demographics, such as smoking and nonsmoking status, pregnancy, socio-economic status, ancestry, etc. These factors may have an impact on BSSI and could potentially confound the relationships observed in this study. Future studies should consider controlling for these factors to provide a more comprehensive understanding of the relationship between BSSI and demographic factors. Another limitation is that this study was based on a cross-sectional analysis, which does not allow for causal inference. Future studies could use longitudinal designs to examine changes in BSSI over time and assess whether these changes are associated with changes in demographic factors. This study only included data from a single population and did not account for potential biases in sampling. Future studies should aim to recruit participants from diverse populations and use rigorous sampling methods to ensure that the sample is representative of the target population.
While this study has several strengths, including its comprehensive comparison of statistical approaches and its ability to identify significant relationships between BSSI and demographic factors, there are also some limitations that should be acknowledged. Future studies should consider controlling for additional demographics, using longitudinal designs, and recruiting participants from diverse populations to provide a more comprehensive understanding of the relationship between BSSI and demographic factors.
Author’s Contribution
Waqas Ghulam Hussain Atif Akbar & Farrukh Shehzad
provide substantial contributions to conception and design, or
acquisition of data, or analysis and interpretation of data.
Waqas Ghulam Hussain make drafting of the article and
revising it critically for important intellectual content; and
Farrukh Shehzad & Atif give final approval of the version
to be published.
Agreement to be accountable for all aspects of the work in ensuring that questions related to the accuracy or integrity of any part of the work are appropriately investigated and resolved.
References
- Hussain WG, Shehzad F, Ahmad R, Akbar A (2021) Establishing growth charts for proposed body shape and size index of the Pakistani population, using quantile regression approach. SAGE Open Medicine 9: 20503121211036135.
- Rahman SA, Adjeroh D, (2015) Surface-based body shape index and its relationship with all-cause mortality. PloS one 10(12): e0144639.
- Gardosi J, Francis A, Turner S, Williams M (2018) Customized growth charts: rationale, validation and clinical benefits. American journal of obstetrics and gynecology 218(2): S609-S618.
- Asif M, Aslam M, Khan S, Altaf S, Ahmad S, et al. (2021) Developing neck circumference growth reference charts for Pakistani children and adolescents using the lambda-mu-sigma and quantile regression method. Public health nutrition 24(17): 5641-5649.
- Yuya Katabuchi (2020) Essays on quantile regressions: Kyushu University Pp.
- Yang Y, Shields GS, Guo C, Liu Y (2018) Executive function performance in obesity and overweight individuals: A meta-analysis and review. Neuroscience & Biobehavioral Reviews 84: 225-544.
- Organization WH (2022) WHO European regional obesity report 2022: World Health Organization. Regional Office for Europe Pp.
- Semlitsch T, Stigler FL, Jeitler K, Horvath K, Siebenhofer A (2019) Management of overweight and obesity in primary care-A systematic overview of international evidence‐based guidelines. Obesity Reviews 20(9): 1218-1230.
- Ataey A, Jafarvand E, Adham D, Moradi-Asl E (2020) The relationship between obesity, overweight, and the human development index in world health organization eastern mediterranean region countries. Journal of Preventive Medicine and Public Health 53(2): 98-105.
- Saeedi P, Petersohn I, Salpea P, Malanda B, Karuranga S, et al. (2019) Global and regional diabetes prevalence estimates for 2019 and projections for 2030 and 2045: Results from the International Diabetes Federation Diabetes Atlas. Diabetes research and clinical practice 157: 107843.
- Chen L, Wang L, Hu Z, Tao Y, Song W, et al. (2022) Combining Z-score and maternal copy number variation analysis increases the positive rate and accuracy in non-invasive prenatal testing. Frontiers in genetics 13: 887176.
- Mohammadi MR, Mostafavi S-A, Hooshyari Z, Khaleghi A, Ahmadi N, et al. (2020) National growth charts for BMI among Iranian children and adolescents in comparison with the WHO and CDC curves. Childhood obesity 16(1): 34-43.
- Sarna A, Porwal A, Acharya R, Ashraf S, Ramesh S, et al. (2021) Waist circumference, waist‐to‐height ratio and BMI percentiles in children aged 5 to 19 years in India: A population‐based study. Obesity Science & Practice 7(4): 392-404.
- Kiserud T, Benachi A, Hecher K, Perez RG, Carvalho J, et al. (2018) The World Health Organization fetal growth charts: concept, findings, interpretation, and application. American journal of obstetrics and gynecology 218(2): S619-S629.
- Liauw J, Mayer C, Albert A, Fernandez A, Hutcheon JA (2022) Which chart and which cut-point: deciding on the INTERGROWTH, World Health Organization, or Hadlock fetal growth chart. BMC pregnancy and childbirth 22(1): 1-11.
- Boghossian NS, Geraci M, Edwards EM, Horbar JD (2018) Neonatal and fetal growth charts to identify preterm infants< 30 weeks gestation at risk of adverse outcomes. American journal of obstetrics and gynecology 219(2): 195.e1-195.e14.
- Chamidah N, Tjahjono E, Fadilah A, Lestari B, (2018) Standard growth charts for weight of children in East Java using local linear estimator. Journal of Physics: Conference Series Pp.
- Kløvgaard M, Nielsen NO, Sørensen TL, Bjerregaard P, Olsen B, et al. (2018) Growth of children in Greenland exceeds the World Health Organization growth charts. Acta Paediatrica 107(11): 1953-1965.
- Obilor EI (2023) Convenience and purposive sampling techniques: Are they the same. International Journal of Innovative Social & Science Education Research 11(1): 1-7.
- Lupu N, Michelitch K (2018) Advances in survey methods for the developing world. Annual Review of Political Science 21: 195-214.
- Smith DD, Pippen JL, Adesomo AA, Rood KM, Landon MB, et al. (2020) Exclusion of pregnant women from clinical trials during the coronavirus disease 2019 pandemic: a review of international registries. American Journal of Perinatology 37(08): 792-799.
- Chen X, Gong X, Li D, Zhang J (2019) Can information and communication technology reduce CO 2 emission? A quantile regression analysis. Environmental Science and Pollution Research 26: 32977-32992.
- Renjith V, Yesodharan R, Noronha JA, Ladd E, George A (2021) Qualitative methods in health care research. International journal of preventive medicine 12(1): 20.
- Amirrudin M, Nasution K, Supahar S (2021) Effect of variability on Cronbach alpha reliability in research practice. Journal Matematika, Statistika dan Komputasi 17(2): 223-230.
- Li Y, Vasconcelos N, (2019) Removing representation bias by dataset resampling. Proceedings of the IEEE/CVF conference on computer vision and pattern recognition Pp.
- Kharuddin F, Azid N, Mustafa Z, Kamari N, Ibrahim K, et al. (2020) Determination of sample size in early childcare Centre (TASKA) service project in Malaysia: Classification and Analytical Approach. Albukhary Social Business Journal 1(2): 104-112.
- Martinez-Millana A, Hulst JM, Boon M, Witters P, Fernandez-Llatas C, et al. (2018) Optimisation of children z-score calculation based on new statistical techniques. PLoS One 13(12): e0208362.
- Madsen A, Almås B, Bruserud IS, Oehme NHB, Nielsen CS, et al. (2022) Reference curves for pediatric endocrinology: leveraging biomarker Z-scores for clinical classifications. The Journal of Clinical Endocrinology & Metabolism 107(7): 2004-2015.
- Rutten DW, Aarts-Janssen IJ, Kempers MJ, Reimer AG, Ten Cate FEU, et al. (2021) Comparability of different Z-score equations for aortic root dimensions in children with Marfan syndrome. Cardiology in the Young 31(12): 1962-1968.
- Niessner C, Utesch T, Oriwol D, Hanssen-Doose A, Schmidt SC, et al. (2020) Representative percentile curves of physical fitness from early childhood to early adulthood: the MoMo study. Frontiers in public health 8: 458.
- Bussler S, Vogel M, Pietzner D, Harms K, Buzek T, et al. (2018) New pediatric percentiles of liver enzyme serum levels (alanine aminotransferase, aspartate aminotransferase, γ‐glutamyltransferase): effects of age, sex, body mass index, and pubertal stage. Hepatology 68(4): 1319-1330.
- Dabney W, Rowland M, Bellemare M, Munos R, (2018) Distributional reinforcement learning with quantile regression. Proceedings of the AAAI conference on artificial intelligence Pp.
- Staffa SJ, Kohane DS, Zurakowski D (2019) Quantile regression and its applications: a primer for anesthesiologists. Anesthesia & Analgesia 128(4): 820-830.
- Waldmann E (2018) Quantile regression: A short story on how and why. Statistical Modelling 18(3-4): 203-218.
- Liu X (2018) Some new developments for quantile regression: Brunel University London Pp.
- Xu M (2023) Quantile Regression Model and Its Application Research. Academic Journal of Science and Technology 8(3): 172-176.
- Chen W, Lei Y (2018) The impacts of renewable energy and technological innovation on environment-energy-growth nexus: new evidence from a panel quantile regression. Renewable energy 123: 1-14.
- Strickland MJ, Lin Y, Darrow LA, Warren JL, Mulholland JA, et al. (2019) Associations between ambient air pollutant concentrations and birth weight: a quantile regression analysis. Epidemiology 30(5): 624-632.
- Wei R, Ogden CL, Parsons VL, Freedman DS, Hales CM (2020) A method for calculating BMI z-scores and percentiles above the 95th percentile of the CDC growth charts. Annals of human biology 47(6): 514-521.
- Leonard SA, Hutcheon JA, Bodnar LM, Petito LC, Abrams B (2018) Gestational weight gain‐for‐gestational age z‐score charts applied across US populations. Paediatric and perinatal epidemiology 32(2): 161-171.
- El Shafie AM, El-Gendy FM, Allahony DM, Hegran HH, Omar ZA, et al. (2021) Development of LMS and Z score growth references for Egyptian children from birth up to 5 years. Frontiers in pediatrics 8: 598499.
- Phelan H, Foster NC, Schwandt A, Couper JJ, Willi S, et al. (2020) Longitudinal trajectories of BMI z‐score: an international comparison of 11,513 Australian, American and German/Austrian/Luxembourgian youth with type 1 diabetes. Pediatric obesity 15(2): e12582.
- Zaniqueli D, Oliosa PR, Neves FS, Pani VO, Martins CR, et al. (2019) Ponderal index classifies obesity in children and adolescents more accurately than body mass index z-scores. Pediatric research 86(1): 128-133.
- Li B, Yang H, Wei Y, Su R, Wang C, et al. (2016) Is it time to change our reference curve for femur length? Using the Z-score to select the best chart in a Chinese Population. PloS one 11(7): e0159733.
- Yirga AA, Ayele DG, Melesse SF (2018) Application of quantile regression: Modeling body mass index in Ethiopia. The Open Public Health Journal 11(1).
- Korkmaz MC, Altun E, Chesneau C, Yousof HM (2022) On the unit-Chen distribution with associated quantile regression and applications. Mathematica Slovaca 72(3): 765-786.
- Uribe JM, Guillen M (2020) Quantile regression for cross-sectional and time series data: Applications in energy markets using R: Springer Pp.
- Safaei M, Sundararajan EA, Driss M, Boulila W, Shapi'i A (2021) A systematic literature review on obesity: Understanding the causes & consequences of obesity and reviewing various machine learning approaches used to predict obesity. Computers in biology and medicine 136: 104754.
- Censin JC, Peters SA, Bovijn J, Ferreira T, Pulit SL, et al. (2019) Causal relationships between obesity and the leading causes of death in women and men. PLoS genetics 15(10): e1008405.
- Kim TJ, Von dem Knesebeck O (2018) Income and obesity: what is the direction of the relationship? A systematic review and meta-analysis. BMJ open 8(1): e019862.
- Sun M, Jiang Y, Sun C, Li J, Guo X, et al. (2019) The associations between smoking and obesity in northeast China: a quantile regression analysis. Scientific reports 9(1): 3732.
- Ayele DG, Abdallah ASR (2021) Mohammed MOM. Determinants of Under-Five Children Body Mass Index in Sudan; Application of Quantile Regression: A Systematic Review. Iranian journal of public health 50(1): 1.
- Kabir KM (2019) Lifestyle and Obesity in Canada-A Quantile Regression Approach Pp.
- Cameron N (2022) The measurement of human growth. Human growth and development: Elsevier Ppp: 317-345.
- Bogin B (2020) Patterns of human growth: Cambridge University Press Pp.
- Lerner RM (2018) Concepts and theories of human development: Routledge Pp.
- Rochow N, Landau-Crangle E, So HY, Pelc A, Fusch G, et al. (2019) Z-score differences based on cross-sectional growth charts do not reflect the growth rate of very low birth weight infants. PLoS One 14(5): e0216048.
- Freedman DS, Davies AJG, Kompaniyets L, Lange SJ, Goodman AB, et al. (2021) A longitudinal comparison of alternatives to body mass index Z-scores for children with very high body mass indexes. The Journal of pediatrics 235: 156-162.
- Bratincsák A, Kimata C, Limm-Chan BN, Vincent KP, Williams MR, et al. (2020) Electrocardiogram standards for children and young adults using Z-scores. Circulation: Arrhythmia and Electrophysiology 13(8): e008253.
- NCD Risk Factor Collaboration (2019) Rising rural body-mass index is the main driver of the global obesity epidemic in adults. Nature 569(7755): 260-264.
- Schoemaker MJ, Nichols HB, Wright LB, Brook MN, Jones ME, et al. (2018) Association of body mass index and age with subsequent breast cancer risk in premenopausal women. JAMA oncology 4(11): e181771-e.


