




 OAJGGM Home



Abstract
This study investigates the use of artificial intelligence and machine learning techniques to forecast future physical performance and intrinsic capacity in older adults. Leveraging longitudinal data from the English Longitudinal Study of Ageing (ELSA), the authors develop predictive models to estimate future Short Physical Performance Battery (SPPB) scores based on questionnaire-derived variables. Several modeling approaches, including linear regression, ensemble tree methods, and neural networks, are evaluated, with XGBoost achieving the best performance. Results demonstrate that future functional status can be predicted with clinically meaningful accuracy, with an average error below one SPPB point. The findings highlight the potential of remote, low-cost data collection through questionnaires to enable early detection of functional decline. Additionally, the study explores the integration of wearable sensor data to enhance continuous monitoring of physiological parameters. The proposed framework supports proactive healthcare interventions by identifying at-risk individuals before observable deterioration occurs. Overall, the approach offers a scalable solution for improving prevention strategies and personalized care in ageing populations.
Keywords:Healthy ageing; Geriatric assessment; Frailty; TabNet; XGBoost
Introduction
Maintaining physical and psychological capacity in older adults is a cornerstone of healthy ageing. Decline in mobility, balance, and lower-extremities strength is strongly associated with increased risk of disability, institutionalization, hospitalization, and mortality. Early identification of functional deterioration enables timely interventions that may delay or even reverse adverse trajectories. Accordingly, systematic screening of physical performance has become an essential component of geriatric assessment [1].
Among standardized tools, the Short Physical Performance Battery (SPPB) is widely used to quantify lower-extremity function. The SPPB integrates objective measurements of gait speed, standing balance, and repeated chair stands into a composite score ranging from 0 to 12 [2,3]. Lower scores are robustly associated with frailty, future disability, and adverse clinical outcomes. Due to its strong prognostic value, the SPPB is frequently employed in clinical practice and research as both a diagnostic and a monitoring instrument [2-4].
However, while the SPPB provides reliable objective data, its repeated administration presents practical limitations. The test requires in-person assessment, trained personnel, adequate physical space, and patient mobility sufficient to complete the tasks. Consequently, continuous or high-frequency monitoring of functional decline using performance-based tests is often impractical in real-world settings.
This limitation is particularly relevant because functional deterioration in older adults may occur gradually and silently. By the time measurable performance decline is detected during periodic assessment, opportunities for early preventive intervention may already have been missed. In geriatric medicine, prevention is widely recognized as more effective and less costly than reactive treatment. Early identification of individuals at risk for physical decline allows implementation of targeted strategies such as resistance training, balance exercises, nutritional optimization, and fall-prevention programs.
Recent advances in artificial intelligence (AI) and machine learning (ML) offer a promising approach to addressing this challenge. ML algorithms can be trained on a wide constituency of patients’ data to identify complex, nonlinear relationships between demographic factors, comorbidities, lifestyle characteristics, psychological status, and future functional outcomes. Unlike traditional statistical methods, ML models are particularly suited to capturing intricate interactions and high-dimensional patterns within clinical datasets [5-7].
Questionnaire-based patient-reported data represent an attractive input modality for such predictive modeling. These data can be collected remotely, repeatedly, and at low cost, without the need for in-person physical testing. If validated predictive models can accurately estimate future SPPB scores based solely on questionnaire responses, clinicians could identify high-risk individuals before objective decline becomes clinically apparent. This would enable proactive rather than reactive care, optimizing resource allocation and supporting personalized preventive strategies.
This article aims to bridge the gap between the established literature mentioned above and a novel approach centered on the processing of data from wearable sensors. While these devices are increasingly ubiquitous and represent a rapidly expanding segment of the global market, their clinical utility remains contingent upon data integrity. Indeed, the accuracy and quality of the extracted metrics are heavily dependent on the downstream processing techniques applied after the initial measurement. By refining these analytical workflows, wearable technology enables the continuous monitoring of physiological parameters, which serve as the foundation for the longitudinal estimation of intrinsic capacity.
Short Physical Performance Battery (SPPB) Protocol
The Short Physical Performance Battery (SPPB) is a standardized, performance-based assessment designed to evaluate lower-extremity physical function in older adults [2,3]. It has been widely validated as a predictor of disability, institutionalization, and mortality.
The SPPB consists of three components:
a) Standing balance test
b) Gait speed test
c) Repeated chair stand test
Each component is scored from 0 (inability to perform) to 4 (best performance), yielding a composite score ranging from 0 to 12, with higher scores indicating better lower-extremity function.
Standing Balance Test
Participants are asked to maintain three progressively
challenging positions for up to 10 seconds each:
a) Side-by-side stand (feet together)
b) Semi-tandem stand (heel of one foot placed beside the
big toe of the other)
c) Tandem stand (heel of one foot directly in front of the
other)
The participant first attempts the side-by-side position. If successfully maintained for 10 seconds, they proceed to semitandem, and subsequently to full tandem stance.
Scoring (0–4):
a) 0: Unable to hold side-by-side for 10 s
b) 1–3: Increasing ability to hold semi-tandem or tandem
positions
c) 4: Holds tandem stand for 10 s
This component evaluates static balance and postural control.
Gait Speed Test
Participants are instructed to walk at their usual pace across a short, pre-measured course, typically 4 meters (variations of 3–5 meters are acceptable depending on protocol). Timing begins when the first foot crosses the starting line and stops when the first foot crosses the finish line. Two trials are usually performed, and the fastest time is recorded.
The time is converted into categorical scores (0–4) based on established cut-off points. Shorter walking times (higher gait speeds) receive higher scores. This component reflects habitual mobility and has strong prognostic value for survival and disability.
Repeated ChairStand Test
Participants are asked to stand up and sit down five times as quickly as possible from a straight-backed chair (seat height ~43– 45 cm) with arms folded across the chest. Before the timed test, participants must demonstrate the ability to rise from the chair once without using their arms. If unable, a score of 0 is assigned.
Timing begins on the command “Go” and stops when the participant completes the fifth stand. Scoring (0-4) is based on completion time, with faster times receiving higher scores.
This test primarily evaluates lower-limb strength and power.
Composite Scoring
The total SPPB score is calculated as:
SPPBtotal = Balance (0 - 4) + Gait (0 - 4) + ChairStand (0 - 4)
Interpretation is commonly categorized as [2,3]:
a) 0–3: Severe functional limitation
b) 4–6: Moderate limitation
c) 7–9: Mild limitation
d) 10–12: Minimal or no limitation
Scores below 8 are frequently used as a threshold for frailty risk and increased vulnerability to adverse outcomes.
Dataset Description
Data source
This study utilized data from the English Longitudinal Study of Ageing (ELSA), a large-scale, nationally representative longitudinal cohort study of older adults living in England [1]. ELSA was initiated in 2002 and collects detailed multidisciplinary data biennially, including information on demographics, socioeconomic circumstances, physical and mental health, cognitive function, and biological measures. Over nine waves conducted between 2002 and 2019, nearly 20,000 individuals participated in at least one assessment cycle [1].
A distinctive feature of ELSA is the inclusion of objective physical performance testing, implemented during nurse visits in selected waves. Lower-extremity function was evaluated using tests derived from the protocol of the Short Physical Performance Battery (SPPB), extensively explained in Section 2, which is assumed to be a validated measure of mobility and functional status in older adults. Participants were asked to complete balance assessments, a timed walking test, and repeated chair rises. Because these assessments require trained personnel and standardized measurement conditions, they were administered only in waves 2, 4, and 6, corresponding to approximately fouryear intervals. Consequently, longitudinal prediction of objective physical performance in this study was feasible at 4-year and 8-year horizons.
To construct the analytical dataset, questionnaire data from one wave were paired with SPPB-derived outcomes from the subsequent wave. Specifically, responses from wave 2 were linked to physical performance results obtained in wave 4, and responses from wave 4 were linked to outcomes from wave 6. This design enabled supervised learning models to predict future objective functional status based solely on prior self-reported and demographic information.
It is important to note that the walking test conducted within ELSA differs slightly from the original SPPB protocol. Participants completed an 8-foot (2.44 m) walk rather than the standard 4-meter course. To ensure comparability with conventional SPPB scoring, gait speed thresholds were proportionally rescaled according to distance. This adjustment preserved the ordinal structure of the scoring system while accommodating the shorter walking distance.
The analytical sample was restricted to individuals aged 55 to 85 years at baseline. Participants younger than 55 were excluded to focus on ageing-related functional trajectories, while those older than 85 were excluded to reduce extreme-age heterogeneity and potential survival bias. After applying these criteria and excluding incomplete observations, the final dataset comprised 7,739 samples.
The resulting dataset exhibited class imbalance, with individuals maintaining high future SPPB scores substantially outnumbering those experiencing significant functional decline. This imbalance reflects the population-based nature of ELSA but necessitates careful methodological handling during model training and evaluation.
Feature Selection
The English Longitudinal Study of Ageing (ELSA) provides exceptionally rich data, with each wave comprising responses to approximately one thousand questionnaire items spanning socioeconomic conditions, health status, lifestyle behaviors, cognitive functioning, and social engagement. While this breadth offers substantial analytical opportunity, incorporating the full variable space into predictive modeling would introduce redundancy, increase noise, and elevate the risk of overfitting. Therefore, a structured feature selection strategy was implemented. The overall feature selection process combined clinical relevance, data-type consistency, and model compatibility considerations. By restricting predictors to interpretable health and function-related domains while retaining meaningful ordinal structure, we reduced dimensionality without sacrificing predictive capacity.
Feature Domain Restriction
Rather than employing all available variables, we first
constrained the feature space to domains with demonstrated
relevance to functional decline and mobility outcomes. Specifically,
we retained variables related to:
a) Self-reported health status and chronic conditions
b) Physical capability and mobility limitations
c) Activities of Daily Living (ADL) and Instrumental
Activities of Daily Living (IADL)
d) Demographic characteristics (e.g., age, sex, education)
e) Selected indicators of physical performance
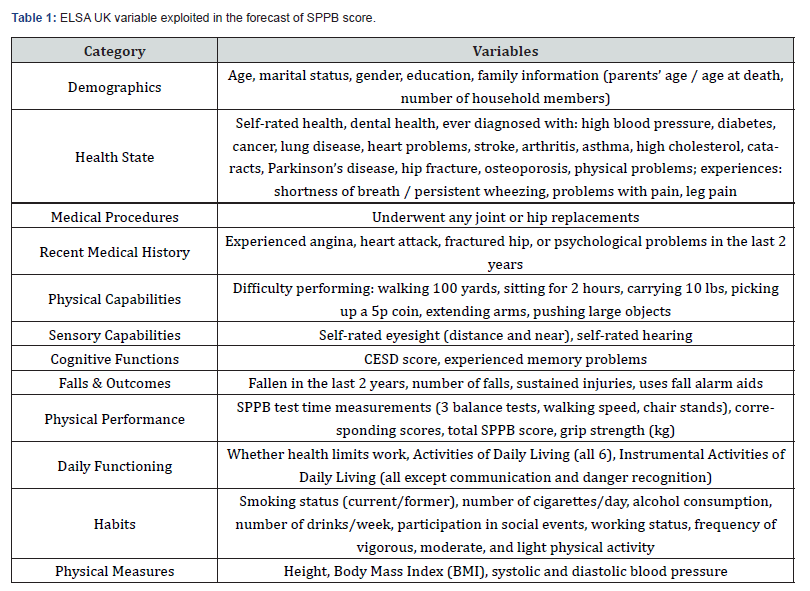
This domain-driven filtering ensured clinical interpretability while reducing dimensionality. The final list of selected predictors is reported in Table 1 below.
Variable Encoding and Data Representation
The resulting dataset comprised both continuous and categorical variables. Continuous variables (e.g., age, anthropometric measures) were preserved in numerical form. Most categorical variables were ordinal or binary by design. Binary responses (e.g., presence/absence of a condition) were encoded as 0/1. Ordinal variables were represented using monotonic integer encoding consistent with their inherent ranking. For example, in the case of self-rated health, lower numerical values corresponded to better perceived health, while higher values indicated poorer health.
Nominal categorical variables without intrinsic ordering were handled differently. Among these, marital status was the only feature requiring special encoding to avoid introducing artificial ordinal relationships into the model. This encoding strategy balanced preservation of semantic meaning with computational efficiency and ensured compatibility with both linear and treebased machine learning algorithms.
Derived and Composite Features
In addition to raw questionnaire responses, we incorporated
selected derived features to enrich the predictive signal. These
included:
a) Including baseline performance measures allowed the
models to capture both Component-level scores corresponding to
the balance, gait, and chair stand elements of the Short Physical
Performance Battery (SPPB) when available
b) The total SPPB score from the baseline wave, where
applicable. static health status and early functional trends, improving the
ability to forecast future physical capacity.
Experiments
Methods
To evaluate the feasibility of forecasting future physical performance from questionnaire-derived variables, we implemented and compared multiple supervised regression algorithms well-suited for structured (tabular) data. The selection of models aimed to cover a spectrum of methodological paradigms, including linear approaches, ensemble tree-based methods, and deep neural architectures [5,6].
The model families evaluated are described in the following paragraphs:
Ensemble Tree-Based Methods
Two ensemble learning techniques were examined: Random Forest Regression and XGBoost (Extreme Gradient Boosting). Both methods rely on decision trees as base learners but differ substantially in their training strategies.
Random Forest constructs multiple decision trees independently using bootstrap sampling and feature subsampling. Predictions are aggregated across trees, typically via averaging, which reduces variance and enhances generalization. The independence of tree construction promotes robustness against overfitting, particularly in moderately sized tabular datasets.
In contrast, XGBoost employs gradient boosting, where trees are trained sequentially. Each new tree is fitted to the residual errors of the ensemble constructed so far, thereby iteratively refining predictions. This sequential error-correction mechanism typically allows boosted trees to achieve higher accuracy, albeit with increased sensitivity to hyperparameter configuration.
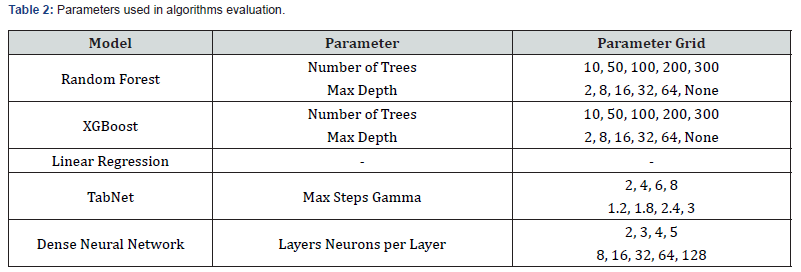
For both algorithms, we explored variations in:
a) The number of trees (estimators),
b) The maximum tree depth,
c) Additional regularization-related parameters (where
applicable).
This ensured assessment of model performance across different bias–variance trade-offs.
Linear Baseline Model
As a reference approach, we implemented ordinary least squares Linear Regression. This model assumes a linear relationship between predictors and the continuous outcome variable. Although limited in its capacity to model nonlinear interactions, linear regression provides a transparent benchmark and facilitates interpretability.
Neural Network Architectures
To investigate whether nonlinear feature interactions could be better captured through representation learning, two neural network configurations were evaluated.
Dense (Fully Connected) Neural Networks
We designed multilayer perceptron architectures consisting
of stacked fully connected layers. Multiple configurations were
tested, varying:
a) Number of hidden layers
b) Number of neurons per layer.
Each hidden layer was followed by batch normalization to stabilize training and improve generalization by reducing internal covariate shift. The output layer consisted of a single neuron for continuous outcome prediction. Activation functions and optimization procedures were kept consistent across experiments to ensure comparability.
TabNet Architecture
We further evaluated TabNet, a deep learning architecture specifically developed for tabular datasets (Arik & Pfister, 2021) [8]. Unlike conventional dense networks, TabNet processes features through a sequential decision-step mechanism that incorporates learned attention masks. At each step, the model selectively emphasizes a subset of features, enabling sparse and interpretable reasoning over the input space.
Two primary architectural hyperparameters were varied:
a) The number of decision steps, controlling the depth of
sequential reasoning,
b) The gamma parameter, which regulates the degree of
feature reuse between steps and influences the independence of
subsequent decision stages.
This configuration allowed us to assess whether attentionbased feature selection within the network improves predictive performance in longitudinal functional forecasting.
Hyperparameter Exploration
For all models, hyperparameters were systematically varied according to predefined ranges (summarized in Table 2 below). Model optimization was conducted using cross-validation, with performance evaluated on held-out data to ensure generalizability.
The comparative framework enabled assessment across three
levels of modeling complexity:
a) Linear assumptions (low capacity, high interpretability),
b) Ensemble tree methods (nonlinear, moderate-to-high
capacity),
c) Deep neural networks (high capacity, representation
learning-based).
Data Preprocessing
Prior to model development, the dataset was subjected to a structured preprocessing pipeline to ensure data consistency and compatibility with the selected machine learning algorithms.
Handling of Missing Data
As is typical in longitudinal cohort studies such as the English Longitudinal Study of Ageing, certain variables contained incomplete observations due to non-response or wave-specific measurement differences. Rather than excluding incomplete samples - which would have reduced statistical power and potentially introduced bias - we applied a data-driven imputation strategy.
Missing values were estimated using a k-Nearest Neighbors (KNN) imputation approach, as implemented in the scikit-learn library. This method replaces missing entries by aggregating information from the most similar samples in the feature space, thereby preserving multivariate structure and reducing distortion of variable distributions. The number of neighbors was selected based on empirical testing to ensure stable imputation performance.
Feature Scaling
Given the heterogeneous nature of the variables-including continuous measures, ordinal encodings, and binary indicatorsfeature scaling was applied to harmonize their numerical ranges. All predictors were normalized to a [0, 1] interval using min–max scaling.
This transformation was particularly important for neural network models, which are sensitive to input magnitude and distribution. Tree-based models (e.g., Random Forest and gradient boosting) are generally invariant to monotonic scaling; however, applying a uniform scaling strategy ensured methodological consistency across all evaluated algorithms.
Class Imbalance Analysis
The constructed dataset exhibited imbalance in the target distribution, with a predominance of individuals maintaining relatively high future physical performance scores. To investigate whether this imbalance adversely affected predictive performance, we conducted exploratory rebalancing experiments.
Two strategies were examined:
a) Oversampling of underrepresented outcome groups,
b) Noise-based data augmentation, whereby small
perturbations were introduced into minority-class samples to
increase diversity. thereby maintaining consistency with the sampled population.
Results
Model Performance Evaluation
Predictive performance was assessed using a 10-fold crossvalidation procedure to ensure robust estimation of model generalizability. In this framework, the dataset was partitioned into ten subsets; each subset was iteratively used as a validation fold while the remaining nine served for training. Reported metrics represent averages across all folds, thereby mitigating dependence on a particular train–test split.
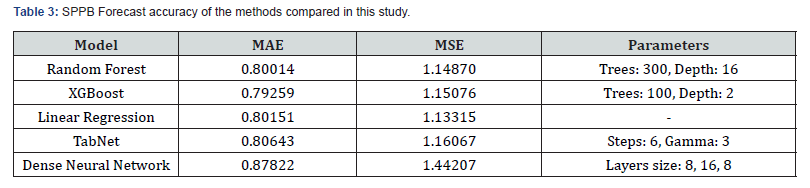
Model performance varied across algorithms and hyperparameter configurations. For each model family, multiple parameter combinations were explored, and the corresponding evaluation metrics-Mean Absolute Error (MAE) and Mean Squared Error (MSE)-are reported in Table 3 below.
Comparative Performance Across Models
Among the evaluated approaches, Extreme Gradient Boosting (XGBoost) achieved the strongest performance, yielding a Mean Absolute Error of approximately 0.79 points on the SPPB scale. This indicates that, on average, the predicted future score deviated from the observed value by less than one point.
Tree-based ensemble models, including both XGBoost and Random Forest regression, consistently outperformed linear regression. However, the performance gap between these methods was moderate. In contrast, fully connected dense neural networks did not demonstrate superior predictive capability and in some configurations performed slightly worse than ensemble methods. The TabNet architecture achieved competitive results but did not surpass the best-performing boosted model.
Overall, aside from dense neural networks, the majority of models produced similar error ranges. This convergence in performance suggests that the achievable predictive accuracy for this task may be constrained by intrinsic properties of the dataset and outcome definition rather than solely by model capacity.
Clinical Implications
Despite some structural limitations, an average absolute error below one SPPB point remains clinically meaningful. The model outputs provide valuable probabilistic insight into the trajectory of physical function over a four-year horizon. Even if exact point estimates occasionally deviate by one scale unit, the predictions can support early identification of individuals at risk for functional decline.
In practical terms, such forecasting capability enables anticipatory interventions-such as targeted exercise programs, fall-prevention strategies, or nutritional counseling-before clinically significant deterioration becomes evident through inperson functional testing.
Predictive use of the Approach in very Large Databases
The methodological framework developed in this study is not limited to the prediction of Short Physical Performance Battery (SPPB) outcomes. Similar modeling approaches have also been applied in related contexts where questionnaire-derived information must be integrated with other numerical physiological measurements. In particular, the proposed data fusion strategy has been explored in other health-monitoring scenarios in which the target variables were not functional performance scores, but measurements of blood pressure, heart rate, blood oxygen saturation (oximetry), and other indicators collected through affordable wearable devices [9,10].
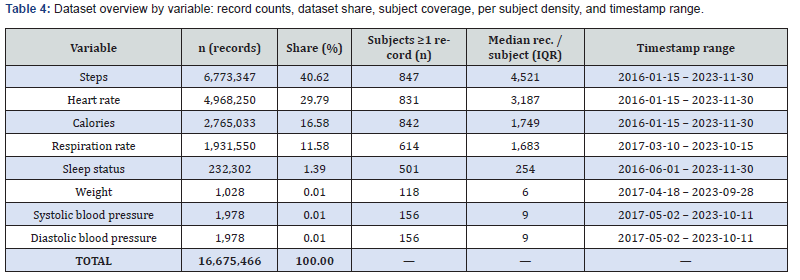
In several ECLEXYS projects, machine learning techniques and artificial intelligence algorithms were used to combine self-reported questionnaire data-capturing aspects such as perceived health status, lifestyle habits, and daily functioningwith continuous physiological measurements obtained from low-cost sensors deployed in home environments. Numerical data collected from a large number of outpatient assistance projects carried out by ECLEXYS also with international partners, and partly still ongoing, were first harmonized in format for consistent processing, producing a huge database containing over 16 million records distributed across eight variables: calories, heartrate, respiration rate, steps, sleep status, weight, systolic blood pressure, and diastolic blood pressure. These numerical measurements play in this case the role of SPPB scores in the previous research, and are listed in Table 4 below:
By using the same ML protocols described in section 4.1, the numerical data are analyzed along with questionnaire-based information or other input on the general status of the patient obtained from the tools developed in each project, e.g. the results of “serious games” proposed to counteract cognitive decline. The model is trained by interaction with specialized medical and geriatric personnel and the ML engine optimized to provide results useful for optimization of assistance and treatments.
Particularly interesting has been the use of the model to
predict the value of the indicators of intrinsic capacity:
a) Movement capacity
b) Cognitive ability
c) Psychological state
d) Vitality
e) Sensorial state
The forecast of the intrinsic capacity processing is based on the values previously collected in the system, and on ML-assisted estimate of their evolution incorporating questionnaire data. In some experiments focusing on a subset of the said indicators, a remarkable matching between prediction and actual values has been obtained, as shown in the radar chart in Figure 1. A less precise estimate of psychological state is due to the higher weight of non-measurable factors, whose use require a further improvement of the model, and to the intrinsically subjective self-assessment of mood and depression. In this experiment, the indicator “vitality” was not modeled.
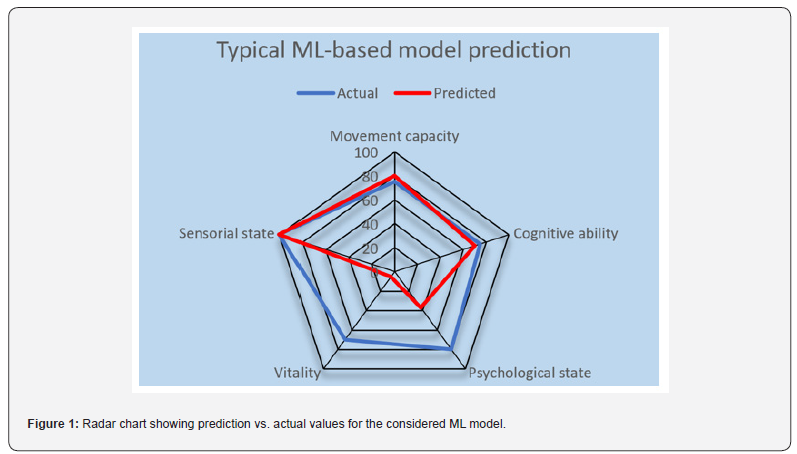
Overall, the resulting models demonstrated that combining subjective and objective data sources can improve the monitoring of health trajectories and support early detection of adverse trends. These experiences further confirm the flexibility of the proposed approach and suggest that similar predictive frameworks may be effectively extended to a wide range of digital health applications, particularly in remote monitoring systems designed for ageing populations.
Conclusion
This study investigated the feasibility of forecasting future lower-extremity physical performance using questionnairederived variables and machine learning techniques. Leveraging longitudinal data from the English Longitudinal Study of Ageing, we evaluated multiple regression-based approaches for predicting subsequent scores on the Short Physical Performance Battery (SPPB). The second phase of the study was dedicated to advancing forecasting concepts by leveraging data collected via wearable or environmental sensors. The ultimate goal was to define a model capable of combining these two approaches in a flexible and efficient manner, thereby providing a broader range of application scenarios for determining the trajectories of intrinsic capacity.
Among the examined methods, the Extreme Gradient Boosting (XGBoost) algorithm achieved the strongest predictive performance, with a Mean Absolute Error of approximately 0.79 SPPB points. However, the overall differences in accuracy between most evaluated models-particularly ensemble treebased approaches-were modest. This convergence suggests that model architecture alone may not be the primary limiting factor in prediction performance for this task.
To further examine dimensionality effects, feature subsets of 10, 15, and 20 predictors were selected using SHAP-based importance ranking. Notably, models trained on these reduced feature sets demonstrated performance comparable to that achieved using the full variable set. This finding indicates that a relatively compact group of clinically relevant predictors may capture a substantial portion of the predictive signal, improving interpretability without sacrificing accuracy.
The similarity of results across modeling techniques implies that predictive performance may be constrained by structural characteristics of the outcome variable and data source, rather than by algorithmic sophistication. The discretized nature of the SPPB score, combined with reliance on self-reported questionnaire inputs, likely places an upper bound on achievable precision. When transitioning to sensor-based methodologies, the primary challenges lie in the robust collection of data via smartphones or ad-hoc gateways, the inherent quality of the captured signals, and the subsequent processing of sanitized data using proprietary algorithms developed by the research team.
Future work may therefore benefit from reframing the
prediction task. Potential evolutions may include:
a) Modifying the prediction horizon to shorter or longer
temporal intervals.
b) Reformulating the outcome as categorical decline risk
rather than exact score regression.
c) Integrating complementary datasets with higherresolution
functional measurements.
d) Refining algorithmic frameworks to enable the
characterization and deployment of individual-specific behavioral
profiles.
In particular, incorporation of objective movement-derived features-such as detailed gait parameters or continuous inertial sensor signals collected during daily activities-could substantially enhance model sensitivity to subtle functional changes. Multimodal integration of questionnaire data with wearablederived metrics represents a promising direction for improving prognostic accuracy and enabling scalable, early detection of mobility decline.
The present findings demonstrate that the use of artificial intelligence and machine learning models can provide clinically meaningful forecasts of future SPPB scores using readily obtainable questionnaire data. While predictive precision is inherently limited by the structure of the outcome measure, the approach offers practical potential for remote risk stratification and proactive management of functional ageing. The predictive technology developed in the frame of this study didn’t stop at research level, but has been already integrated in commercial products and services offered on the market.
References
- Steptoe A, Breeze E, Banks J, Nazroo J (2013) Cohort profile: The English Longitudinal Study of Ageing. Int J Epidemiol 42(6): 1640-1648.
- Guralnik JM, Simonsick EM, Ferrucci L, Glynn RJ, Berkman LF, et al. (1994) A short physical performance battery assessing lower extremity function: association with self-reported disability and prediction of mortality and nursing home admission. J Gerontol 49(2): 85-94.
- Guralnik JM, Ferrucci L, Pieper CF, Leveille SG, Markides KS, et al. (2000) Lower extremity function and subsequent disability: consistency across studies, predictive models, and value of gait speed alone compared with the short physical performance battery. J Gerontol A Biol Sci Med Sci 55(4): 221-231.
- Studenski S, Perera S, Patel K, Rosano C, Faulkner K, et al. (2011) Gait speed and survival in older adults. JAMA 305(1): 50-58.
- Obermeyer Z, Emanuel EJ (2016) Predicting the future - big data, machine learning, and clinical medicine. N Engl J Med 375(13): 1216-1219.
- Rajkomar A, Dean J, Kohane I (2019) Machine learning in medicine. N Engl J Med 380(14): 1347-1358.
- Topol EJ (2019) High-performance medicine: the convergence of human and artificial intelligence. Nat Med 25(1): 44-56.
- Arik SO, Pfister T (2021) TabNet: Attentive interpretable tabular learning. Proc AAAI Conf Artif Intell 35(8): 6679-6687.
- Patel S, Park H, Bonato P, Chan L, Rodgers M (2012) A review of wearable sensors and systems with application in rehabilitation. J Neuroeng Rehabil 9(1): 21-37.
- Baker SB, Xiang W, Atkinson I (2017) Internet of Things for smart healthcare: technologies, challenges, and opportunities. IEEE Access 5: 26521-26544.

























